Bank Merger & Acquisition Review: 2011 & Q1 2012
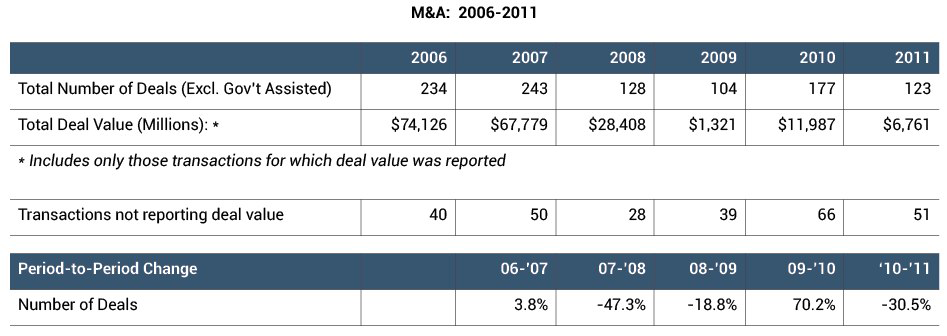
Despite an anticipated surge of transactions within the banking industry, bank merger and acquisition activity declined in 2011 compared to the prior year, hindered by a weak economic recovery, mounting regulatory pressures, and, according to some analysts, excessive seller expectations. Deal volume excluding government assisted transactions decreased 15.8% in 2011 from 2010 levels and approximated 2008 levels. It appears deal volumes bottomed out in 2009 at a total of 104 for the year. Unfortunately, the number of transactions not reporting a deal value has increased in recent periods (from 39 in 2009 to 51 in 2011), making a comparison of trends in deal values difficult. The number of deals presented is exclusive of FDIC-assisted transactions, which decreased to 92 in 2011 from 157 during 2010.
Deal value (for those transactions which reported it) totaled $6.8 billion in 2011 versus $11.7 billion in the prior year. Total deal value included PNC’s $3.5 billion acquisition of RBC Bank, which was announced in the second quarter of 2011, completed in the first quarter of 2012, and represented 51% of total reported deal value in 2011. Comerica’s $1.0 billion acquisition of Sterling Bancshares (announced in the first quarter and completed in the third quarter) accounted for 15% of total deal value during the year.
Notably, total deal value for transactions in 2010 included several sizeable acquisitions, such as BMO’s purchase of Marshall & Ilsley Corporation ($5.8 billion), Hancock Holding Company’s purchase of Whitney Holding Corporation ($1.8 billion), and First Niagara Financial Group’s purchase of NewAlliance Bancshares, Inc. ($1.5 billion). The following table provides additional perspective with regard to transaction activity in the banking industry since 2006.
As in 2010, the majority of acquisitions involved sellers with assets less than $500 million. As shown below, for deals for which pricing multiples and deal value were available (a total of 72 transactions), 56 transactions, or more than 75%, involved targets with assets less than $500 million.
Twenty-one of the 72 transactions for which pricing information was available were all-cash transactions, 35 deals involved some mixture of cash and other consideration (generally common stock), and 10 transactions involved common stock as currency. The remaining deals were unclassified or not reported.
Regional economic viability again affected transaction volume during the year. Deal volume was highest in the Midwest and West regions1, which reported 24 and 19, respectively, of the 72 total transactions with pricing multiples. The Atlantic Coast and Northeast regions followed with 11 deals each in 2011. Seven transactions occurred in the Southeast region. For comparison, FDIC-assisted transactions, which totaled 92 in 2011 compared to 157 in 2010, continued to be concentrated in states with severely depressed real estate markets, such as Florida and Georgia (both in the Southeast region), which had 13 and 23 bank failures, respectively, during 2011. Illinois and Colorado followed with nine and five failures, respectively, and all remaining states reported less than five failures each during the year.
Through March of 2012, a total of 16 bank failures were reported with eight attributable to the Southeast region. Florida and Tennessee each reported two failures, while Georgia reported four, and Illinois reported three failures. For comparison, through March of 2012, transaction volume was higher with 56 total deals reported (compared to 47 in the first quarter of 2011). Total reported deal value through the first quarter of 2012 was also higher at $3.0 billion (compared to $1.5 billion in the first quarter of 2011) and included Mitsubishi UFJ Financial Group’s $1.5 billion acquisition of Pacific Capital Bancorp as well as Prosperity Bancshares’ $529 million acquisition of American State Financial Corp. Deal volume in the first quarter of 2012 was weakest in the Northeast, where four transactions occurred, while deal volume was higher in the Midwest and Southeast, which reported 25 and 13 transactions, respectively.
Some analysts have attributed the heightened transaction activity in the first quarter of 2012 to the improved economy and an increased confidence among buyers, and, in particular, confidence with regard to loan portfolio assessment. Transaction activity going forward is expected to remain concentrated among smaller institutions in light of revenue and regulatory challenges. However, uncertainty concerning regulatory changes and the resulting burdens placed on institutions (smaller ones in particular), coupled with market volatility and the heated political climate, still looms, threatening any impending, potential surge of transaction activity.
Furthermore, capital raising remains difficult, and lackluster market activity caused many institutions to look to private equity firms as a source of capital in 2011. Preferred stock issuances were successful for several firms during the year, and some analysts expect more buyers to utilize such issuances to finance acquisitions when consolidation activity resumes.
Endnote
1 The regions include the following states:
- Atlantic Coast – Delaware, Florida, Maryland, North Carolina, South Carolina, Virginia, West Virginia, Washington, D.C.
- Midwest – Iowa, Illinois, Indiana, Kansas, Michigan, Minnesota, Nebraska, North Dakota, Ohio, Oklahoma, South Dakota, Texas, Wisconsin
- Northeast – Connecticut, Maine, Massachusetts, New Hampshire, New Jersey, New York, Pennsylvania, Rhode Island, Vermont
- Southeast – Alabama, Arkansas, Georgia, Kentucky, Louisiana, Missouri, Mississippi, Tennessee
- West – Alaska, Arizona, California, Colorado, Hawaii, Idaho, Montana, Nevada, New Mexico, Oregon, Utah, Washington, Wyoming
Originally published in Mercer Capital’s Bank Watch, May 2012.


