Many people believe that the win/loss ratio doesn’t have much effect on revenues and attendance. They believe the local team has loyal fans who will attend games despite their performance. We investigate that assumption in this article focusing on Major League Baseball (MLB) by sampling a top tier, middle tier, and lowest tier team.
We analyze average season attendance of the league over the last five years and then track the three-team sample’s attendance and on-field performance.
We have selected three teams to review their attendance vs. winning percentage, along with their playoff and World Series performance. Our sample consists of the Los Angeles Dodgers, the Texas Rangers and the Miami Marlins.
As a reference point, average season attendance for the MLB reached a peak in recent years at 2.5 million in 2007 for the American League and 2.8 million for the National League. The MLB averages dropped in the subsequent years and were finally steady around 2.3 million for the A.L. and 2.5 million for the N.L. during the next ten years. League attendance average declined, however, by 140,000 to 2,161,376 in 2018 and 2,039,521 in 2019.
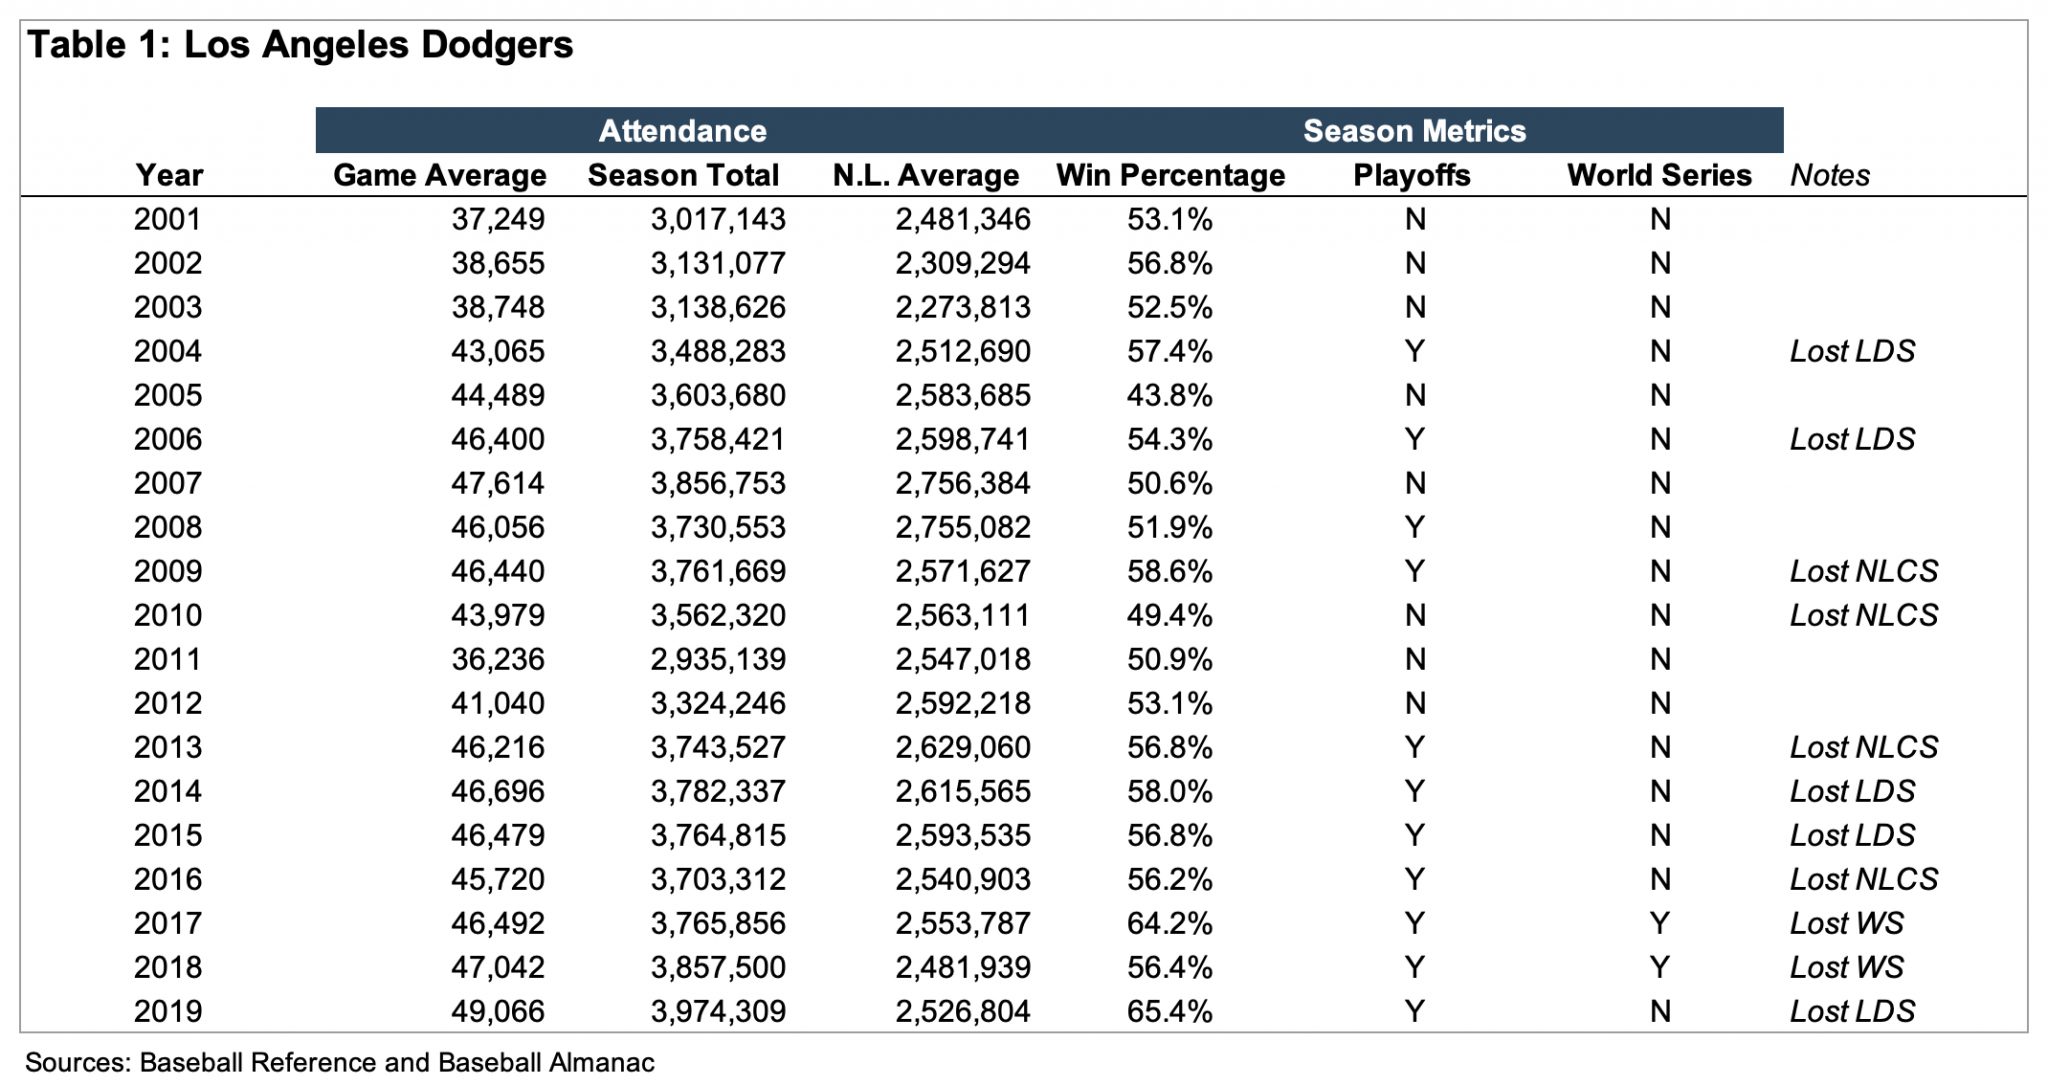
The Dodgers attendance in 2007 was 3.9 million and stayed above 3.4 million for three years. This figure dropped to 2.9 million in 2011 yet returned to 3.7 million by 2013. Recently, season attendance has slowly climbed to approximately 4 million in 2019, marking an all-time team high.
This growth was greatly influenced by the Dodgers being in the World Series in 2017 and 2018, which helped push 2019 to a record high attendance. (See Table 1 for details)
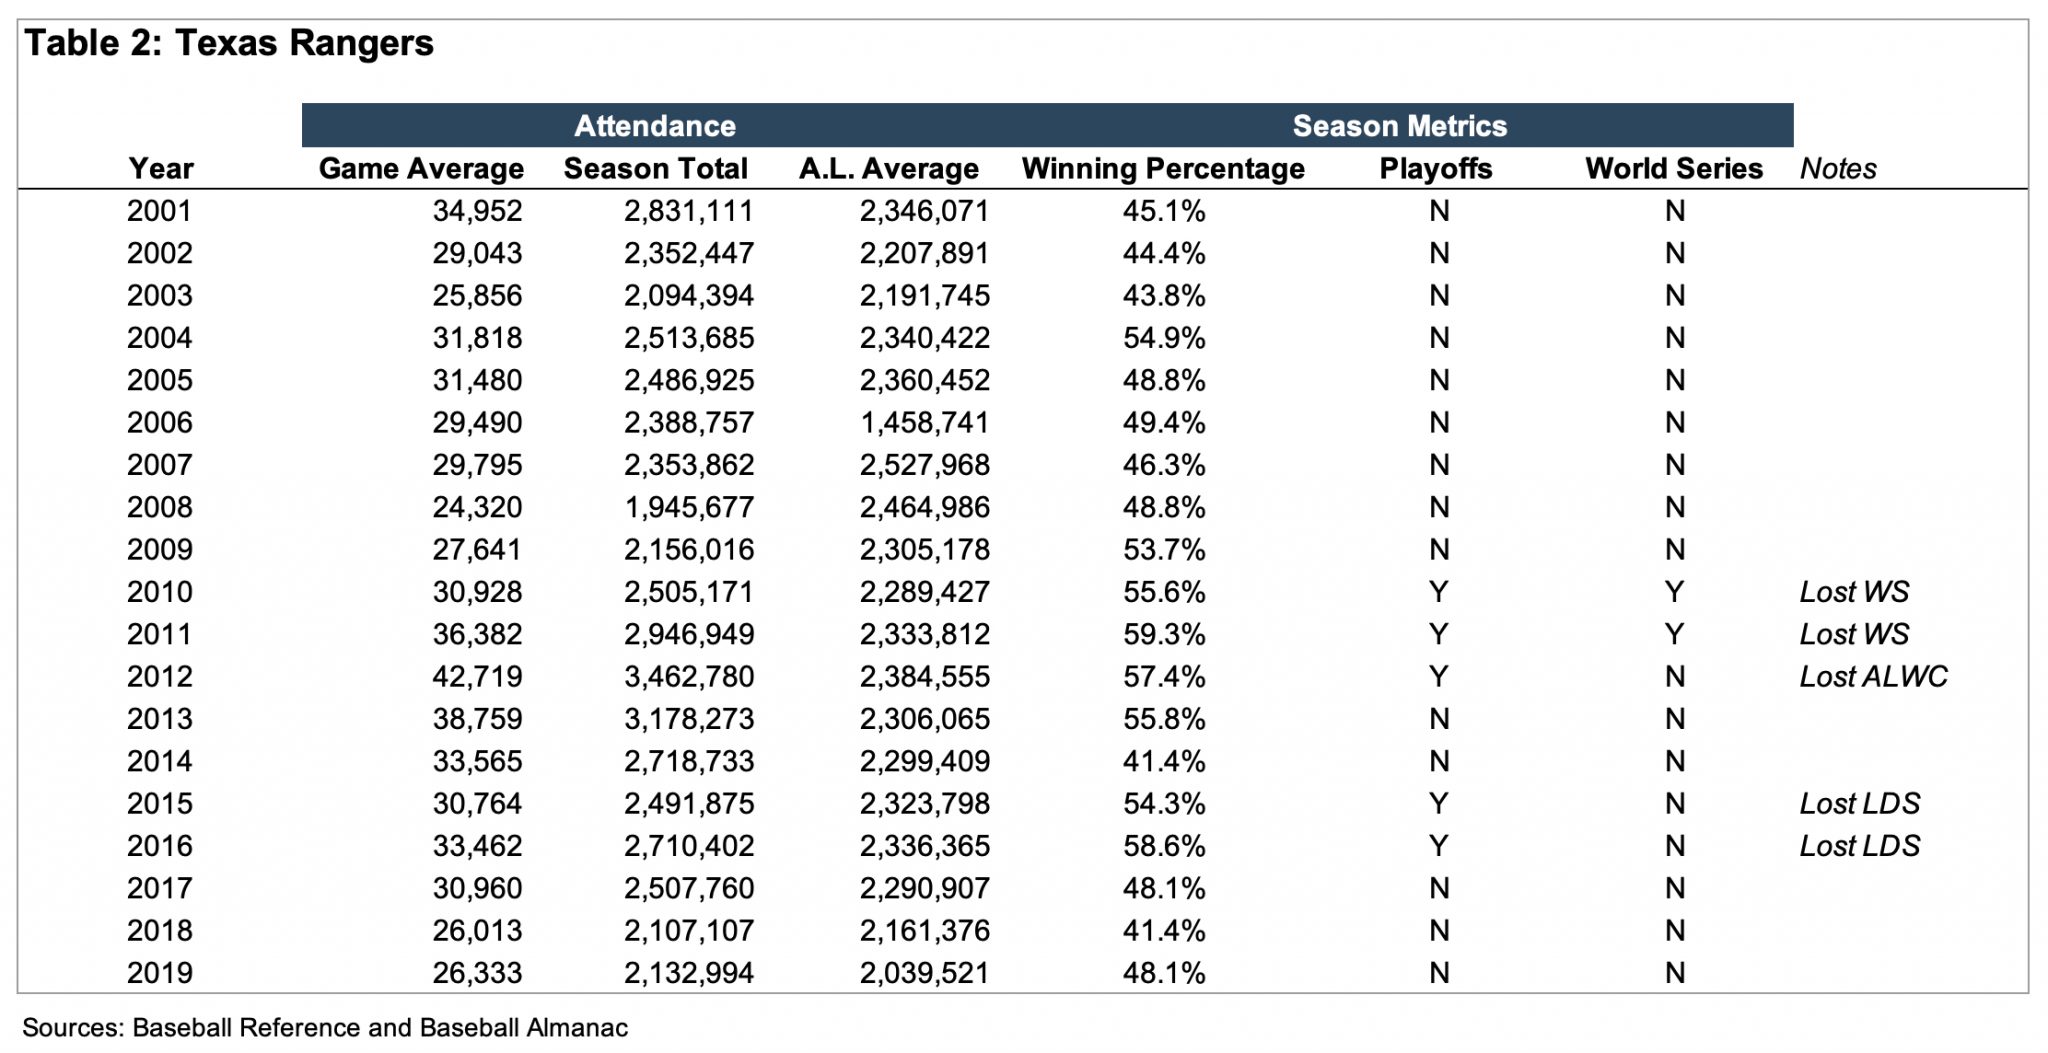
The Texas Rangers have experienced a different attendance history. They peaked in 2012 at 3.5 million after playing in the World Series in 2011 and the playoffs in 2012. The team didn’t make the playoffs in 2013 and 2014 and attendance dropped to 3.2 million and 2.7 million, respectively. The win/loss record dropped significantly from about 59% in 2011 to 41% in 2014.
Attendance followed the same trend by dropping 450,000 to 2.7 million in 2014. Even when the team made the playoffs in 2015, attendance fell to 2.5 million as a result of their poor record in 2014. The team’s 2015 win/loss ratio was near 59% and they made the playoffs, but not the World Series. In the following year, attendance increased to 2.7 million. The win/loss ratio dropped below 50% in 2017 to 2019 and they missed the playoffs each year. As a result, attendance dropped steadily to 2.1 million in 2019, a decrease of over 1.3 million people, or 38% from their peak in 2012. (SeeTable 2 for details)
The Miami Marlins clearly represent the bottom tier of the MLB in many categories. They built a brand-new state of the art ballpark in 2012 and attendance averaged about 1.7 million from 2014 to 2017. In the fall of 2017, the Derek Jeter group bought the team. and the new owners quickly traded notable high-priced players to other teams, including the NY Yankees, in order to reduce their losses. The new ownership group was hoping to stabilize attendance near the 1.7 million mark, but instead dropped to 811,000 in both 2018 and 2019; 367,000 less than the next worst attendance in MLB, which was Tampa Bay, and about 500,000 less than the third worst team, the Baltimore Orioles. (SeeTable 3 for details)

Without attempting to do a statistical analysis, what does the data mean? Yes, the quality of the players counts – especially if the win/loss record corresponds, however, winning percentage also impacts the ability to get into the playoffs and ultimately the World Series. It is clear from our experience and from the three-team sample that win/loss ratios have a major effect on MLB home stadium attendance.