PV-X: WACCs for E&P Companies


In the oil and gas industry, standardized reporting and industry analysts typically use a 10% discount rate on projects’ future cash flows. In this post we explain how such a discount rate is calculated and its effects on valuation; and then discuss a model that provides the discount rates that exploration and production companies face in the current market.
Exploration and production companies often use a standardized 10% discount rate in discounted cash flow analysis. The rate appears in oil and gas companies’ reserve reports, where it is used to generate a PV-10 value (an estimate of the pre-tax discounted cash flow value of the company’s cash flows generated from its proved reserves). This standardized discount rate also appears in other calculations where a quick, rough estimate of the present value of a project’s cash flows is needed.
Having a sense of a company’s WACC, then, can lead to a more realistic assessment of the value of a company’s reserves. Despite the prevalence of the 10% value, it is unclear how closely this discount rate aligns with reality. Even if the rate is a general benchmark for the industry as a whole, it is unclear how it varies from company to company and region to region. Such information would help determine the oil and gas prices at which companies can justify raising funds for new drilling—at what point US drilling activity might start to recover. The information would give investors a better sense of whether the PV-10 value is a fairly reasonable statement, an overstatement, or an understatement of value. And for companies, it can help them in transactions to understand how they and another company might find very different value in the same reserves.
There are several factors in the current market that might push the current discount rate higher or lower than the standard rate of 10%. The first key factor is the low interest rate on government bonds. Interest rates on debt are found by adding a credit spread based on the perceived financial health of the company to the risk-free government bond rate. Thus when interest rates are low, the cost of borrowing is low. Since equity investors compare the returns of the equity market to the debt market, a lower return on debt leads them to require less return on equity. Therefore the low interest rate environment should be a strong force pushing the WACC below 10%. At the same time, the recent volatility in oil prices has increased uncertainty and volatility in the industry, causing investors to require higher returns on investments and creating a higher cost of capital.
Analysis
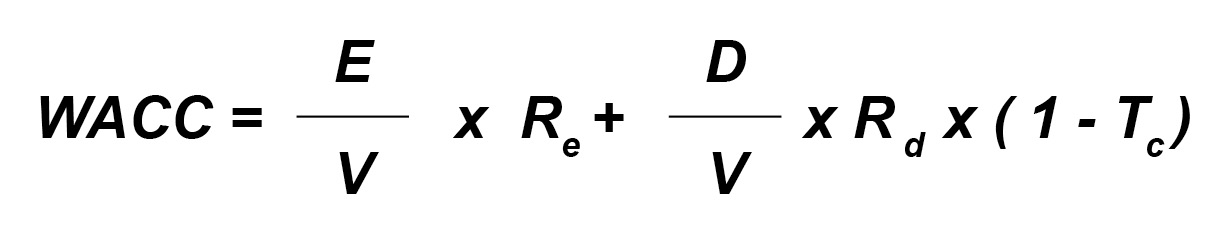
To better understand the combined effect of these factors, and many others, on the cost of capital for oil and gas companies, we have analyzed WACC for seven groups of publicly traded oil and gas companies.1 We made one important assumption in our analysis—that the funding for the next project would not dramatically differ from a company’s current capital structure. The model does not find optimal company WACCs, but attempts to estimate companies’ WACCs with their current capital structure. With or without this assumption, finding the WACC for each company requires calculating the cost of equity and the cost of debt. The CAPM model (required return on equity=risk-free rate + beta*equity risk premium) was used to calculate cost of equity.2
We created two models, using different methodologies to calculate the cost of debt, in order to calculate the WACC. The first method of calculating the cost of debt is fairly standard for a WACC calculation. The model multiplies the current effective interest rate (which is the interest expense divided by simple average of debt at the beginning of last twelve months and end of period) by one minus the company’s marginal corporate tax rate.
The second method gives what we think of as a projected future cost of debt for long-term projects (such as oil and gas production). It uses S&P’s company credit ratings, and S&P’s 20 year corporate bond yield curve for bonds of different ratings to assign an interest rate on new loans for a company. The key advantage to this method is that it gives a pre-tax cost of debt based on what the debt market, or at least S&P, assumes it would cost to raise more debt, rather than generating a number based on historical rates. However, these companies have never actually had to pay that amount for debt in the past. Because of this trade-off, the WACCs for companies were calculated using both this method and the standard WACC calculation.
The Results
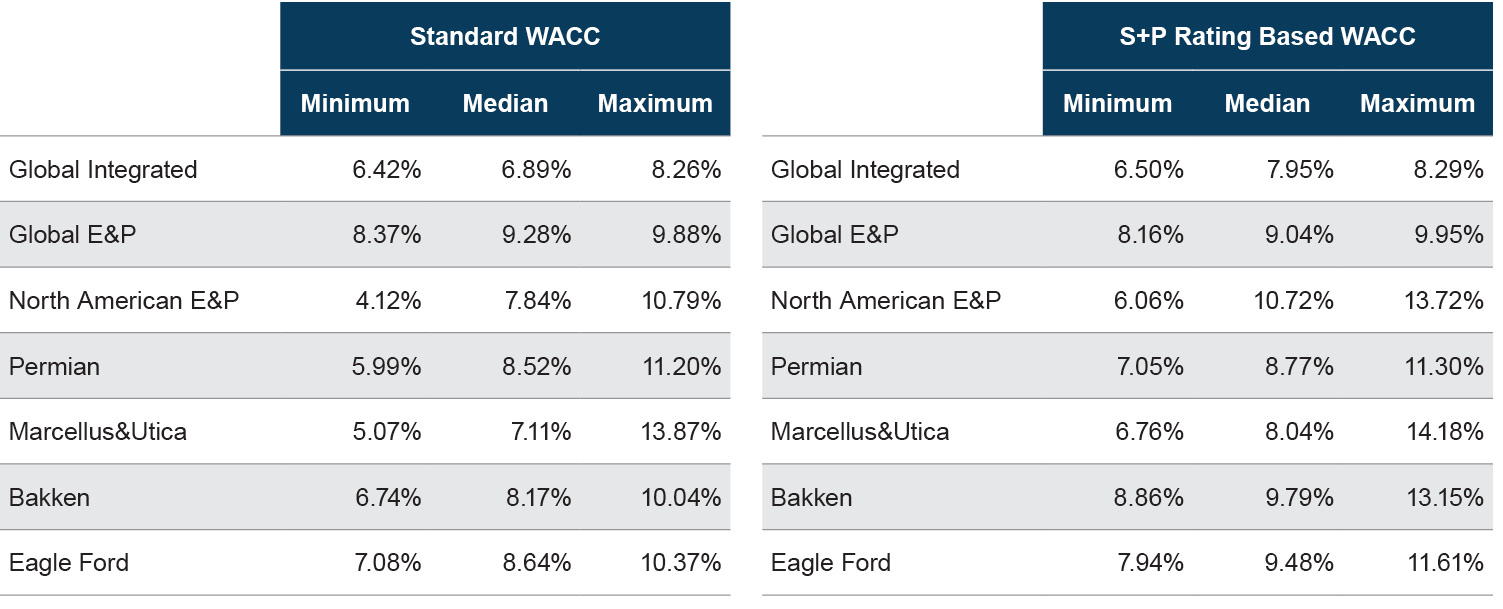
The model’s outputs suggest that the standard 10% discount rate is a higher cost of capital than companies are actually facing in the current environment. The unusually low government interest rates have lowered required returns so that even with the recent volatility in the industry, the oil and gas WACC is below what was once considered a reasonable standard. However, how far off the 10% rate is depends on whether one looks at the WACC for these companies based on the standard cost of debt or the projected cost of debt using S&P ratings.
A standard WACC cannot always account for the rapid rise in leverage some companies have experienced. For companies producing primarily in North America or North American regions, the minimum standard WACC for each group is based on a company with debt representing over 80% of its capital structure. These companies have low WACCs because the calculation is based on interest rates they obtained in the past when they were less leveraged. Now, due to falling oil prices, their equity values have shrunk and many companies’ remaining capital is mostly composed of old debt. Therefore, that cost of capital appears quite low. However, if the company were to try to raise new funds for a project, their current leverage—and the risk of default associated with it—would force them to pay a very high cost for either debt or equity. Thus, using these numbers overstates the value of reserves, especially for struggling companies.
A more contemporary picture of the value of companies’ proved reserves is provided by the S&P ratings based WACC.3 In the case of the Bakken, the most levered company, Halcón Resources, which by the standard measure has the lowest WAAC in the group (6.23%), now has the highest (13.15%). This adjustment now appears particularly relevant as Halcón has filed for bankruptcy. In the Permian, the company with the minimum WACC went from one with over 85% debt to one with only 12% debt. At the same time, not all highly leveraged companies are automatically punished by this model and assigned the highest WACCs. For some, this capital structure may be optimal, and other factors may bolster their S&P credit rating.
The S&P rating based WACC model shows that right now a standard discount rate for North American E&P companies should be around 9.4%. Using this rate in the Bloomberg break-even model drops the break-even price 2-3.5% depending on the area. As for the PV-10 calculation: if it were instead a PV-9.4 calculation, those proved reserves included in the PV-10 calculation would be more valuable. Additionally, more reserves would be included in the PV- 10 calculation, as the engineers evaluating the reserves would include some reserves that were once not considered to be economically viable due to the PV-10 value. Therefore a current PV-10 understates the present value of reserves relative to a PV-10 in periods where 10% is the average discount rate.
For a more detailed discussion on the valuation process and how Mercer Capital can use its years of oil and gas valuation experience to help you, please contact a Mercer Capital professional.
End Notes
1 The seven groups include four groups of companies that generate over 50% of production from the Eagle Ford Shale, the Permian Basin, the Bakken, or the Marcellus Shale and Utica Shale; a group of companies having over 90% of production in North America but who are not concentrated in the previously mentioned regions; a global integrated group; and a group of global E&P companies.
2 We used the yield on twenty-year treasuries as our risk free rate. A two year Beta was used, because we feel investors considering an oil and gas company investment would base their decisions largely on what has happened since the fall in prices that began two years ago. Mercer Capital regularly reviews a spectrum of studies on the equity risk premium, as well as conducting its own study. Most of these studies suggest that the appropriate large capitalization equity risk premium lies in the range of 4.0% to 7.0%. The chosen equity risk premium of 5.50% represents a composite assumption which is consistent with this range. The model does not, however, apply a country specific risk premium for global companies, and so global companies’ WACCs are likely understated by the model.
3 Not all of the companies in our sample had S&P credit ratings so some were excluded from our analysis. We ran a control group in order to test whether the exclusion of some companies would bias the model. We estimated the ratings of companies without a rating based on the ratings received by other companies in the group with similar debt to enterprise value ratios. The results suggested the reduction in the number of companies did not significantly affect the model.