Refining Overview


There are four main components to refined product prices: (1) Input Prices (i.e. crude oil), (2) Wholesale Margins, (3) Retail Distribution Costs, and (4) Taxes. Generally, input prices and wholesale margins drive fluctuations in product prices as the last two are relatively stable. Thus, in order to understand refined product prices we consider the macroeconomic trends in the global oil and gas market which drive input prices.
Oil and Gas Market Overview
Global oil production outpaced global crude demand for almost a year which led to a plummet in oil prices in mid-2014. Oil prices have remained depressed since then and an oversupply of crude caused downward pressure on the price of crude oil which for months benefitted refiners as their product costs fell. A shortage of crude storage forced producers to sell crude at increasingly low prices to refiners, who then could earn substantial profits.
In a move that surprised many markets, OPEC instituted production cuts for the first time in eight years following a November 30, 2016 meeting. OPEC planned to reduce output by 1.2 million barrels a day by January 2017. In addition, Russia, who is not a member of OPEC, agreed to cut oil production. The reduction in output is designed to reduce high inventory levels around the globe. The cuts are expected to be effective through May 25, 2017, at which time OPEC may opt to extend the cuts an additional six months.
Oil prices may have found a new home around $50-$60 per barrel, which remains below normal levels, but exploration and production activities have recovered partially. The Baker Hughes North American (U.S.) total oil rig count increased by 32% over the year ended February 3, 2016. Crude oil prices (“WTI”) ended 2016 nearly 45% higher than year-end 2015. The WTI gain is the first annual price increase in two years, and is the largest annual gain in seven years.
The oil and gas industry is heavily regulated. The future impact of many regulations surrounding the oil and gas industry however is uncertain as President Trump ran as a friend to the oil and gas sector and promised to reduce regulations on the industry in order to boost the U.S. economy. Additionally, Oklahoma Attorney General Scott Pruitt is on his way to becoming the next Environmental Protection Agency administrator. Pruitt has openly opposed the EPA, which is one of the main regulators of the refining industry. As we work to understand the current position of refiners, it is key to analyze the impact of legislation and regulation surrounding the industry.
Refining Regulation
In early 2016 the crude oil export ban that had been in place since 1975 was lifted. Industry experts thought that the lifting of the export ban would better align the production capabilities of U.S. refineries. Refiners, on the other hand, feared that the exportation of crude oil would increase crude prices, as the pressure on price in an oversupplied U.S. market gave way. However, due to the state of the global oil market there is not much incentive to buy crude oil from the U.S. in the current market. Currently, it is estimated that less than 400,000 barrels per day (bpd) is being exported form the U.S. Once the Brent-WTI spread widens, and it is cheaper for other countries to buy WTI and pay transportation costs than to buy Brent, we may better understand the effect of the lifting of the ban.
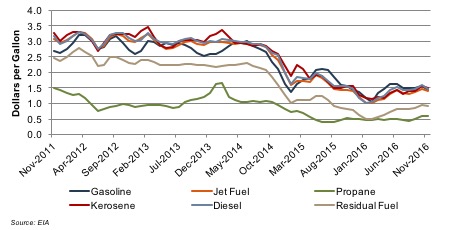
Although the price of crude oil remains low in comparison to historical levels, refined product prices fell to a similar extent as crude prices. As shown below, the price of gasoline fell to a low of $1.05/gallon in February 2016, which was almost one-third of the price of gasoline in July 2014. Since February the price of gasoline has increased 36%. In general, refined product prices have fallen over the last two years but have seen some recovery over the last 10 months.
Additionally, operating expenses have increased with the cost of Renewable Identification Numbers (RINS). The Renewable Fuels Standards (RFS) Program has had a significant impact on the refining sector over the last year. The RFS were signed into law by President George W. Bush in order to reduce greenhouse gas emissions and boost rural farm economies. Each November, the EPA issues rules increasing Renewable Fuel Volume Targets for the next year. RINs (Renewable Identification Numbers) are used to implement the Renewable Fuel Standards. At the end of the year, producers and importers use RINs to demonstrate their compliance with the RFS. Refiners and producers without blending capabilities can either purchase renewable fuels with RINs attached or they can purchase RINs through the EPA’s Moderated Transaction System. While large integrated refiners have the capability to blend their petroleum products with renewable fuels, small and medium sized merchant refiners do not have this capability and are required to purchase RINS, which have significantly increased in price. A common theme across refiners’ earnings calls last quarter was the effect of the rising cost of RINs on already squeezed margins. President Trump promised to help small and medium sized merchant refiners who were disadvantaged by RFS, but he also spoke fondly of the program during his campaign. It appears that many Republican lawmakers hope to repeal or reform the Standards, but the future of the Standards and the RIN system is still unclear.
Other regulations that might affect refiners’ margins going forward include the Petroleum Refinery Sector Risk and Technology Review (RTR) and the New Source Performance Standards (NSPS). Last December the RTR & NSPS rule was passed in in order to control air pollution from refineries and provide the public with information about refineries’ air pollution. These regulations range from fence line and storage tank monitoring to more complex requirements for key refinery processing units. The rule was expected to be fully implemented in 2018 however the expected new head of the EPA makes us to question the future implementation of the rules.
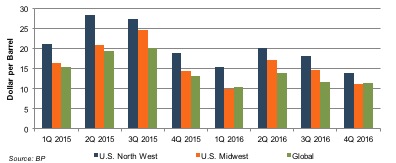
We can understand refiner’s current earning power through the refiner maker margin. The refiner marker margin (RMM) is a general indicator, calculated quarterly by British Petroleum, which shows the estimated profit refiners earn from refining one barrel of crude.
Refiners’ margins increased dramatically in the second and third quarters of 2015 as the price of crude fell and the price of refined petroleum products lagged behind. Refiners in the U.S. North West were making between $27 and $28 per barrel of oil, while global margins barely reached $20 per barrel. However, in the fourth quarter of 2015 refined product prices fell, refiners’ margins tightened, and the geographic gap in margins narrowed. After some relief in margin pressure in the second quarter of 2016, margins tightened to the lowest seen in three years.
M&A
M&A activity in the refining sector was sluggish in the first half of 2016, partially due to the uncertainty which surrounded the refining industry and future regulation. However, M&A activity picked up in the third and fourth quarter of 2016. The chart below shows key valuation metrics associated with refining transactions which were announced in 2016.
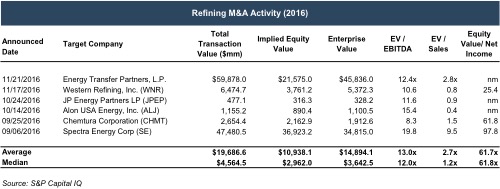
Overall, valuation multiples are inflated, demonstrating that companies are buying the future earnings potentials of refiners and are not too discouraged by currently low earnings.
Mercer Capital has significant experience valuing assets and companies in the energy industry, primarily oil and gas, bio fuels and other minerals. Our oil and gas valuations have been reviewed and relied on by buyers and sellers and Big 4 Auditors. These oil and gas related valuations have been utilized to support valuations for IRS Estate and Gift Tax, GAAP accounting, and litigation purposes. We have performed oil and gas valuations and associated oil and gas reserves domestically throughout the United States and in foreign countries. Contact a Mercer Capital professional today to discuss your valuation needs in confidence.