Thoughts of a Non “Oil Price Guru”


On February 27, 2017 the Wall Street Journal (WSJ) published an article titled “The Rise of a Global Oil-Price Guru”. Simply put, Gary Ross knows anyone and everyone in the energy world. From the west coast of California, east to the Arab Sheiks and beyond, there is no one better connected. Mr. Ross solidified his fame by predicting the 2014 crash in oil prices, which after 40 plus years in the industry, is probably another “notch on the belt” for this highly respected price forecaster. In short, he is the most sought after oil information broker in the world. The information he gleans from his network is then used to advise clients on the future price of oil. While we do not claim to have the same network or prediction abilities as Ross, our predictions for oil prices come with a lower price tag (none at all) than Ross’ more than $50k consulting fee.
This week is CERAWeek. After a two year long price war between Middle East producers and shale producers in the U.S. and three months after OPEC production cuts, members of OPEC will meet in Houston, Texas to present to major integrated and independent E&P producers of U.S. oil. Those in attendance will listen to see if OPEC plans to extend their production cuts past their June expiration and to understand how quickly shale producers plan to boost output as the price of oil rises. CERAWeek solicits us to look back at the collapse of oil prices, what this meant for E&P companies and financial markets, and what we expect going forward.
The Collapse of Oil Prices
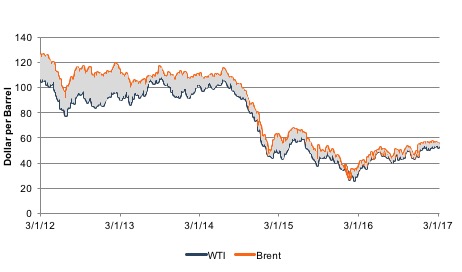
Since the price of oil started falling in 2014, industry participants and experts have expected the price to rebound. Over two years later, a rebound has not occurred. Oil prices, which hover between $50 and $55 per barrel with limited volatility and previous six month average price of $50 per barrel, are nowhere near the top price from 2014 of $108 per barrel.
Headlines over the last few years can be summarized in two words: Excess Supply.
March 2015: We Have an Oil Glut
Producers are pumping nearly 1.5 million barrels a day more crude than the world needs, due to a combination of slowing demand and rising production in the U.S. That means oil put in storage today could be there for years, analysts say. Should the glut worsen, more producers could be forced to shut their wells, effectively storing the oil in the ground.
February 2016: Producers Keep Pumping to Maintain Market Share
Several of OPEC’s lowest-cost producers, led by Saudi Arabia, have moved to keep production high in order to compete with booming production from elsewhere around the world, especially North America. That has brought prices down more than 70% from the highs of 2014, but Saudi Arabia, Russia, and other leading producers from around the world have not been willing to pull back and have instead pushed to keep outdoing the competition.
February 2017: An Oil Hangover
The S&P 500 slipped into an earnings recession in the April-to-June period of 2015 that would last until the third quarter of last year when oil prices had once again been rising. […]Low oil prices also weighed on inflation, helping keep the rate of annual prices increases, as measured by the Consumer Price Index, below the Federal Reserve’s 2% target for more than two years that ended in November. […] That impacted the central bank as well, which has moved slowly in lifting interest rates.
Headlines mostly discussed supply side issues, but it is important to understand that demand side of the equation as well. Demand factors are fairly benign. The IEA sees very little change in demand in the near term which could ease excess supply.
Corrective Legislation
The low price of oil rippled across financials markets, put pressure on corporate earnings, and took down many E&P companies when prices collapsed. We saw E&P companies, the U.S. government, and international organizations respond to try to ease the pain caused by falling prices.
In early 2016 U.S. lawmakers hoped to ease some of the pressure on price and lifted the crude oil export ban that had been in place since 1975. However, due to the state of the global oil market there was not much incentive to export crude oil from the U.S. The spread between WTI and Brent has tightened as the U.S. developed more pipeline capacity and increased oil exports and the price of Brent fell faster than the price of WTI. In 2014, the average spread was $6.50, 2015 was $4.80 and in 2016 the average was $1.70. Thus far, for the first two months of 2017 the average daily spread is $2.67.
Once the Brent-WTI spread widens – and it is cheaper for other countries to buy and transport WTI than to buy Brent – we may better understand the effect of the lifting of the ban. The WSJ wrote recently:
Now, after a slow start, exports are starting to gain traction. The U.S. has exported an average of 623,000 barrels a day of crude oil so far in 2017, 42% more than the same period of 2016. That figure still pales in comparison to the 8.6 million barrels the U.S. imports every day from places like the Middle East.
In 2015 OPEC decided to increase production and maintain market share. This decision pushed the price of oil even lower and forced OPEC in a pricing war with the U.S. shale producers. In December of 2016, however OPEC struck a deal to lower production to 1.2 MMBPD. History tells us an OPEC change in production, directly impacts the price of oil. While this holds true, the magnitude of such production cuts is not the same as it once was. The production cuts of OPEC do nothing to curb the production habits of North American producers. As a result, prices are somewhat resilient to changes in OPEC production as North American production will fill in the gaps.
E&P Companies
With the apparent new normal of $50 oil, energy companies have been extremely active buying up assets in low cost plays, most notable the Permian Basin. Reuters reported that “shale activity is humming in the hottest U.S. oilfield, the Permian Basin, a 75,000 square mile expanse in West Texas. The U.S. land drilling rig count is up 55 percent in the past 12 months, and many of them are in the Permian.”
Meanwhile, DUC counts are watched closely as companies consider completing previously drilled wells in order to increase cash flow at the expense of putting further pressure on oil prices as more supply is brought on.
Further, based upon the “land grab” activity that took place in 2013 and 2014, before oil crashed, there should be numerous leaseholds set to expire. Typically, when E&P companies look to lease acreage specific time periods are laid out in the contract in what we will call, the “drill it or lose it” clause. E&P companies usually have three years to drill and test a well for production. Once production is obtained the lease is considered held by production and the E&P can continue to produce from that well on that leasehold until the well is not economical to operate. While many E&P’s signed lease agreements in 2013 and 2014, while oil averaged $95 or higher, certain drilling prospects were profitable at those levels, but there were so many that all could not be drilled at once. However, once the oil price crashed, many prospect wells were uneconomical, so E&P companies delayed drilling wells until the price of oil recovers. Based upon the outlook for oil, it does not appear $60 to $100 oil is coming anytime soon. Many of leaseholds will expire without drilling while some may dare to drill to hold the position and hope for higher oil.
With gluttonous amounts of oil worldwide and little hope for significant increases demand going forward, what are E&P companies focusing on in this current environment?
- Lowering Cost. Companies are working to lower costs in order to improve profitability. In order to reduce expenses, Companies are looking at new engineering methods and new drilling locations. BP has set their break-even target at $35 and is looking to invest in low cost areas such as like Abu Dhabi.
- Increasing Production in Shale Plays. BP plans to increase production by an average of 5% over the next five years adding more than 200k barrels a day. Exon announced that it will spend 25% of its capex budget in Texas, New Mexico and North Dakota in shale plays.
Where are We Headed?
These somewhat complex and political supply factors paint a stable picture of oil prices, which at $50 per barrel is a far cry from 2013/ 2014 peaks. With North America focusing on profitable plays such as the Permian at the current price and a significant inventory of DUC’s waiting to be brought online at the appropriate time, minimal factors exist that could send oil prices higher. Even if OPEC maintains production cuts, rising U.S. shale oil output is thought to temper the results of OPEC’s reduction in supply. But there will always be one large downward factor for lower prices: OPEC deciding to flood the market with oil to win back market share at any time. This type of action would send prices on another downward spiral.
It seems equity market investors agree with this new, dampened outlook for oil. As this WSJ article points out, the price of crude is flat for 2017 yet energy stocks are down 4%. Clearly the lack of upside in oil prices, cash flow, value and increased risk has hit investors square in the face.
Mercer Capital has significant experience valuing assets and companies in the energy industry, primarily oil and gas, bio fuels and other minerals. We have assisted many clients with various valuation and cash flow issues regarding royalty interests. Contact Mercer Capital to discuss your needs in confidence and learn more about how we can help you succeed.