WTI Futures and Inventories


Back in August 2017, we discussed the significant and bullish shift in the oil futures market from contango pricing to backwardation. This shift marked the first time backwardation would enter the market since 2014 and oil and gas investors were taking note. This was a bullish sign for many, including producers and oil field services, but a bearish sign for those in crude oil storage. Possible reasons for this include the following.
Crude Oil Exports
The U.S. has never exported more crude oil than right now. Latest data from EIA indicates the export of 1.4 million barrels per day in the month of September; nearly double the August daily export figures. Since the unrefined crude oil export ban was lifted in early 2016, the total average daily export figures have exploded. The average number of barrels exported in 2015 was 465,000 while 2017’s average is 960,000 barrels per day.
The top five nations receiving U.S. crude oil include 1) Canada; 2) China; 3) Korea; 4) United Kingdom; and 5) India. This group represents 65% of total exports in the month of September, with Canada leading the way with 23% of all U.S. exports while China is a close second at 17%.
Interestingly, South Korea has surged its imports of U.S. crude. For reference, the average daily oil exports to Korea between June 2000 and August 2016 was 6,200 barrels per day. In the last 12 months, that number has surged to 50,000 barrels per day (more than 8x the average for the 2000’s).
Crude Oil Exports Takeaway: With the export ban rescinded, crude oil exports are increasing overall and specifically to eastern Asia.
2017 Hurricane Season Impact
As we wrote in our September 25, 2017 post, Hurricane Harvey, which made landfall in Houston, Texas, shut down more than 20% of the oil production from the Gulf of Mexico with additional onshore volumes shut-in. Four terminals in Corpus Christi were closed to tanker traffic. Nearly 50% of the nation’s refining capacity is located along the Gulf Coast and at least 10 refineries were shut down before the storm’s arrival.
In response to the impact of hurricanes during 2017, U.S. refineries have been processing record seasonal volumes of crude to rebuild stocks of gasoline and especially diesel which were depleted by hurricanes and strong consumption at home and in export markets.
As a result, crude stocks along the East, West, and Gulf Coasts have all fallen since the summer and are well below last year’s levels and appear tight.
Hurricane Season Takeaway: Refiners are running hard trying to replenish the stock lost during demand surge and shutdowns caused by the 2017 hurricane season. This results in higher demand for crude oil in the current market. Much of this demand is immediately filled by crude oil in storage.
US Oil Inventories – Weekly Petroleum Status Report, EIA
Crude storage inventories hit their highest level ever in March 2017 with 1.2 trillion barrels of crude oil. Since that time, inventories have declined by 117 million barrels, according to information available from the EIA. Storage levels play a significant role in futures prices. U.S. crude futures, such as West Texas Intermediate (WTI), are based on crude delivered into the tank and pipeline system around Cushing, Oklahoma. Futures prices are, therefore, very sensitive to anything that affects the regional supply-demand balance in the Midwest (PADD 2) as Cushing’s falls under the Midwest reporting region.
Overall, commercial crude oil storage inventory levels across the U.S. are down 8% year-over-year. The largest single storage facility of commercial crude in the U.S. is stored in Cushing, Oklahoma. Cushing’s inventory is down (15%) year-over-year, while the largest PADD area for crude oil storage (the Gulf Coast – PADD 3) was down (12%) year-over-year.
Crude Oil Inventory Takeaway: The inventory levels of crude oil are falling all across the nation in response to higher exports of crude oil, the impact from 2017 hurricane season, and the backwardation trend in WTI future prices which encourages selling rather than storage of crude oil.
Trend in WTI Future Curve
The table shows the future contract spread for the previous 12 months. The most recent data (December 1, 2017) returns the third month in a row of backwardation spreads since 2014.
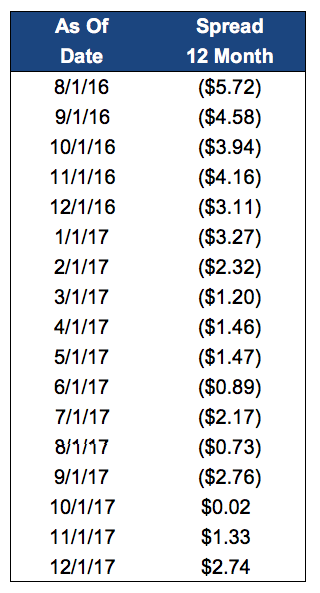
In addition, the trend movement from contango to backwardation can be seen while watching the shrinking spread from August 2016, when the market had a wider contango spread of ($5.72), to backwardation in October 2017 to a significantly wider backwardation spread in December 2017.
Conclusion
The movement in the future spread toward backwardation is positive from an economic supply and demand perspective. Expectations are a backwardation environment will move crude oil prices higher, leading to more exploration and production activity, more active selling to refiners and the broader market, and less demand for storage. While this shift is good news for the overall industry, company specific risk and investors’ fickle growth and risk attitudes create volatile public equity markets.
Mercer Capital has significant experience valuing assets and companies in the oil and gas industry, primarily oil and gas, bio fuels, and other minerals. Our oil and gas valuations have been reviewed and relied on by buyers and sellers and Big 4 auditors. These oil and gas-related valuations have been utilized to support valuations for IRS estate and gift tax, GAAP accounting, and litigation purposes. We have performed oil and gas valuations and associated oil and gas reserves domestically throughout the United States and in foreign countries. Contact a Mercer Capital professional today to discuss your valuation needs in confidence.