Analyzing Public Company Data for Family Business Insights
Talking to the Numbers Introduction


“You have to keep talking to the numbers until the numbers start talking back to you.”
So goes the most memorable piece of advice regarding financial analysis I have ever received. Chris Mercer passed it along to me, and Chris attributes the saying to a mentor of his while working at First Tennessee bank in the 1970s. The admonition to keep talking to the numbers is a key component of our firm’s institutional DNA. It seems to me that the maxim is underwritten by two fundamental premises:
- First, persistence is rewarded in financial analysis. One has to keep talking to the numbers before they yield up their secrets. A surface reading of the financial statements will not necessarily reveal the Company’s underlying financial narrative. Financial statements are best read with a highlighter, pen, and calculator in hand. These are the tools necessary to move beyond simply discovering what the financial statements say to discerning what they mean.
- Second, there is an underlying coherence to the financial statements. With persistent prodding, the numbers will start talking back. The numbers presented in the financial statements are not just random data, but rather cohere with one another in a logical way that sheds light on the real-world activities of the business. In other words, financial analysis is about telling the company’s story, not just calculating ratios and making charts.
Reading financial statements well is all about asking the right questions. In this series of posts, our goal is to help family business directors ask the right questions of their financial statements. Asking better questions leads to better financial and business decisions.
The Data Set We Are Using
In contrast to private companies, which tend to keep their financial information to themselves, public companies are required by law to publish their financial statements on a regular basis. While the purpose of this requirement is to keep investors fairly and fully informed, one beneficial side effect is that these filings create a vast repository of financial statement data. We downloaded the data set for the analysis presented in this series from the Capital IQ database. We pulled data for companies in the S&P 1500 index, which includes large-cap (500), mid-cap (400), and small-cap (600) companies. Financial statement data for financial institutions, insurance companies, and REITs (FIRE for short) looks and feels a lot different than data for operating companies like manufacturers, retailers, and services companies. Since we wanted to focus on the latter, we screened out the former.
Exhibit 1 summarizes the composition of the data set with respect to both industry and size.
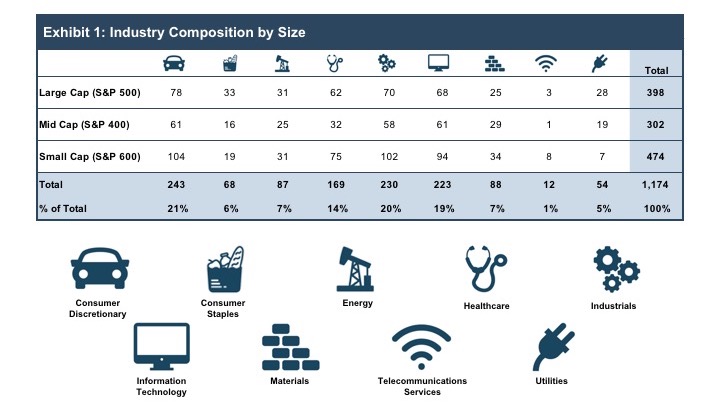
Having dispensed with the FIRE companies, our initial universe shrank by about 20%, from 1,500 to just under 1,200 companies.
Understanding the Data: Illustrative Example
Exhibit 2 provides a preview of the types of metrics that we will analyze and comment upon in the posts to follow.
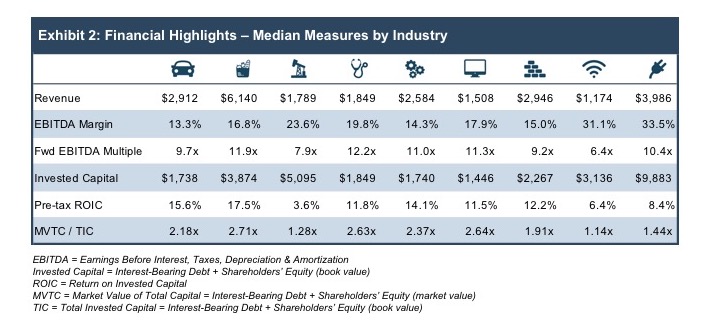
To briefly illustrate what we hope to provide for readers through this series, let’s compare the median measures for healthcare companies and industrials (the fourth and fifth columns from the left). What can we discern from this data that will help family business directors ask better questions when reading financial statements?
Reading financial statements well is all about asking the right questions.
Measuring by EBITDA Margin
As measured by EBITDA margin, the healthcare companies are more profitable, wringing nearly twenty cents of cash flow out of each dollar of revenue, compared to just over fourteen cents for the industrials. Among other things, profit margins reflect the competitive dynamics of an industry. The higher margins for the healthcare companies are consonant with the prior observation regarding the centrality of innovation to modern healthcare companies. Since the industry has a lot of greenfield space to work in, successful companies have greater opportunity to carve out a profitable niche protected from direct competition. As the industry matures and growth slows, one might expect competition to increase and margins to come under pressure.
- How does the profitability of my family business compare to peers?
- Does my family business have a “strategic moat” that can help sustain superior profitability?
Measuring by Forward EBITDA Multiples
The forward EBITDA multiples indicate that investors would rather own a given dollar of EBITDA generated by a healthcare company than an industrial company. Unlike a performance measure like EBITDA margin, valuation multiples incorporate market expectations for a company’s future. As a result, multiples are positively related to expectations for growth and negatively related to the market’s assessment of risk. On balance, the market assigns a higher multiple to healthcare companies than industrials.
- What are the principal risks facing my family business? What options are available for mitigating those risks?
- How would a potential buyer assess the growth prospects of my family business? Which segments or business lines are poised for the greatest growth?
Better questions lead to better insights, which lead to better decisions.
Profitability vs. Efficiency
While the healthcare companies are more profitable per dollar of revenue, the industrials are more efficient at generating revenue per dollar of capital invested in the business. This may reflect a number of factors, among which is likely the nature of the respective asset bases. Industrial companies have a significant portion of their invested capital tied up in tangible, brick-and-mortar assets like property, plant & equipment, while healthcare companies are more likely to use intangible assets (intellectual property and assembled workforces) to generate revenue. In terms of return on invested capital, the industrials’ lower margin / higher turnover model actually wins out, generating pre-tax debt-free earnings equal to 14.1% of invested capital compared to 11.8% for the healthcare companies.
- How does my family business allocate capital to different segments or divisions?
- Do the managers of my family business have a clear mandate regarding shareholder objectives? Or, are performance expectations for managers ambiguous?
Topics for Analysis
In future posts, we will focus on individual elements of financial statement analysis, including:
- Revenue and Earnings Performance
- Balance Sheet Composition
- Return on Invested Capital
- Cash Flow :: Sources & Uses
- Financial Leverage
- Market Returns, Multiples & Risk
Throughout, we will focus on learning to ask better questions of your family business’s financial statements. Better questions lead to better insights, which lead to better decisions.