Continuation of Market Rebound Drives Most Categories of Publicly Traded RIAs Higher in Q3
RIA Market Update


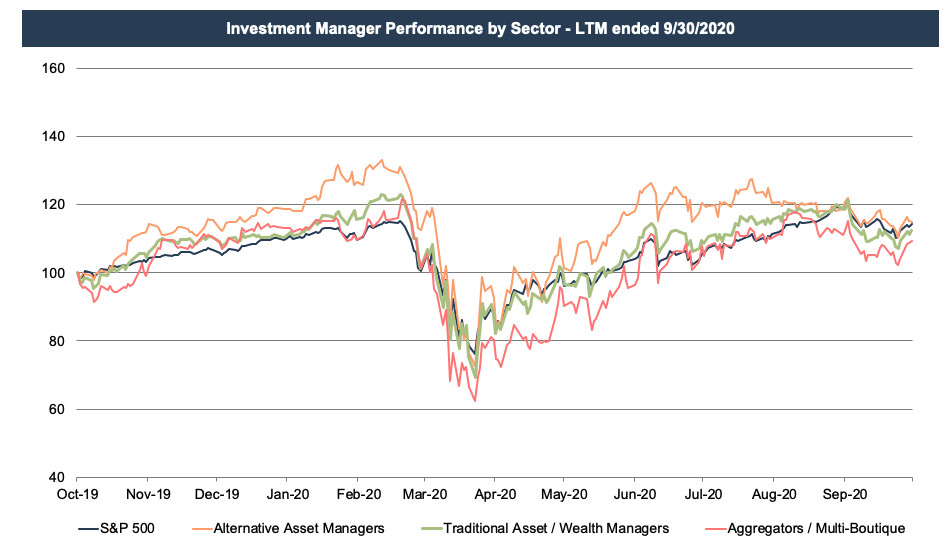
Share prices for publicly traded asset and wealth managers have trended upward during the second and third quarters after collapsing in mid-March with the broader market. Alt asset managers have fared well over the last year as volatility and depressed asset prices have created an opportunity to deploy dry power and raise new funds in certain asset classes. Traditional asset and wealth managers have generally moved in line with the broader equity market, while leveraged RIA aggregators have seen more volatility, both up and down, as the market bottomed in March before trending upward.
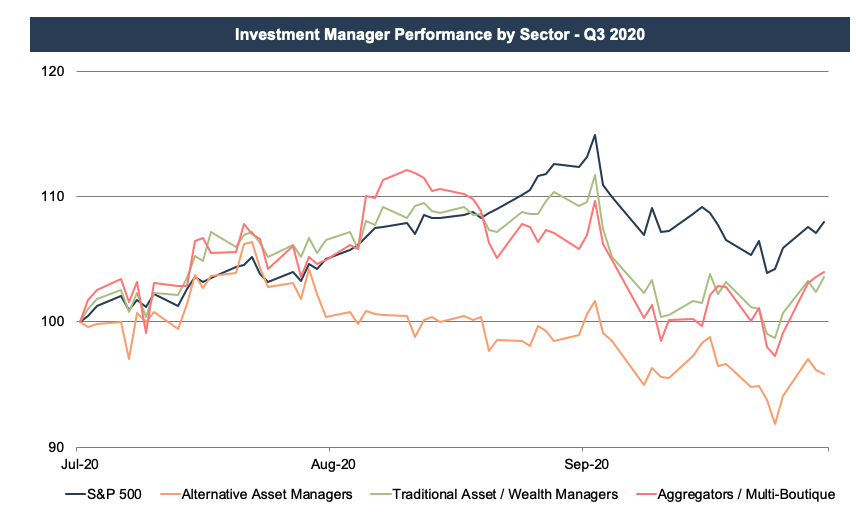
Looking at the third quarter, traditional asset and wealth managers and aggregators trended upwards in July and August before pulling back as the market dipped in September. While the quarter was volatile, both of these categories ended the quarter up about 4%. The primary driver behind the increase was the increase in the market itself as most of these businesses are primarily invested in equities, and the S&P 500 gained about 8% over the quarter.
The upward trend in publicly traded asset and wealth manager share prices since March is promising for the industry, but it should be evaluated in the proper context. Pre-COVID, the industry was already facing numerous headwinds including fee pressure, asset outflows, and the rising popularity of passive investment products. While the 11-year bull market run largely masked these issues, asset outflows and revenue pressure can be exacerbated in times of market pullbacks and volatility.
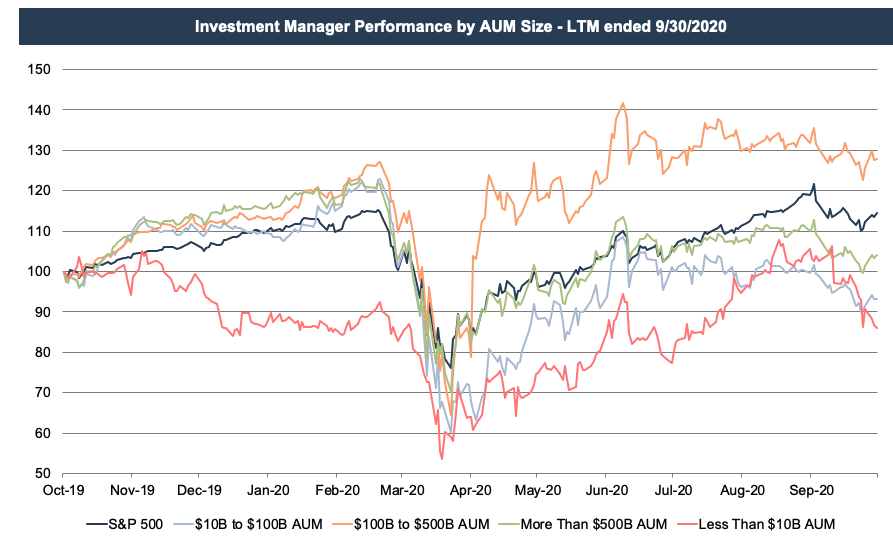
Smaller publicly traded asset/wealth managers have been most affected by these trends, which is reflected in their share price performance over the last year. As shown below, asset/wealth managers with more than $100 billion AUM have performed well over the last year, with the $100 – $500 billion AUM group up 28% and the $500 billion+ group up 4%. Smaller RIAs, those with under $100 billion AUM, have been down over the last year, with the smallest group (under $10 billion AUM) down 14%.
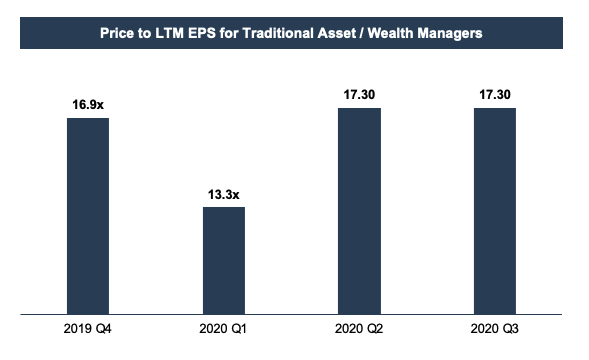
As valuation analysts, we’re often interested in how earnings multiples have evolved over time since these multiples reflect market sentiment for the asset class. LTM earnings multiples for publicly traded asset and wealth management firms declined significantly during the first quarter—reflecting the anticipation of lower earnings due to large decreases in AUM—but have since recovered in the second and third quarters as prospects for earnings growth have improved.
Implications for Your RIA
During such volatile market conditions, the value of your RIA is sensitive to the valuation date or date of measurement. In all likelihood, the value declined with the market in the first quarter before recovering most of that loss in the second and third. We’ve been doing a lot of valuation updates amidst this volatility, and there are several factors we observe in determining an appropriate amount of appreciation or impairment.
One is the overall market for RIA stocks, which was down significantly in the first quarter but has since recovered to above where it was a year ago (see chart above). The P/E multiple is another reference point, which has followed a similar path. We apply this multiple to a subject RIA’s earnings, so we also have to assess how much that company’s annual AUM, revenue, and cash flow have increased or diminished since the last valuation while being careful not to count good or bad news twice.
While the market for publicly traded companies is one data point that informs private RIA valuations, that’s not to say that privately held RIAs have followed the same trajectory as their smaller public counterparts. Many of the smaller publics are focused on active asset management, which has been particularly vulnerable to the headwinds discussed above. Many smaller, privately-held RIAs, particularly those focused on wealth management for HNW and UHNW individuals, have been more insulated from industry headwinds, and the fee structures, asset flows, and deal activity for these companies have reflected this.
We also evaluate how our subject company is performing relative to the industry as a whole. Fixed income managers, for instance, held up reasonably well compared to their equity counterparts in the first quarter. We also look at how much of a subject company’s change in AUM is due to market conditions versus new business development net of lost accounts. Investment performance and the pipeline for new customers are also key differentiators that we keep a close eye on.
Improving Outlook
The outlook for RIAs depends on a number of factors. Investor demand for a particular manager’s asset class, fee pressure, rising costs, and regulatory overhang can all impact RIA valuations to varying extents. The one commonality, though, is that RIAs are all impacted by the market.
The impact of market movements varies by sector, however. Alternative asset managers tend to be more idiosyncratic but are still influenced by investor sentiment regarding their hard-to-value assets. Wealth manager valuations are tied to the demand from consolidators while traditional asset managers are more vulnerable to trends in asset flows and fee pressure. Aggregators and multi-boutiques are in the business of buying RIAs, and their success depends on their ability to string together deals at attractive valuations with cheap financing.
On balance, the outlook for RIAs has generally improved with market conditions over the last several months. AUM has risen with the market over this time, and it’s likely that industry-wide revenue and earnings have as well. The third quarter was generally a good one for RIAs, but who knows where the last quarter of 2020 will take us in a wild year for RIA valuations and overall market conditions.