What is Normal Compensation at an Asset Management Firm?
Part 2


Legend has it that, sometime in the early 1960s, Italian tractor manufacturer Ferruccio Lamborghini burst into Enzo Ferrari’s office to complain about the Ferrari road car that Lamborghini had recently purchased. He didn’t like the design, thought the manufacture was crude, and was furious that the car was incredibly unreliable. Enzo Ferrari, who had always thought people who bought his overpriced road cars (which Ferrari sold only to fund the company’s racing ambitions) were dupes, told Lamborghini that if he could do better, he should. In 1963, Lamborghini founded a sports car manufacturing company, and Ferrari’s had a competitor ever since.
It took a few years for Lambo to gain a footing in the industry, but in 1966 the company introduced the Miura, a two seat sports coupe with a powerful V-12 engine mounted, in a revolutionary fashion for the time, between the passenger compartment and the rear wheels. It competed directly against Ferrari’s more conservative, twelve cylinder GT, the Daytona, and established Lamborghini’s personality as a manufacturer of innovative (and sometimes over the top) sports cars. The Daytona still outsold the Miura two to one, but today at auction a Miura will fetch three times what a similar vintage Daytona will. The more traditional design of the Ferrari appealed to buyers when the cars were new, but in retrospect, Lamborghini’s willingness to experiment is highly regarded.
One of the primary differences we observe in investment management firms is not engine placement, of course, but compensation programs. The Miura and Daytona were different approaches to the same product. Our experience is that there are multiple ways to handle staff compensation at investment management firms, and the manner in which compensation is handled often says a lot about the business model and culture of the firm.
The “Market” for Investment Management Talent
Our experience tells us that the labor market for talent in the investment management community is not terribly efficient – at least not on a position to position, person to person basis. We have seen wide disparities in the compensation program for similar positions, which cannot be explained away by the cost of living in a given market, the size of the asset management firm, or the relative level of profitability.
Mercer Capital’s Memphis office is housed in a 34 story high-rise. I’ve often wondered what I would learn by going floor to floor, office to office, in our building and asking what the receptionist in each office is paid. The data would be statistically significant at one level – there are probably 100 people employed as a “receptionist” in our building, all working for services firms and in the same zip code. If I were to do that, how large of a variation in compensation would you expect me to find? Is it possible that the highest paid receptionist in the building would make over twice that of the lowest paid receptionist? And what might account for those differences? Tenure? Size of firm? Profitability of firm? Actual nature of administrative responsibilities? Now imagine that you are, instead, trying to compare senior portfolio manager positions at long/short hedge funds in Kansas City and San Francisco: lining up salary, bonus compensation, performance-based compensation, equity compensation, etc.
Our observation is that compensation at RIAs tends to be idiosyncratic, but by this we don’t mean to imply that it is idiotic. Simply put, compensation programs tend to evolve, purposefully, in asset management firms over time and over time take on a life of their own. Inevitably, compensation programs tend to be intertwined with business model and ownership. Internally, they make sense. Externally, they may be hard to compare with the “market.” When we are called in to provide a valuation, we have to make some rational sense of the compensation program to come up with a normalized margin that we can use to value the firm.
Compensation Expert Analyses
At Mercer Capital, we don’t hold ourselves out as compensation experts. But we do encounter a number of compensation experts and their work tends to follow a familiar pattern. Usually, the expert will evaluate the requirements and responsibilities of a given job at an investment management firm, and will use some form of statistical regression analysis to compare a market rate of compensation for that position with published pay data for similar positions at other firms.
Not to debate the merits of statistical analysis, but this methodology has some obvious drawbacks. Comparability is hard to establish. No two person’s qualifications are the same, nor are any two positions’ requirements and responsibilities. Does the scale of the firm as measured by AUM matter more to the level of compensation for a CEO, for example, or is it more to be governed by the level of profitability? How are salary, bonus, and equity compensation to be compared – and are each worth the same on a dollar for dollar basis? Is participation in carried interest a factor? If so, finding suitably comparable market data is challenging.
Public Company Trends
What we can know with some degree of precision is what publicly traded asset management firms spend on staff. This doesn’t answer the question of what a particular position with a particular firm in a particular market would and should pay, but it does give reasonable guidance as to what the compensation/margin tradeoff is for public companies, and in turn gives some idea of what it should be for private companies.
Look, for example, at the interaction between compensation and margin at twenty large publicly traded investment management firms. From the trough of the credit crisis through the bull market in 2014, total annual revenues of these twenty firms almost doubled from $25.3 billion to $44.0 billion. If we break down expenses into compensation related costs and non-compensation related costs, we see that operating leverage is more pronounced with non-compensation related expense. Because some compensation related costs get buried in SG&A as distribution expenses or other outsourced services, it’s likely the case that compensation tracks revenue more closely than this high-level analysis suggests.
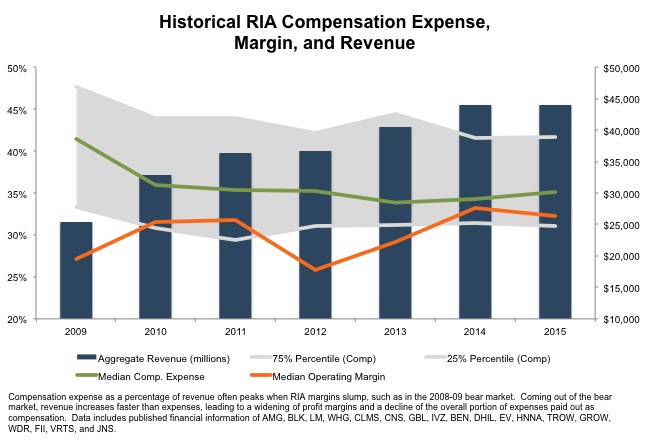
Nevertheless, the big story from this is operating margin. As revenues increase, margin does as well – even at the scale of these public companies. We see this to be the case, regularly, in the private company RIA space, but it’s interesting to see confirmation in the public space, where scale is such that one might expect margin expansion to be more muted.
Summary
Investment management is a talent business, and that talent commands a substantial portion of firm revenue which often exceeds the allocation to equity holders. While there is no perfect answer as to what an individual or group of individuals should be compensated in an RIA, we can look to market data and compensation analysis, measured against the particular characteristics of a given investment management firm’s business model, to make reasonable assumptions about what compensation is appropriate and, by extension, what level of profitability can be expected.