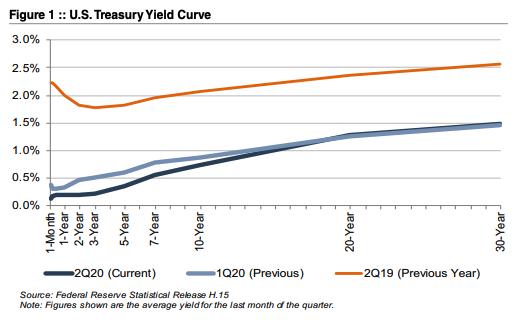
In our last update regarding core deposit trends published in October 2019, we described a decreasing trend in core deposit intangible asset values in light of falling interest rates. As a result, the interest-rate environment was not positive for core deposit valuations before COVID. Less than six months later, the World Health Organization declared the coronavirus outbreak a pandemic, and the world changed drastically. In response, the Fed cut rates to effectively zero, and the yield on the benchmark 10-year Treasury reached a record low. While many factors are pertinent to analyzing a deposit base, a significant driver of value is market interest rates. In a world of cut-rate alternative wholesale funding, core deposits have lost some of their luster.
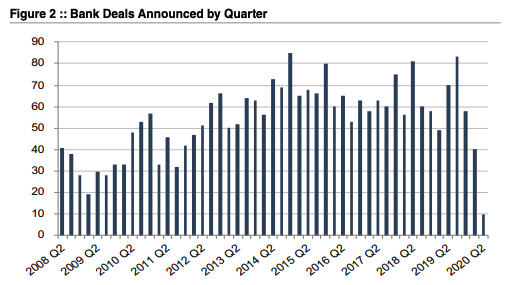
As shown in Figure 2, only ten whole-bank transactions were announced in the second quarter of 2020, representing the fewest deals announced during a quarter over the time period analyzed. For comparison, the first quarter of 2009 posted the second lowest figure with 19 announced deals. It seems unlikely that deal activity will fully recover in the near future. There are several issues hindering deal activity:
On the other hand, there are a couple of factors that might cause some banks to resume M&A discussions more quickly.
Using data compiled by S&P Global Market Intelligence, we analyzed trends in core deposit intangible (CDI) assets recorded in whole bank acquisitions completed from 2000 through June 30, 2020. CDI values represent the value of the depository customer relationships obtained in a bank acquisition. CDI values are driven by many factors, including the “stickiness” of a customer base, the types of deposit
accounts assumed, and the cost of the acquired deposit base compared to alternative sources of funding. For our analysis of industry trends in CDI values, we relied on S&P Global Market Intelligence’s definition of core deposits.1 In analyzing core deposit intangible assets for individual acquisitions, however, a more detailed analysis of the deposit base would consider the relative stability of various account types. In general, CDI assets derive most of their value from lower-cost demand deposit accounts, while often significantly less (if not zero) value is ascribed to more rate-sensitive time deposits and public funds, or to non-retail funding sources such as listing service or brokered deposits which are excluded from core deposits when determining the value of a CDI.
Figure 3 summarizes the trend in CDI values since the start of the 2008 recession, compared with rates on 5-year FHLB advances. Over the post-recession period, CDI values have largely followed the general trend in interest rates—as alternative funding became more costly in 2017 and 2018, CDI values generally ticked up as well, relative to post-recession average levels. Throughout 2019, CDI values exhibited a declining trend in light of yield curve inversion and Fed cuts to the target federal funds rate during the back half of 2019. This trend was exacerbated in March 2020 when rates were effectively cut to zero.
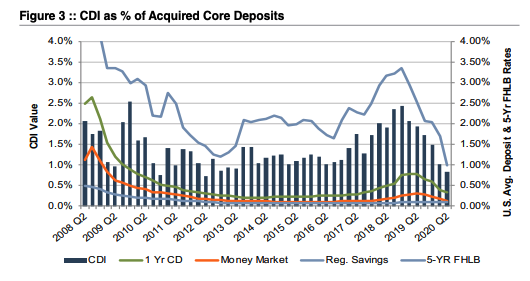
The average CDI value declined 110 basis points from June 2019 to June 2020 while the five-year FHLB advance declined 157 basis points over the same period. The decline in CDI values has been somewhat slower than the drop in benchmark interest rates, in part, because deposit costs typically lag broader movements in market interest rates. For example, the average money market deposit rate and the average one-year CD rate declined 14 basis points and 43 basis points, respectively, over the same one-year period. In general, banks were slow to raise deposit rates in the period of contractionary monetary policy through 2018 and, as a result, rates remain below benchmark levels leaving banks less room to reduce rates further. For CDs, the lagging trend is even more pronounced. Now that rates are on the decline, banks have been stuck with CDs that cannot be repriced until their maturities even as benchmark rates fall. While time deposits typically are not considered “core deposits” in an acquisition and thus would not directly influence CDI values, they do significantly influence a bank’s overall cost of funds.
Average CDI values have fallen for the past six consecutive quarters. Since early 2008 CDI values have averaged 1.45% of deposits, meaningfully lower than long-term historical levels which averaged closer to 2.5-3.0% in the early 2000s.
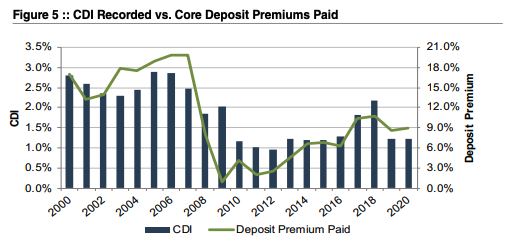
Core deposit intangible assets are related to, but not identical to, deposit premiums paid in acquisitions. While CDI assets are an intangible asset recorded in acquisitions to capture the value of the customer relationships the deposits represent, deposit premiums paid are a function of the purchase price of an acquisition. Deposit premiums in whole bank acquisitions are computed based on the excess of the purchase price over the target’s tangible book value, as a percentage of the core deposit base. While deposit premiums often capture the value to the acquirer assuming the established funding source of the core deposit base (that is, the value of the deposit franchise), the purchase price also reflects factors unrelated to the deposit base, such as the quality of the acquired loan portfolio, unique synergy opportunities anticipated by the acquirer, etc. Additional factors may influence the purchase price to an extent that the calculated deposit premium doesn’t necessarily bear a strong relationship to the value of the core deposit base to the acquirer. This influence is often less relevant in branch transactions where the deposit base is the primary driver of the transaction and the relationship between the purchase price and the deposit base is more direct. Figure 4 presents deposit premiums paid in whole bank acquisitions as compared to premiums paid in branch transactions.
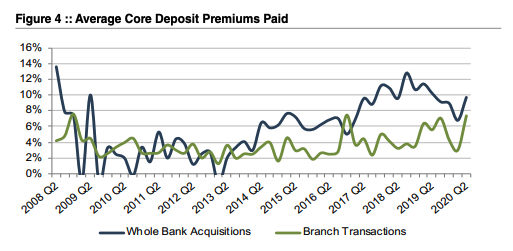
As shown in Figure 5, deposit premiums paid in whole bank acquisitions have shown more volatility than CDI values. Despite improved deal values prior to the second half of 2019, deposit premiums in the range of 7% to 10% remain well below the pre-Great Recession levels when premiums for whole bank acquisitions averaged closer to 20%.
Deposit premiums paid in branch transactions have generally been less volatile than tangible book value premiums paid in whole bank acquisitions. Branch transaction deposit premiums averaged in the 4.5%-7.5% range during 2019, up from the 2.0-4.0% range observed in the financial crisis. Only five branch transactions were completed in the first half of 2020, but the range of their implied premiums is in line with 2019 levels. There have been several branch transactions announced since the onset of the pandemic; however, pricing information is not available for any of those transactions.
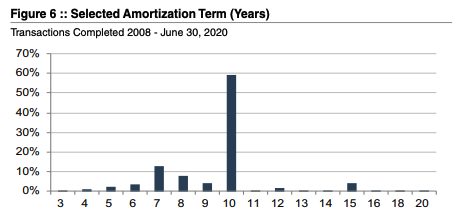
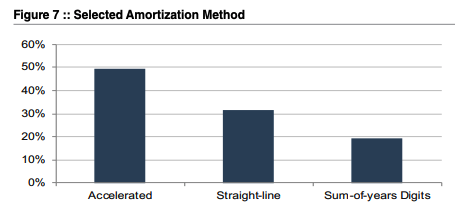
Based on the data for acquisitions for which core deposit intangible detail was reported, a majority of banks selected a ten-year amortization term for the CDI values booked. Less than 10% of transactions for which data was available selected amortization terms longer than ten years. Amortization methods were somewhat more varied, but an accelerated amortization method was selected in approximately half of these transactions.
For more information about Mercer Capital’s core deposit valuation services, please contact us.
Originally appeared in Mercer Capital’s Bank Watch, August 2020.