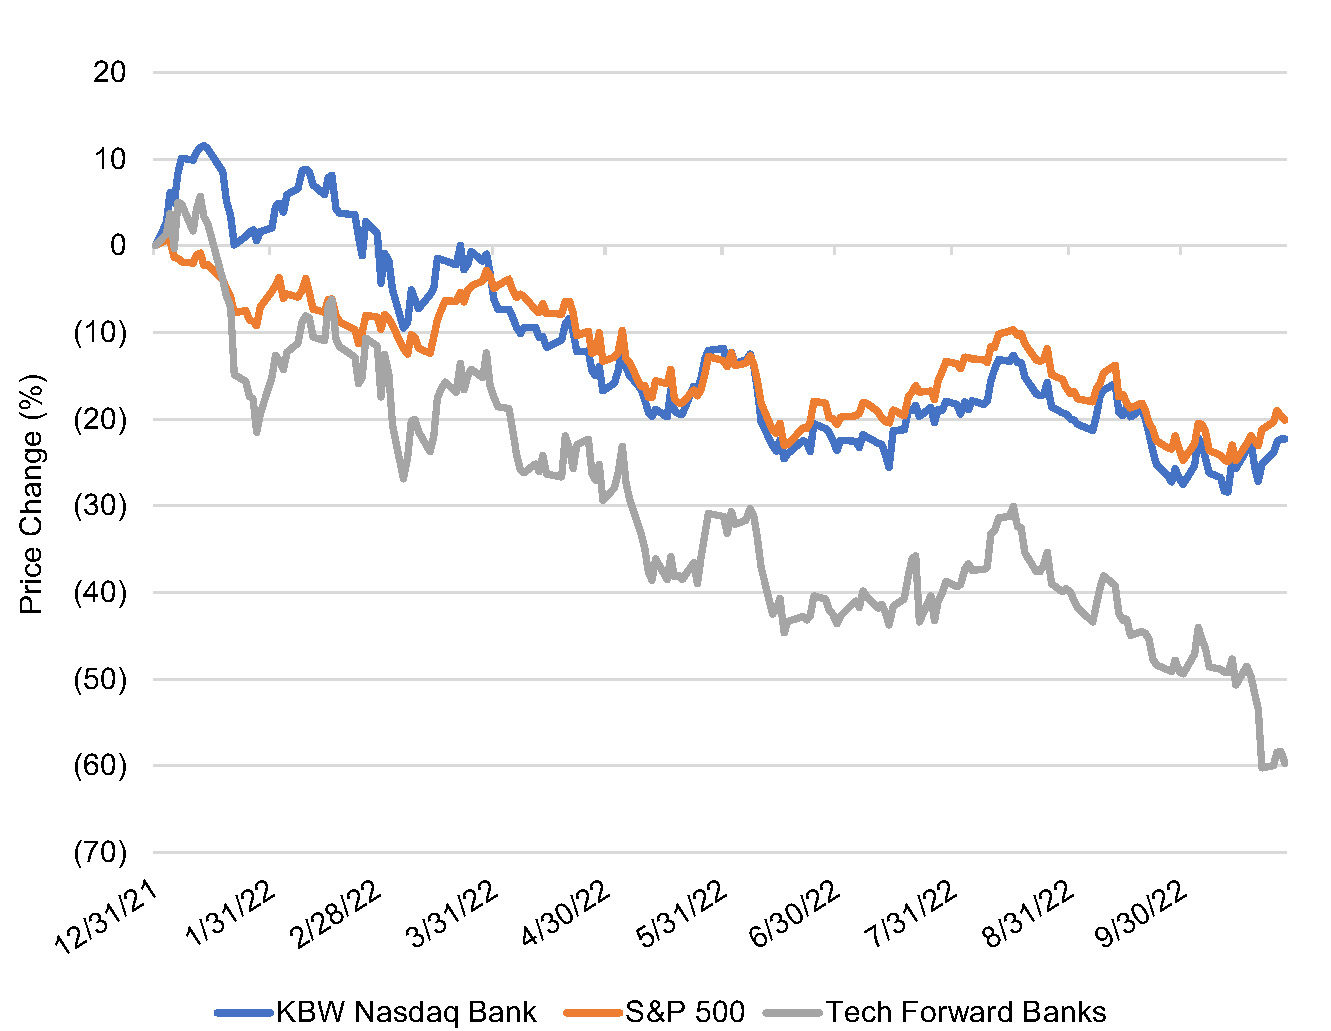
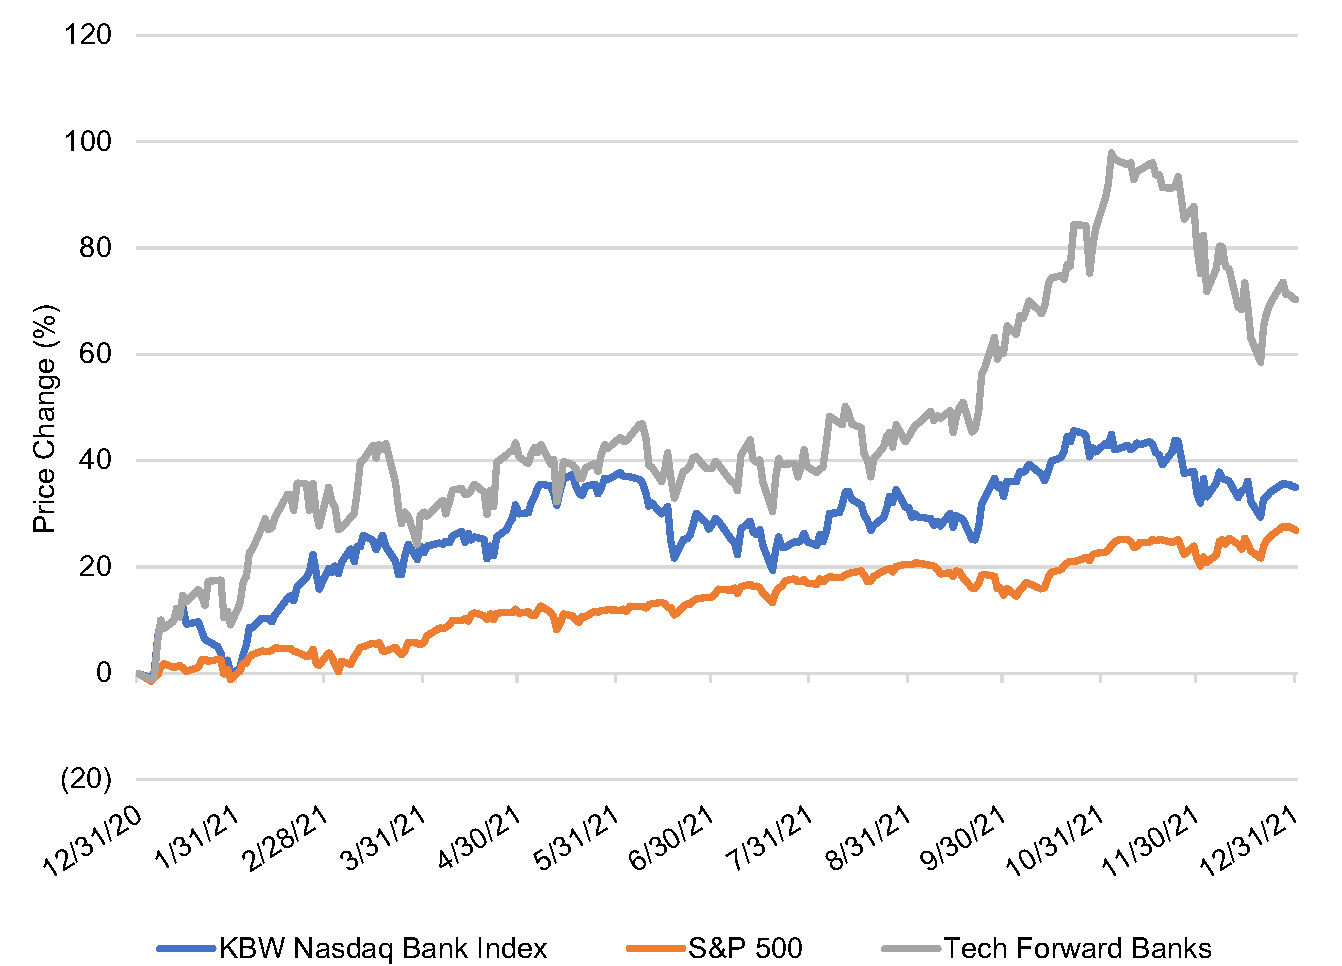
In the year-to-date period, the KBW Nasdaq Bank Index has declined 22%, compared to a decline of 20% in the S&P 500 through October 27. Tech-forward banks have underperformed the broader banking sector, down 60% in the year-to-date period.1 This is a reversal of the trend in 2021 when tech-forward banks outperformed the broader banking sector, logging a 70% increase compared to an increase of 35% in the KBW Nasdaq Bank Index.
 Source: S&P Capital IQ Pro.
The tech-forward bank landscape encompasses a variety of business models but generally refers to banks utilizing technology or partnering with fintechs to deliver financial products or services. Banks that partner with fintechs are often referred to as providing “banking as a service (BaaS)”. This model involves an FDIC member bank offering bank products to fintech customers, for example, credit and debit cards or personal loans. The bank holds the deposits associated with the accounts and earns a fee based on a percentage of interchange income specified in an agreement negotiated with the fintech partner. Other models are focused on facilitating payments or providing financial services to a specific niche, such as cryptocurrency.
While the largest banks have the resources to be at the forefront of technology adoption, many smaller banks have partnered with fintechs in recent years. This is due in part to the Durbin Amendment which places limits on interchange income for banks above $10 billion in assets. In many cases, the partnerships have accelerated growth and created new income streams for the bank partners.
However, bank partners also face unique risks. As displayed in the market performance, tech-forward banks have been more volatile than traditional banks. Tech-forward bank performance has been moored, to some degree, to more volatile technology stocks, which explains the stock market outperformance in 2021 followed by a larger retrenchment in 2022. For a community bank pursuing a fintech partnership strategy, there are multiple considerations, including the following.
Many fintech partner banks have continued growing deposits this year even though most banks have seen deposit growth stagnate or turn negative in the rising rate environment. An analysis performed by S&P Global Market Intelligence showed that fintech partner banks with assets between $1 billion and $3 billion experienced deposit growth of 15% (annualized) in the first half of 2022. This compares to deposit growth of 3% for commercial banks in the same asset size range.
The deposits generated from fintech partnerships are often noninterest bearing accounts, which are especially valuable in the current rising rate environment. Bank partners earn spread income from the deposits, often holding them at the Federal Reserve due to their volatility and uncertain duration. Balances at the Fed reprice immediately with changes to the Fed’s benchmark rate.
The largest impact on the revenue side typically shows up in noninterest income. Fintech partner banks tend to have a higher ratio of noninterest income to total income relative to traditional banks as they earn a share of the interchange income. In a period of flat or declining interest rates, this diversification of revenue can help to offset net interest margin compression.
For the tech-forward banks included in Figure 1 and 2, the median ratio of noninterest income to operating revenue was 29% in the trailing twelve
month period.
While fintech partnerships can be a source of growth, bank partners should be cautious about revenue or deposit concentrations. Fintechs can grow rapidly, and, as a result, a bank partner may develop a concentration within their deposit base or revenues. Banks must periodically renegotiate contracts with fintech partners, and there is a risk that the fintech will find another bank partner or demand more favorable terms. This single event could eliminate a major source of deposits or reduce noninterest income, causing a much greater impact than the ordinary loss of traditional bank customers.
For example, Green Dot Corporation (GDOT) provides the Walmart MoneyCard product and offers other deposit account products at Walmart. Green Dot’s second quarter 10-Q discloses that approximately 21% of its operating revenue in the year-to-date period was derived from products and services sold at Walmart locations.
Regulators have stepped up their scrutiny of bank-fintech partnerships this year, focusing on risk management controls. Many banks partnering with fintechs have less than $10 billion in assets, and banks that do not currently serve fintechs may not have the necessary compliance infrastructure to effectively manage potential fintech relationships. Compliance capability must be built over a long period of time and serves as somewhat of a barrier to entry for banks desiring to pursue this strategy.
Additionally, certain fintech partnerships may present an added element of risk as the bank could be impacted by the regulatory and compliance practices of the fintechs or the evolving regulatory/compliance landscape. One recent example of this risk arose in the crypto fintech niche as the FDIC released an order to a crypto brokerage firm demanding that it cease and desist from making false and misleading statements about its deposit insurance status, while the FDIC contemporaneously issued an advisory to insured institutions regarding FDIC deposit insurance and dealings with crypto companies.2
Bank stocks’ underperformance in 2022 has largely been attributed to economic uncertainty and the potential for recession brought on by the Fed’s aggressive rate hikes. Fintech partner banks have been more volatile than the broader banking market. The business models entail certain risks, as detailed above, that do not pertain to traditional banks to the same degree. In addition, the earnings from fintech partnerships are less predictable and potentially further out in the future.
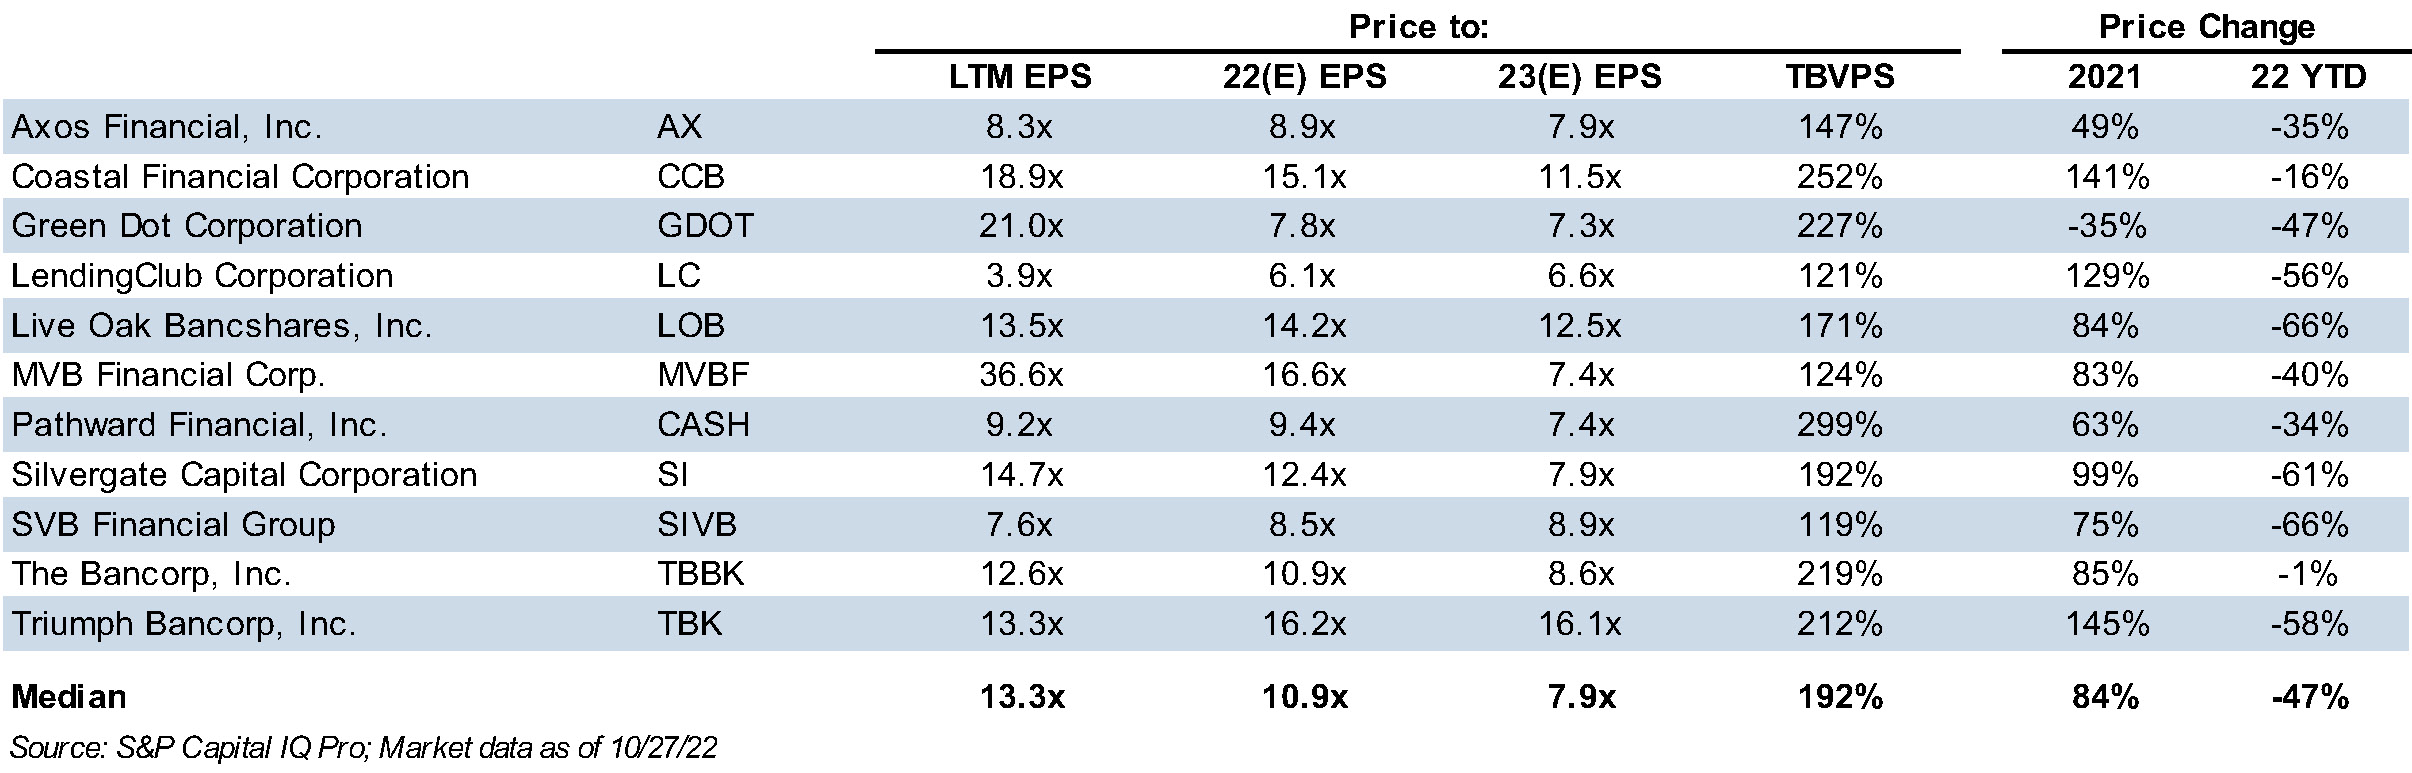
As seen in figure 3, the range of valuation multiples observed for tech forward banks is wide, with forward P/Es ranging from 6.6x to 16.1x but most trade at 7x to 9x estimated 2023 earnings. It is important to note that the banks included in the table above represent a variety of sizes, strategies and niches, so comparability may be somewhat limited. Tangible book multiples likewise exhibit a wide range, but in general are high relative to the broader banking sector. In valuing fintech partner banks, investors weigh the growth potential provided by the partnership versus the risk that earnings growth does not materialize.
Click here to expand the image above
Mercer Capital has experience valuing and advising both banks and fintechs. If you are considering partnership opportunities or have questions regarding their valuation implications, please contact us.