Travis W. Harms is a member of the Appraisal Foundation’s Working Group on control premiums, which recently released an exposure draft, The Measurement and Application of Market Participant Acquisition Premiums. The following analyses and opinions are those of Harms, and do not necessarily reflect the views of the other members of the Working Group.
The consistent theme of the Appraisal Foundation’s exposure draft The Measurement and Application of Market Participant Acquisition Premiums is that acquirers do not value control for its own sake, but rather for the tangible economic benefits that can be achieved by the exercise of control. In other words, control of a business enterprise is valuable only to the extent that at least one of two conditions prevail: (1) the control buyer anticipates that the business will generate incremental cash flows under their stewardship, and (2) the control buyer has access to less expensive capital than the current owners.
A logical extension of this theme is that market participant acquisition premiums (or, control premiums, as they have traditionally been known) are more properly conceived of as outputs of a valuation process focused on cash flow, risk and growth than as inputs used to derive a valuation indication for a controlling interest. As a result, averages or medians of published studies of observed control premium data do not constitute direct valuation evidence. This caution should not be interpreted as belittling the usefulness of such data. Adopting an incremental economic benefits approach to measuring the fair value of controlling interests does not mean that practitioners should drop their subscriptions to Mergerstat Review. It does, however, mean that practitioners should consider using the Mergerstat Review differently, as suggested in the exposure draft:
The Working Group cautions that exclusive reliance on observed transaction premium data provides, in most case, insufficient support for a concluded MPAP. Nonetheless, observed transaction premium data may be valuable. The Working Group believes that observed historical premiums provide potentially relevant (albeit indirect) evidence of the appropriate magnitude of the incremental economic benefits anticipated by market participants. The observed premiums can be used to corroborate (or question) the reasonableness of the cash flow forecasts and discount rates underlying fair value measurements within the income approach. However, exclusive reliance on observed transaction premiums without careful analysis of the subject entity’s relative financial performance, valuation multiples, and other metrics can result in an unreliable fair value measurement.1
In this post, we will illustrate how observed transaction premiums from the most recent edition of Mergerstat Review can be useful in measuring the fair value of controlling interests.
How do you currently use the Mergerstat Review data?
— MercerFairValue (@MercerFairValue) August 1, 2016
Summary of the Data
The 2016 edition of Mergerstat Review identifies 405 acquisitions of publicly held sellers announced in 2015. The transactions involved companies in 41 different industries. For the 362 transactions with non-negative observed premiums, the average and median premiums were 48.1% and 29.6%, respectively. In the decade ending with 2015, median premiums by year ranged from a low of 23.1% in 2006 to 39.8% in 2009.
The dispersion of actual observations during the year was pronounced, with over 30% of transactions having observed premiums of less than 20%, while observed premiums exceeded 60% in nearly 20% of the transactions.
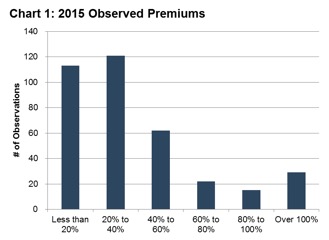
Given the dispersion evident in Chart 1, it should be evident that the median or average observation is of little direct relevance to a specific fair value measurement. Additional analysis is required to draw meaningful conclusions from the data.
The first step is to narrow the scope of analysis to the relevant industry. For the purpose of this post, we will examine the data for the retail industry. Mergerstat Review identifies 10 transactions in the retail industry during 2015 involving public sellers. Excluding one foreign transaction and one transaction that was cancelled prior to closing, we analyzed the remaining eight transactions.
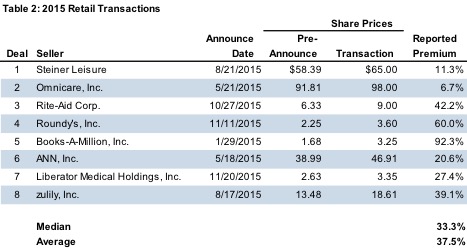
The median and average discounts for the group are generally comparable to the aggregate measures reviewed previously. As with the overall data set, the dispersion of observed premiums for the retail transactions is quite wide, ranging from 6.7% to 92.3%.
One of the most practical best practices recommended in the Exposure Draft is that premiums be expressed using invested capital or enterprise value as the denominator, rather than equity. This recommendation reflects the emphasis on enterprise-level cash flow, risk, and growth as the principal factors influencing the magnitude of an observed transaction premium. For traditional data sources such as Mergerstat Review, this necessitates conversion of the equity premiums to an enterprise basis.
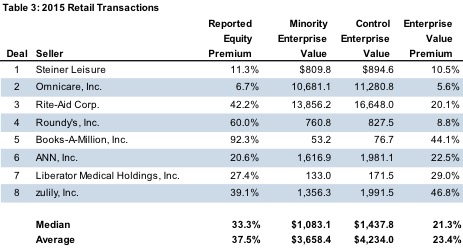
Since the control premium is actually a dollar amount (the difference between minority and control values), using a larger denominator (enterprise value) deflates the percentage premiums relative to the traditional equity basis percentages.2 The median and average premiums on an enterprise value basis are 21.3% and 23.4%, respectively, and the range of observed premiums has contracted appreciably (5.6% to 46.8%).
The analyst’s task at this point is to consider whether further insights can be extracted from the data. As we will demonstrate in the remaining sections of this report, the transactions in Table 3 illustrate five common variations on the incremental economic benefits theme.
Variation #1: Industry Consolidation
The most common motivating factor for control buyers in our sample is consolidation. By acquiring a company in the same industry, the control buyer anticipates some degree of cost savings, such that the cash flows from the acquired business following the transaction will be greater than the cash flows expected by the pre-transaction minority shareholders.3
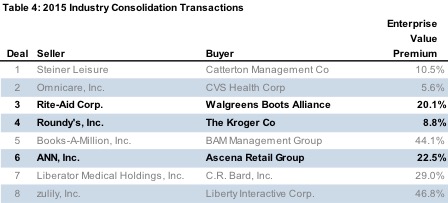
In each case, the buyer is considerably larger than the seller, and was trading at a higher multiple of EBITDA than the seller prior to the transaction.
The Kroger acquisition of Roundy’s illustrates many of the concepts relevant to industry consolidation transactions. At the transaction date, Roundy’s operated 150 grocery stores in Wisconsin and Illinois. Kroger operates over 2,750 grocery stores in 35 states. Table 5 summarizes pertinent comparative data for Kroger and Roundy’s at the transaction date.
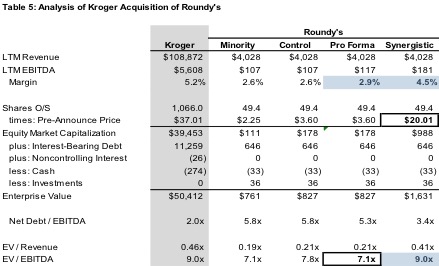
Prior to the transaction, Kroger reported an EBITDA margin of 5.2% and was trading at an EBITDA multiple of 9.0x, compared to an EBITDA margin and multiple of 2.6% and 7.1x, respectively, for Roundy’s. In addition, Roundy’s had significant financial leverage. As a result, what appears to be a large control premium as reported in Mergerstat (60.0%) is only 9.2% on an enterprise value basis. The transaction price implies an enterprise value of 7.8x EBITDA.
The difference in EBITDA margin suggests that Kroger may anticipate implementing cost saving measures that will improve Roundy’s margins on a pro forma basis. Assuming that the transaction multiple of pro forma EBITDA is equal to the pre-transaction seller multiple, the transaction price implies a pro forma EBITDA margin for Roundy’s of 2.9%, or approximately 30 basis points higher than the historical margin, and still well below Kroger’s consolidated margin.
One can also speculate as to the synergistic value of Roundy’s to Kroger by applying Kroger’s own EBITDA multiple to a measure of pro forma EBITDA that is closer to Kroger’s margin, as shown in the rightmost column in Table 5. This synergistic value is not equal to fair value, but does illustrate the potential value range over which market participants would negotiate in arriving at a transaction price. The point over that range at which the transaction price settles will reflect the relative negotiating positions of the two parties. In this case, Kroger’s larger scale and superior margins, combined with Roundy’s precarious financial condition suggested that Kroger had the upper hand in negotiations and therefore retained the majority of the incremental value created by the transaction. Given the potential value range of $761 million (marketable minority) to $1.63 billion (synergistic value), the transaction price of $827 million apportions most of the incremental benefits to the buyer. Nonetheless, given the significant financial leverage, the premium to Roundy’s common shareholders from the transaction was substantial.
As shown in Table 6, similar analysis can be applied to the Rite Aid and ANN transactions.
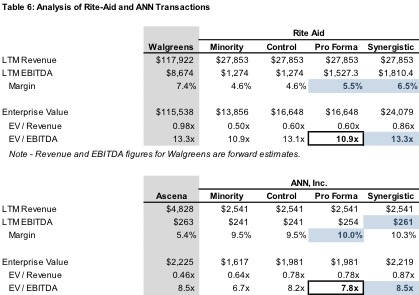
The Rite-Aid narrative is quite similar to the Roundy’s/Kroger transaction. Walgreens (the buyer) was larger, had a more attractive EBITDA margin, and was awarded a higher valuation multiple than Rite-Aid (the seller), which was also in a weaker financial position (net debt at 5.8x EBITDA). However, Rite-Aid did enjoy a better relative negotiating position than Roundy’s, given its greater scale. Although smaller than Walgreen’s, there are few potential targets that would be as material to Walgreens. As a result, Rite-Aid was able to extract a greater portion of the potential value range than Roundy’s.4
The acquisition of ANN, Inc. by Ascena Retail Group, Inc. differs in a couple respects from the other two transactions. First, the buyer (Ascena Retail Group), while larger, is comparable in size to ANN. Second, ANN’s EBITDA margins compare favorably to those of the buyer, suggesting that there is less low-hanging fruit available for margin enhancement.5 As a result, the spread between the minority and synergistic control values is likely narrower, and the seller was in a relatively strong negotiating position, thereby capturing a greater proportion of the potential incremental value.
Related Links
- Measurement and Application of Market Participant Acquisition Premiums (Exposure Draft)
- Single-Serve Control Premium?
- What’s the Control Premium?
End Notes
1 Appraisal Foundation, APB VFR Advisory: The Measurement and Application of Market Participant Acquisition Premiums, exposure draft issued September 1, 2015, page 29, lines 588-597.
2 The Exposure Draft does not specify whether the debt component of the denominator should be gross or net of cash. In the examples in this post, we have used net debt (i.e., an enterprise value basis). Use of either gross or net debt is consistent with the spirit of the best practices guidance. We have used the enterprise value basis to promote consistency with enterprise value multiples of revenue and EBITDA that we will reference in subsequent sections. When using net debt, companies with cash balances in excess of interest-bearing debt will have enterprise values less than equity values, which will cause the enterprise value premiums to be larger than the equity value premiums (as is the case with ANN, Liberator Medical Holdings, and zulily in Table 3).
3 Revenue synergies are also possible, but in the case of these transactions, seem less likely than cost savings, so we will focus on the latter.
4 As of the date of drafting, Rite-Aid shareholders have approved the transaction, but regulatory approval is pending, and the transaction has not yet closed.
5 That is not to say that management of the acquirer has not identified cost savings. Ascena management indicated potential cost savings of $80 million in an investor presentation. However, a focus on margin relative to peers can help to maintain a focus on market participant synergies for the acquired business, rather than allowing secondary benefits potentially accruing to the buyer to unduly influence the fair value measurement.
Mercer Capital’s Financial Reporting Blog
Mercer Capital monitors the latest financial reporting news relevant to CFOs and financial managers. The Financial Reporting Blog is updated weekly. Follow us on Twitter @MercerFairValue.