After weak broad market performance in the first quarter of the year and slow advances during the summer, U.S. stocks generally saw amplified returns in the fourth quarter of 2015. The largest banks (those with over $50 billion in assets) generally performed in line with broad market trends, but most banks outperformed the market with total returns on the order of 10% to 15% for the year (Figure 1).
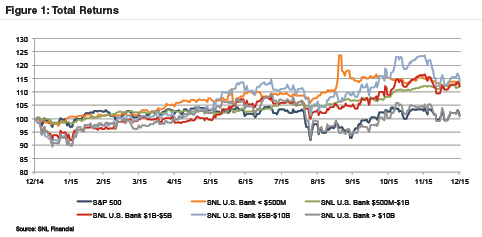
Bank stock performance improved markedly in the fourth quarter as speculation following the FOMC’s September meeting suggested rate increases may begin in the fourth quarter. In mid-December, the FOMC met again and, after seven years of its zero interest rate policy, announced an increase in the target fed funds rate. The shift in monetary policy is expected to gradually improve strains on banks’ net interest margins and should be most apparent for banks with more asset-sensitive balance sheets, though community banks that may have made more loans with longer fixed terms or loan floors may experience some tightening in the short term.
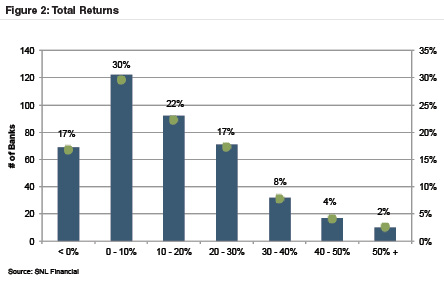
Bank returns generally averaged around 0% to 30% in 2015, though 17% of the U.S. banks analyzed (traded on the NASDAQ, NYSE, or NYSE Market exchanges for the full year) realized negative total returns. These included banks continuing to deal with high levels of NPAs; banks that are located in oil-dependent areas such as Louisiana and Texas; and some banks that have been active acquirers that missed Street expectations. On the other end, a few high performers in 2015 include merger targets as well as banks that have seen more success from acquisition activity (Figure 2).
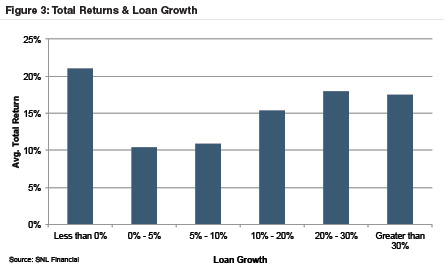
One of the primary factors contributing to stronger returns in 2015 was loan growth. Banks with loan growth over 10% exhibited above-average returns, while those with slower growth tended to exhibit lower returns, with the exception of banks that shrank their portfolios during the year, though for these banks the higher returns likely reflected prior years’ underperformance that was priced into the stocks (Figure 3).
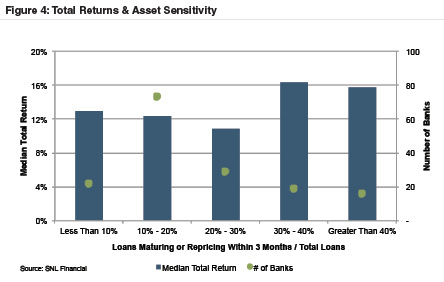
Asset-sensitive banks also outperformed in 2015. While asset sensitivity is difficult to evaluate from publicly available data, we measured asset sensitivity by the proportion of loans maturing or repricing in less than three months from September 30, 2015, relative to total loans (both obtained from FR Y-9C filings). Limiting the analysis to publicly traded banks with assets between $1 billion to $5 billion reveals that the most asset sensitive banks returned about 16% in 2015, or 400 basis points more than less asset sensitive banks (Figure 4).
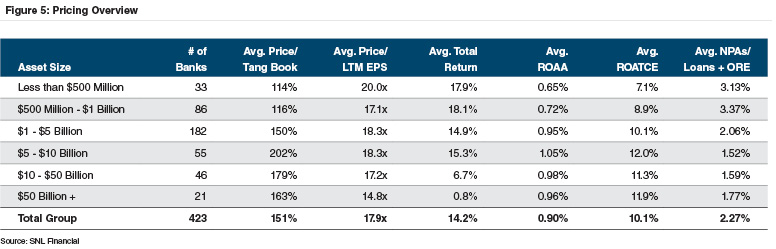
Though the smallest banks generally realized the highest returns in 2015, pricing multiples were strongest for banks with assets between $1 and $10 billion, which generally saw better profitability than the smaller banks. Year-over-year, pricing multiples generally remained flat from 2014 (Figure 5).
Mercer Capital is a national business valuation and financial advisory firm. Financial Institutions are the cornerstone of our practice. To discuss a valuation or transaction issue in confidence, feel free to contact us.

