Year in Review: Across MedTech, Discipline Is a Recurring Theme
Last month, the medtech team at Mercer Capital attended the 2025 Musculoskeletal New Ventures Conference, where discussions among founders, venture investors, strategic acquirers, and advisors converged on a consistent message: activity in the industry is increasingly shaped by discipline around clinical differentiation, capital efficiency, and strategic coherence. Innovation continues across the ecosystem, though expectations around execution, funding, and exit visibility have tightened.
For early-stage companies, investors described an environment that supports new ventures, albeit with a greater emphasis on efficient capital deployment. Successful companies are pursuing leaner development strategies with earlier clinical or regulatory wins, rather than broad, capital-intensive pipelines. Incremental innovation, particularly in mature segments such as orthopedics, has been attractive when paired with platform scalability or data-enabled (AI) differentiation. Management quality and adaptability remain critical at this stage.
In contrast, as other observers have also noted, venture capital has favored select growth-stage and later-stage deals. Investments flowed into companies able to articulate coherent clinical and commercial strategies aligned with the priorities of large, strategic buyers. Clear narratives around end-market adoption, strategic fit, and integration potential have tended to lead to higher valuations across observed transactions.
Among large, established medtech companies, portfolio optimization was an ongoing effort. For public companies, exposure to higher-growth segments has increasingly supported better valuation multiples and relative equity performance. In response, strategic acquirers such as Stryker, Boston Scientific, Medtronic, and Johnson & Johnson have tuned their portfolios through targeted acquisitions, divestitures, and capital redeployment. For example, Stryker’s acquisition of Inari Medical reflects the appeal of the high-growth interventional markets with strong clinical differentiation, while its divestment of the spine business demonstrates an effort to exit slower-growth or less strategically differentiated segments. Similarly, Johnson & Johnson’s acquisitions of Shockwave Medical and V-Wave in 2024 augmented a cardiovascular platform focused on markets with long-term growth potential, while the announced separation of its DePuy Synthes orthopedics business signals a broader effort to simplify and sharpen strategic focus within its portfolio.
Overall healthcare IPO activity in 2025 was broadly in line with 2024 levels, with issuance concentrated among higher-quality medtech and life sciences companies rather than reflecting a broad-based market reopening. Offerings such as Caris Life Sciences, which combined scale, revenue growth, and a differentiated data-driven platform, were relatively well received, suggesting that the IPO window remains available but is selective.
Across various company stages and transactions, 2025 activity in medtech reflected a consistent emphasis on disciplined, capital-efficient growth. Whether among early-stage investments prioritizing focused development, later-stage companies articulating clear strategic fit, or large strategics actively reshaping portfolios, the common thread has been the pursuit of durable clinical differentiation and well-defined paths to scale or exit.
Documenting Fair Market Value: Lessons from Estate of Rowland v. Commissioner
A Guide for Estate Planners
Executive Summary
Business valuations that are well-documented with support for the methodology used and how the concluded value was arrived at are at the core of effective estate tax planning. The recent decision in Estate of Rowland v. Commissioner (T.C. Memo. 2025-76) reinforces that truth by showing how incomplete valuation documentation within Form 706 can jeopardize an otherwise straightforward portability election.
While Rowland involved a filing delay, the Court’s opinion makes clear that a deficient or poorly documented valuation can be just as damaging as a missed deadline. For estates holding closely held business interests, which are often significant and complex assets, the importance of thoroughly documenting the process of reaching fair market value cannot be overstated.
Background: The Portability Election and Form 706
Under Internal Revenue Code § 2010(c)(5)(A), a surviving spouse may use any portion of the deceased spouse’s unused estate tax exclusion (the deceased spousal unused exclusion, or “DSUE”) if the first spouse’s executor properly elects portability.
That election must be made through a timely filed and complete Form 706. Even when an estate owes no estate tax, the return must contain detailed and supportable valuations of every asset, including business interests. Omitting or estimating values exposes the election to IRS challenge and potential invalidation.
Facts of the Case
Fay Rowland died in 2016, leaving an estate approximately $3.7 million below the filing threshold. Her executor obtained a six-month extension but filed Form 706 nearly six months after the extended deadline.
The return also lacked key valuation detail: 1) schedules reflected only estimated totals, not fair market values for individual assets; and 2) the executor claimed the “relaxed reporting” exception for assets passing to a surviving spouse, yet a portion of the estate passed to grandchildren’s trusts, making the exception inapplicable.
When the surviving spouse’s estate (Billy Rowland) later claimed Fay’s DSUE, the IRS denied the election, arguing the filing was neither timely nor properly prepared. The Tax Court agreed, which lead to Billy’s Estate paying approximately $1.5 million in additional taxes.
The Court’s Reasoning
Timeliness Was Not Enough
The Court held the return untimely, but even if it had met the filing window, it failed the requirement of being “complete and properly prepared.” Completeness, the Court emphasized, includes providing valuation information sufficient for the IRS to verify reported amounts and compute the DSUE accurately.
Valuation Documentation Is Integral to Completeness
Treas. Reg. § 20.2010-2(a)(7) requires a Form 706 filed solely to elect portability to include the same detail as a taxable return, except for assets passing entirely to a spouse or charity. The Rowland estate’s generalized estimates prevented the IRS from evaluating the DSUE computation.
The Court rejected arguments of substantial compliance and equitable relief, holding that valuation documentation is not simply a procedural technicality, but rather a statutory prerequisite.
Why Business Valuations Matter
For many families, closely held business interests comprise a large share of estate value. These assets require specialized valuation under Revenue Ruling 59-60. A well-supported valuation not only establishes compliance but also enhances the credibility of the entire filing.
A defensible business valuation requires:
- Identifying the rights and benefits of the interest being valued (control, transfer restrictions, etc.).
- Using relevant market evidence, including public comparables and transaction data.
- Applying sound financial analysis that addresses expected cash flows, risk, and growth prospects.
- Reporting clearly and effectively to the IRS and other readers.
Documentation: The Bridge Between Valuation and Compliance
The Rowland decision underscores that a valuation unsupported by documentation is no valuation at all. A properly prepared Form 706 should therefore include:
- Narrative descriptions of each business interest, outlining ownership, structure, and rights.
- Detailed valuation schedules explaining how conclusions were reached.
- Supporting exhibits, such as financial statements and methodology summaries.
- Explicit reference to appraisal standards that demonstrate compliance with USPAP and Treasury requirements.
Without these elements, a return fails the “complete and properly prepared” standard which is exactly what happened in Rowland.
Practical Guidance for Estate Planners
- Engage Qualified Appraisers Early. Business interests should be appraised by professionals experienced in federal transfer tax matters and IRS examinations.
- Coordinate Across Disciplines. Attorneys, accountants, and appraisers should align on ownership structures and entity specifics to ensure consistent reporting.
- Avoid Estimates or Prior-Year Values. Fair market value is determined as of the date of death; using approximations risks inconsistency with IRS standards.
- Explain Discounts and Assumptions. Clearly document the rationale for any discount for lack of control or marketability.
- Maintain Comprehensive Records. Preserve valuation reports, source data, and correspondence to support the filing if later reviewed or audited.
Conclusion
The Estate of Rowland v. Commissioner decision delivers a clear message: Form 706 filings must contain credible, well-documented fair market value determinations for all assets, particularly business interests, or risk invalidation. Portability hinges not only on timeliness but on the completeness and substantiation of reported values. The strength of the filing lies in the quality of its appraisals and the documentation supporting them.
At Mercer Capital, we integrate these principles into every estate and gift tax engagement, ensuring our valuation opinions are technically sound, clearly presented, and defensible which positions clients for successful outcomes under IRS scrutiny.
Valuations are a critical element of successful tax planning strategies and objective third-party valuation opinions are vital. Since 1982, Mercer Capital has provided objective valuations for estate, gift, and income tax matters across virtually every industry sector. To discuss your valuation needs in confidence, please contact one of our professionals or visit www.mercercapital.com.
Revisiting Solvency and Mark-to-Models
The fall of 2025 witnessed several high-profile bankruptcies that surprised the market, notable for both their suddenness and, in some cases, allegations of fraud. Pressure on consumer discretionary income —particularly among lower-income households—has been another theme. Of the top ten filings since September, seven were consumer-related, including Blink Fitness and Forever 21.
The November 4 Chapter 7 liquidation of Renovo Home Partners, with estimated liabilities of $100–$500 million, drew particular attention because it sat at the intersection of leveraged finance, private credit, and valuation. Renovo’s liabilities included a $150 million private credit loan from BlackRock TCP Capital Corp., a publicly traded BDC, marked at 100 as of September 30—just five weeks before the liquidation.
Backed by Audax Private Equity, Renovo was formed in January 2022 through the merger of three home improvement companies. While presumably solvent at inception, subsequent acquisitions and rising interest rates in 2022–2023 weighed on demand for home improvements as the company’s interest burden rose. Execution by management may have been an issue too. TCPC extended its $150 million loan (SOFR + 650 bps) in April 2024, which was carried at par at each subsequent quarter-end even though the company’s performance was deteriorating such that lenders converted some debt to equity in the spring of 2025 and the company elected to PIK in lieu of cash interest payments.
Solvency and Valuation
It is unclear whether Renovo obtained a solvency opinion when TCP extended the loan or when the platform was created. Regardless, the November 2025 bankruptcy filing raises questions about solvency and valuation at the time of the 2024 financing.
If (or had) the company obtained a solvency opinion, the following four questions would have been addressed:
- Does the fair value of the company’s assets exceed its liabilities after giving effect to the proposed action?
- Will the company be able to pay its debts (or refinance them) as they mature?
- Will the company be left with inadequate capital?
- Does the fair value of the company’s assets exceed its liabilities and surplus to fund the transaction?
Test 1: Balance Sheet Test
Does the fair value and present fair saleable value of assets exceed total liabilities, including contingencies?
This balance sheet test is a poorly named term for valuation whereby the subject company’s debt-free value is estimated using DCF, Guideline Public Company, Guideline M&A and Transactions (i.e., prior transactions or LOIs for the subject) methods. Sometimes, the NAV method will be utilized, too, for entities that are more akin to holding companies when assets can be marked to market.
Test 2: Cash Flow Test
Will the company be able to pay its liabilities as they mature?
This assesses whether projected cash flow can support debt service, considering:
- Revolver capacity: Sufficient liquidity to manage annual needs.
- Covenant compliance: Whether forecasts imply violations.
- Refinancing ability: Likelihood of refinancing maturing obligations.
Modeling can be complex or high-level, but assumptions about revenue growth and operating margins are often the key determinants for the cash flow test, which is based on common sense rules. If margins collapse, debt service is in trouble, and if it is steady or improves, then there presumably will not be issues.
Test 3: Capital Adequacy Test
Does the company have unreasonably small capital to operate?
Even if debt service is projected to be adequate, thin margins may leave little room for shocks. Adequacy is judged by pro forma leverage metrics (Debt/EBITDA, EBITDA/Interest) versus market and rating agency benchmarks.
Test 4: Capital Surplus Test
Do assets exceed the sum of liabilities and statutory capital?
This test mirrors the balance sheet approach but includes capital as defined under Section 154 of Delaware corporate law—namely, par value or total consideration received for stock issuance by Delaware-chartered companies.
Mark-to-Model
A forthcoming post will address how private credit is marked. The Renovo case stands out because TCPC marked its loan at par for five quarters, only to prospectively write it down to zero by year-end 2025. The situation has fueled existing widespread skepticism toward private market valuation practices—sometimes dubbed mark-to-myth. Ultimately, every asset marked-to-model becomes marked-to-market once it trades or, in the case of credit, is (or is not) repaid in full.
About Mercer Capital
Mercer Capital is a valuation and transaction advisory firm that values private equity and credit investments and provides solvency opinions for corporate boards, lenders, and other stakeholders involved in highly leveraged transactions.
The New Frontier Of Consumer Credit: Banks vs. Fintechs
Over the past three decades, community and regional banks have scaled back consumer lending while large banks and specialty finance companies have captured significant market share through economies of scale and robust origination platforms. Firms like American Express (NYSE:AXP), Capital One (NYSE:COF), Synchrony Financial (NYSE:SYF), and Ally Financial (NYSE:ALLY) leverage FDIC-insured deposit funding to power their lending operations. Most of these players, along with acquired entities like Discover Financial, operate at the intersection of payments and credit. Visa (NYSE:V) and Mastercard (NYSE:MC) are important payment partners to traditional banks, however.
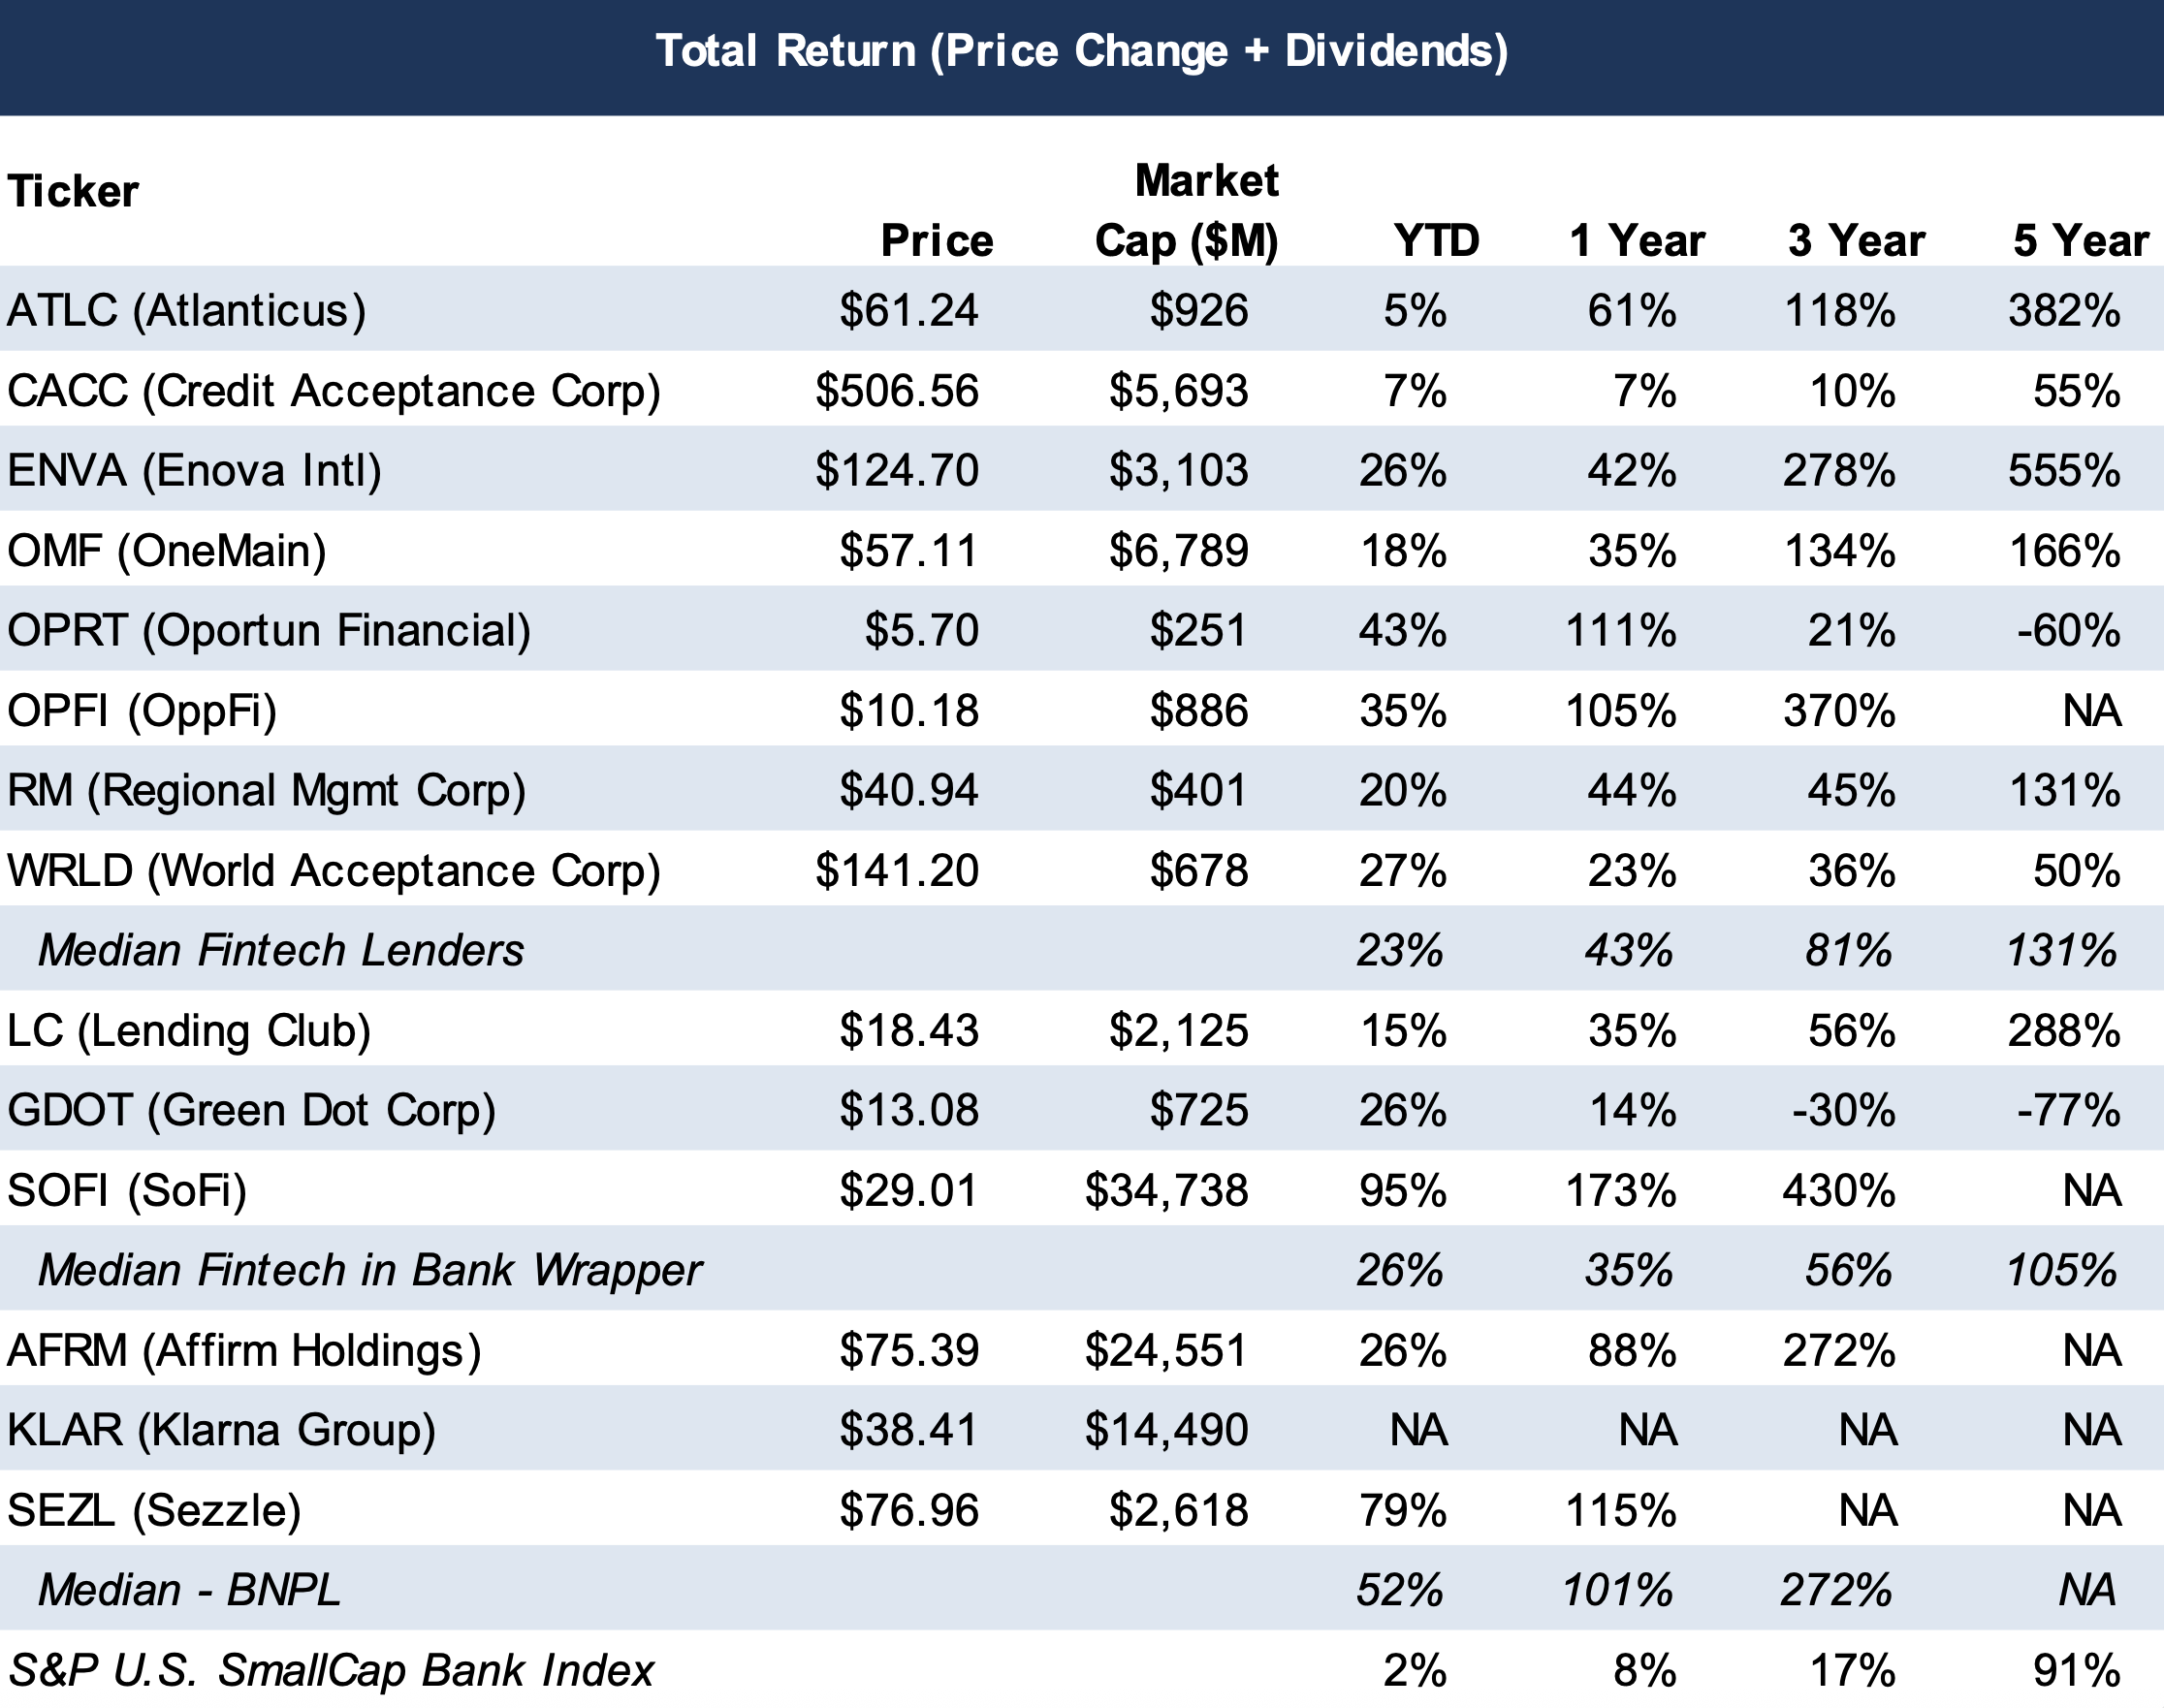
Since the GFC ended in 2009, fintech has transformed consumer credit and payments, intensifying competition for banks and expanding credit access, particularly for subprime and near-prime borrowers. Fintech lenders such as OppFi (NYSE:OPFI), Enova (NYSE:ENVA), and Oportun (NASDAQGS:OPRT) have carved out niches by using data-driven underwriting and digital delivery to serve underserved markets.
BNPL providers like Affirm Holdings (NASDAQGS:AFRM), Klarna (NYSE:KLAR), and Sezzle (NASDAQCM:SEZL) have further reshaped the landscape, offering easy payment options to consumers while boosting merchant sales. Established players like PayPal (NASDAQGS:PYPL) and Block (NYSE:SQ) have also embraced BNPL, with Block’s Afterpay and Cash App exemplifying a broader mission to democratize financial services.
The operating environment for these companies has been favorable this year because funding is relatively easy with wide open capital markets; the Trump Administration has virtually dismantled the CFPB and borrowing costs are declining with Fed rate cuts. In 2023, funding was difficult in the wake of SVB’s failure (e.g., Affirm struggled to complete one or more securitizations), and the CFPB under the Biden Administration presented a challenging regulatory environment.
The Rise of Alternative Lenders
Post-Dodd-Frank, many banks retreated from small-dollar and unsecured lending due to heightened compliance costs and regulatory scrutiny, which diminished the appeal of these products. Fintechs filled the gap, leveraging technology to serve subprime and near-prime consumers. Companies like OppFi paired underserved borrowers with credit products through digital channels, often via partnerships with small banks.
Using alternative data, machine-learning underwriting, and payroll-linked repayment models, these firms positioned themselves as modern alternatives to payday loans and credit cards. BNPL providers like Affirm and Klarna followed suit, offering short-term, interest-free or low-interest installment plans that gained traction amid post-COVID e-commerce growth.
Convergence of Banks and Fintechs
In recent years, the distinction between banks, fintech lenders and payments has blurred somewhat. Block’s company description captures this from a portfolio perspective:
Block builds technology to increase access to the global economy. Each of our brands unlocks different aspects of the economy. Square makes commerce and financial services accessible to sellers. Cash App is the easy way to spend, send, and store money. Afterpay is transforming the way customers manage their spending. TIDAL is a music platform that empowers artists. Bitkey is a simple self-custody wallet built for bitcoin. Proto is a suite of bitcoin mining products and services. Together, we’re helping build a financial system that is open to everyone.
For fintech lenders offering “lending as a service,” access to low-cost, stable deposit funding and perhaps greater regulatory certainty remains a coveted advantage of traditional commercial banking. Some have accessed bank funding. LendingClub acquired Radius Bank in 2021 to become a bank, and SoFi’s 2022 charter has bolstered its funding advantage. Others, like OppFi, rely on FDIC-insured bank partners to originate loans while retaining servicing or purchasing receivables.
Banks’ deposit-funded models offer a structural edge, especially after recent rate-driven deposit repricing while most fintechs and BNPL providers remain heavily dependent on capital markets and alternative lenders. Regulatory scrutiny, particularly of “rent-a-bank” partnerships, adds further complexity.
Valuation Dynamics
We are struck by the similarities and dissimilarities between banks and fintech lenders. Multiples are heavily influenced based upon investor perceptions of earnings growth (or free cash flow/excess capital) and risk (funding, compliance and credit). Overlaid are questions about the role of BNPL in providing incremental credit to subprime consumers and thereby sustaining consumer spending as student loan deferral end.
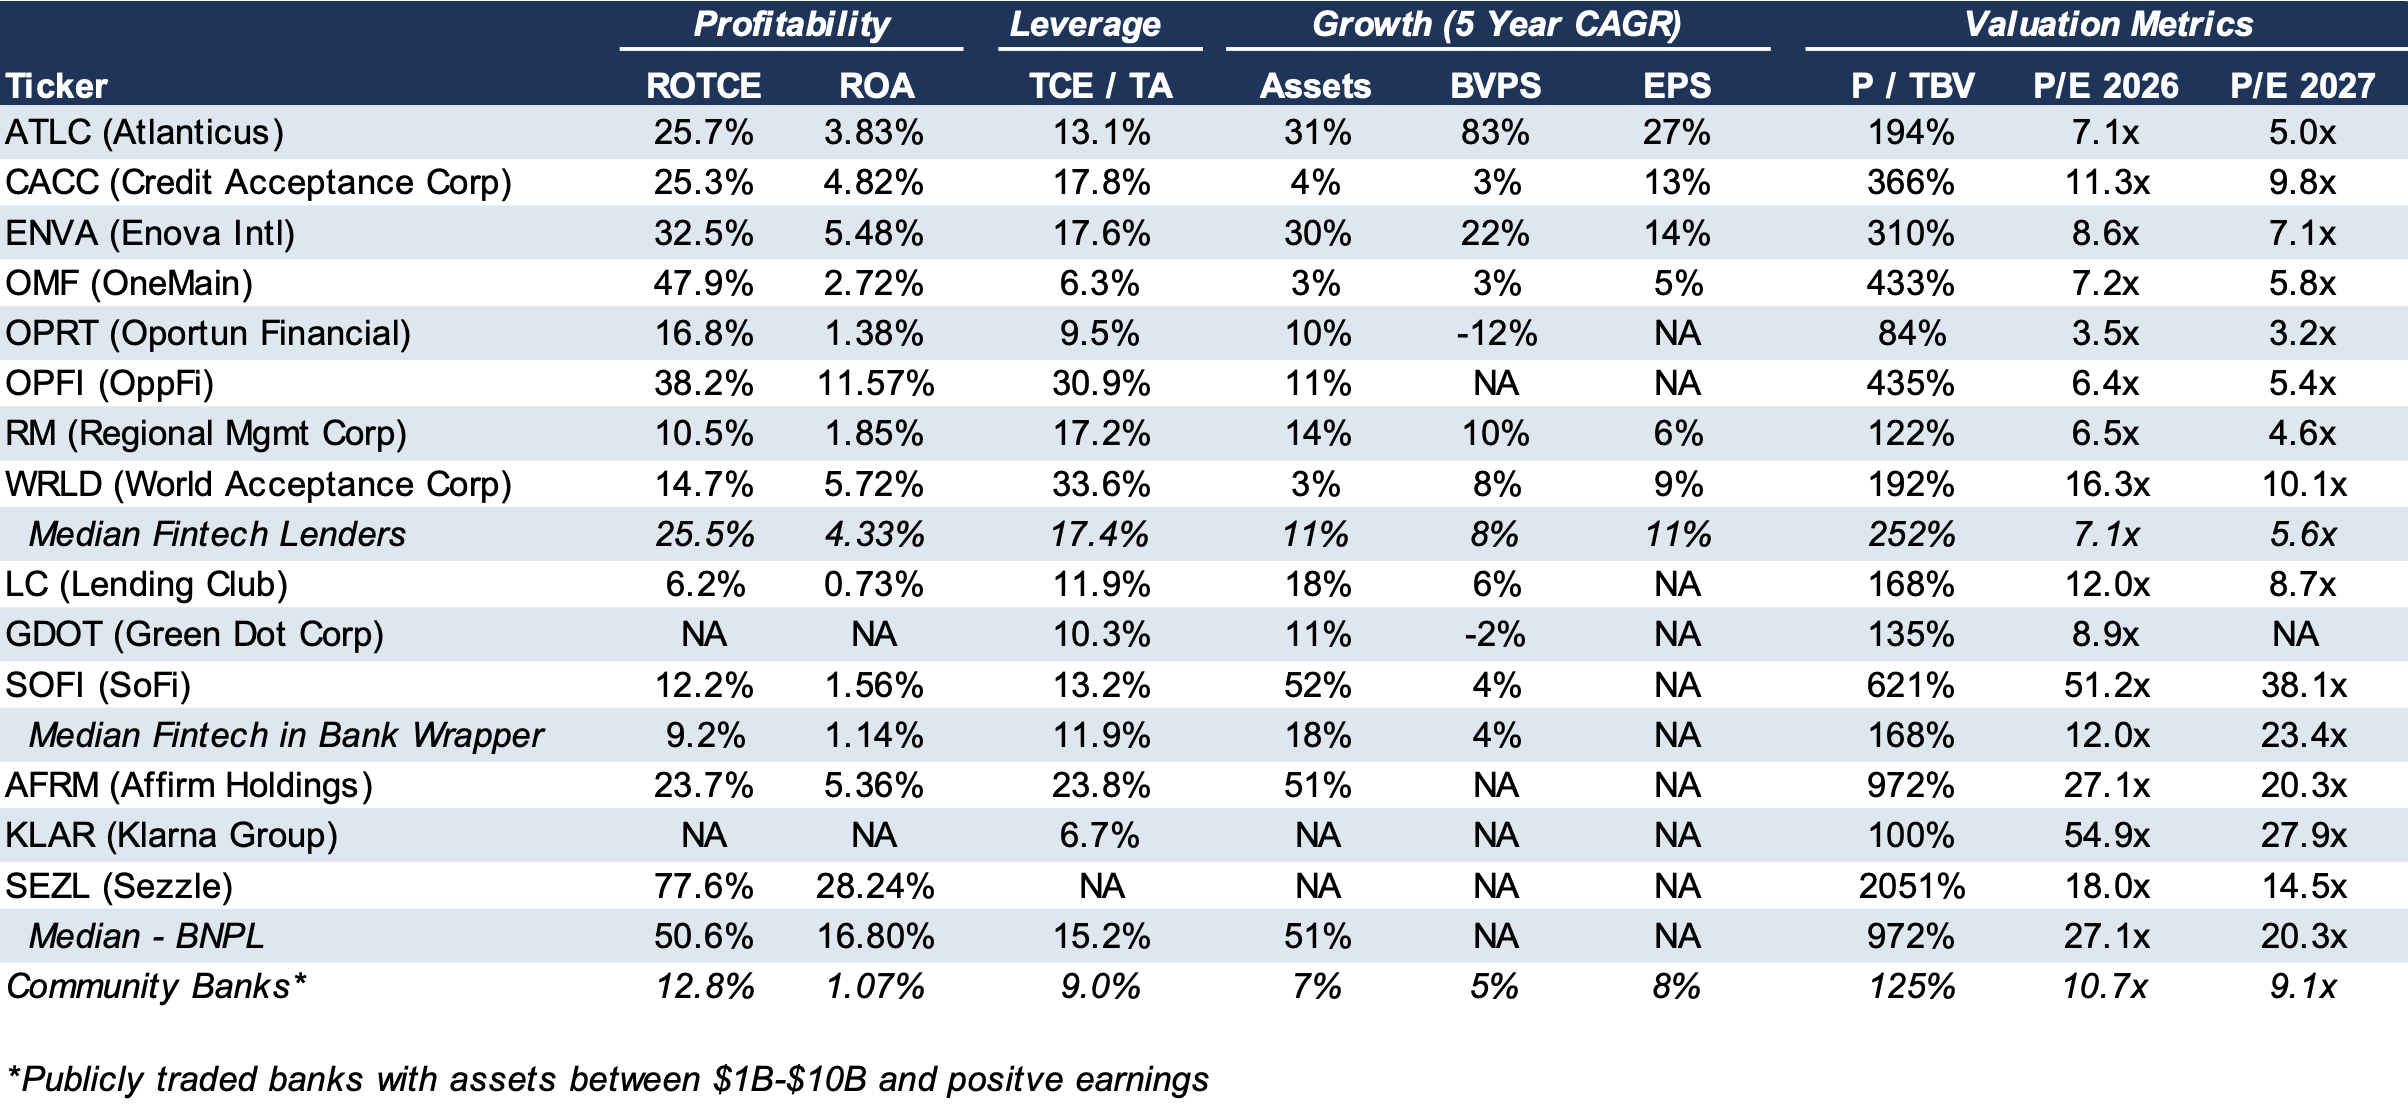
Valuations reflect these dynamics to some extent whereby lower growth implies lower earnings multiples for banks vs. fintech/BNPL whereas less funding and arguably regulatory risk translates to higher relative multiples. Perhaps the two big multiple determinants roughly offset between banks and the new economy lenders.
As of late October 2025, fintech lenders trade at ~7x forward earnings, often above book value, signaling market confidence in their scalability but wariness of credit and funding risks. Traditional banks, by contrast, command 9–10x earnings and 1.1–1.3x tangible book value, reflecting the stability of deposit funding and diversified income streams. High-performing fintechs and BNPL platforms with disciplined underwriting and scalable technology post strong returns on equity, commanding premium multiples. Weaker players, however, face low single-digit P/E ratios or trade below book value due to credit losses or regulatory missteps.
This “trust discount” applied to fintechs and BNPL providers creates opportunities. Banks can acquire fintech platforms to modernize underwriting and distribution, while fintechs with strong analytics but limited capital can benefit from deeper bank partnerships. For example, BNPL providers like Affirm could enhance bank offerings by integrating flexible payment options into existing credit products.
Conclusion
As digital lending evolves, success will hinge on balancing innovation with timeless banking principles based upon capital, credit and funding stability with innovation, growth and a larger addressable market that fintech/BNPL enables.
About Mercer Capital
Mercer Capital is a business valuation and financial advisory firm that values the securities and assets (e.g., portfolio fair value) of privately held financial and non-financial companies. Our advisory services entail M&A representation and the provision of transaction opinions (fairness and solvency). Please call if we can be of assistance.
Evaluating the Buyer’s Shares
Bank M&A has accelerated in 2025 with 144 announced transactions as of October 29 and looks to be set for ~175 deals this year compared to 133 last year. Other than the smallest deals, usually consideration paid to selling shareholders consists of the buyer’s common shares or a mix of shares and cash.
Accepting the buyer’s stock raises a number of questions, most of which fall into the genre of: what are the investment merits of the buyer’s shares? The answer may not be obvious even when the buyer’s shares are actively traded.
Our experience is that some, if not most, members of a board weighing an acquisition proposal do not have the background to thoroughly evaluate the buyer’s shares. Even when financial advisors are involved, there still may not be a thorough vetting of the buyer’s shares because there is too much focus on “price” instead of, or in addition to, “value.”
Key questions to ask about the buyer’s shares include:
- Liquidity of the Shares. What is the capacity to sell the shares issued in the merger? SEC registration and NASDAQ and NYSE listings do not guarantee that large blocks can be liquidated efficiently.
- Institutional Ownership and Index Membership. Is there much institutional ownership and what is the weighting of the buyer’s shares in various indices? Liquidity tends to improve with greater institutional ownership and index weighting.
- Profitability and Compounding. The banking model is predicated upon leveraging capital to produce shareholder returns (i.e., ROE and ROTE). Is ROE/ROTE competitive vs. peers through time? How is it generated (e.g., efficiency or parent company leverage)? Can the acquirer be described as a “compounder” of capital?
- Capital Management. How is capital allocated among reinvestment, dividends, share repurchases and M&A?
- Reported vs. Core Earnings. What is the quality of earnings as discerned by a comparison of reported vs. core earnings over a multi-year period (e.g., the last five years and five quarters)?
- TBVPS Dilution. What is the projected dilution to tangible BVPS at closing and how long to recoup it from less certain EPS accretion once expense saves are realized?
- Seller Pro Forma Perspective. What is the pro forma impact to tangible BVPS, EPS and DPS from the perspective of selling shareholders?
- Analyst Estimates. If the buyer is publicly traded and has analyst coverage, how do the budget and management’s formal or informal projections for the next couple of years compare with the Street’s consensus?
- Valuation. How does the current valuation (P/E and P/TBV) compare to current peers and what has the valuation range been in absolute terms and compared to peers over the past decade?
- Share Performance. How have the shares performed compared to peers and relevant indices over multi-year holding periods and how have changes in valuation impacted the performance?
- Pro Forma Capital. Will the buyer have ample regulatory capital, and is the parent company capital structure overly-levered and/or complex?
The list does not encompass every question, but it illustrates that a liquid market for a buyer’s shares does not necessarily answer questions about value, growth potential and risk profile. We at Mercer Capital have extensive experience in valuing and evaluating the shares (and debt) of financial service companies garnered from over four decades of business.
The Discount for Lack of Marketability in Divorce: Real World Examples and Considerations – Part 2
In Part 1 of this post, we defined valuation discounts such as the discount for lack of control and discount for lack of marketability. We discussed the difference between fair value and fair market value, illustrated the importance of the prevailing state statute, and gave arguments for and against employing valuation discounts in a divorce context. Now we will discuss common drivers of marketability discounts and contextualize them with common provisions in partnership agreements and go through a case study.
Common Drivers of Marketability Discounts
Valuation discounts are not arbitrary devices to reduce value in litigation. They exist because of real-world features that make certain ownership interests more difficult to sell or less attractive to outside investors. In fact, many of these features are intentionally built into partnership agreements or shareholder arrangements to protect the business and its stakeholders. A few include:
- Restrictions on Transfer: Many closely held businesses restrict or require approval for ownership transfers. These provisions seek to keep control within a family, a select group of partners, or a trusted ownership base. While these restrictions enhance stability for the company, they limit an individual investor’s ability to sell readily, creating real economic limitations that justify a discount.
- Distribution Policy: Some companies retain earnings to fund growth, acquisitions, or working capital needs rather than distributing profits. This policy is often in the long-term interest of the business, but for minority owners it means cash returns are uncertain or deferred.
- Governance and Control Provisions: Voting thresholds, rights of first refusal, and mandatory buy-sell provisions can protect a company’s continuity but can also constrain minority investors. These contractual realities reduce the pool of willing buyers and reduce near-term optionality and liquidity for minority investors.
While there are many potential provisions in governance documents that would influence valuation discounts, the above are some of the most common. The degree to which these provisions impair the ability to achieve liquidity influences the magnitude of the discount. In most cases, experts agree that a DLOM applies, but they may disagree as to the magnitude.
A Real World Example
If a spouse invests liquid marital funds into a less liquid minority interest in a private company, that spouse could later argue that the subject interest lacks marketability. Thus, the value of this asset for division would be lower.
Suppose a divorcing party invested $1,000,000 from the marital estate for a 25% stake in a limited partnership which invests in real estate. Next, let’s assume the underling real estate was acquired for $10,000,000, financed by $6,000,000 in debt and $4,000,000 in equity, from four investment partners who each contributed $1,000,000.
On the date of contribution, it would be hard to argue that each individual’s investment is worth anything other than $1,000,000. But what if this investment had occurred many years prior to the divorce proceedings? What is the property worth now? What is the remaining debt balance? Has the partnership been making regular distributions?
For this fact pattern, let’s assume the parties have hired real estate appraisers to value the property for the divorce and it is worth $12,500,000, and the debt balance has been paid down to $4,500,000 for an equity value of $8,000,000, or $2,000,000 pro rata for each partner.
If the divorce is filed in a state fair market value state, discounts for lack of control and/or marketability would likely apply, reducing the value. If the 25% subject interest is determined to support a combined valuation discount of 30%, that would be applied to the $2,000,000, resulting in a nonmarketable minority value of $1,400,000. While there are legitimate reasons (and support) for this discount, the non-owner spouse would likely be considered disadvantaged if the investment occurred after divorce proceedings commenced. This is a clear example of why temporary restraining orders (TROs) are common in divorce. These types of orders seek to protect the other spouse from a DLOM that one could argue was intentionally manufactured.
The Bottom Line
The debate over DLOMs in divorce comes down to economic equality versus market reality. Should the valuation(s) and resulting divisions aim to replicate what the open market would pay? Or should there be more consideration such that the non-owner spouse isn’t disadvantaged by a “hypothetical” discount? For divorcing couples with a privately held minority business interest, the answer depends on the standard of value in the relevant jurisdiction. Furthermore, the facts and circumstances of the subject interest may support a discount on the lower or higher end of a reasonable range.
This is precisely why we typically caveat responses to such questions with “facts and circumstances matter.” The jurisdiction matters. The intent and timing of the investment matter. The relationship between the other investing parties matters. What if the other three partners in the hypothetical venture were all related to one of the divorcing spouses… and the partnership agreement states that owners may only be blood-line relatives (limiting a potential pool of buyers for hypothetical resale)? A trier of fact is likely to consider all these factors, even in a jurisdiction that does and doesn’t allow for discounts.
This makes it even more important that the retained business valuation expert is experienced with engagements requiring the determination of discounts for lack of marketability and control, what quantitative and qualitative methodologies to consider, documents, data & information to consider, among other factors. Contact a member of Mercer Capital’s litigation support services team today.
Third-Party Fairness Opinions in Continuation Funds: Lessons from Deep NAV Discounts
The Paramount Deal: A Reality Check on Valuations
On September 17, 2025, alternative asset manager Rith Capital Corp. (NYSE:RITM) agreed to acquire office REIT Paramount Group, Inc. (NYSE:PGRE) for $1.5 billion cash, or $6.60 per share. Paramount is an integrated REIT that manages and owns 13.1 million square feet of Class A offices (86% occupancy rate) in New York and San Francisco.
Word of the deal, but not the price, leaked because the shares rose 4% on September 16 to $7.39 per share on volume that was 5x above average. Relative to the pre-leak closing price on September 15, the deal price represented a 7% discount and equated to 48% of book value and 10.2x funds from operations (“FFO”).
By way of comparison, RITM’s shares as of year-end 2019 closed at $13.92 per share, which equated to 82% of book value and 14.5x LTM FFO. And for those who can time the market, the shares traded just below $4.00 per share immediately after “Liberation Day” and thereby provided a great five-month return.
When Book Value Isn’t Market Value
Paramount was not a high-flyer. The dividend was suspended in September 2024 after having been cut in June 2023 and December 2020. The stock traded below book value for years. The public market and change-of-control transactions imply the carrying value of the assets was too high though the 2024 10-K notes that real estate assets carried at cost less accumulated depreciation are individually reviewed for any impairment.
Aside from an impairment issue, GAAP did not dictate that the $8.3 billion land, buildings and improvements be marked-to-market so that book value could be directly equated with net asset value (“NAV”). Nonetheless, investors did so daily yet still over-estimated NAV that a competitive process revealed it to be in a change-of-control transaction.
Secondary Pricing as % of NAV (by weighted average volume)
The Broader Challenge: Overstated NAVs in Private Markets
Paramount illustrates what some think is a pervasive issue in private equity and to a lesser extent private credit whereby fair value marks and therefore NAVs are too high. An unwillingness to recognize reality may be one reason PE exits are too low relative to investment. Assets are held in the hope that next year conditions will be better – the M&A market improves, the company’s earnings will be higher, etc.
Continuation Funds and Valuation Gaps
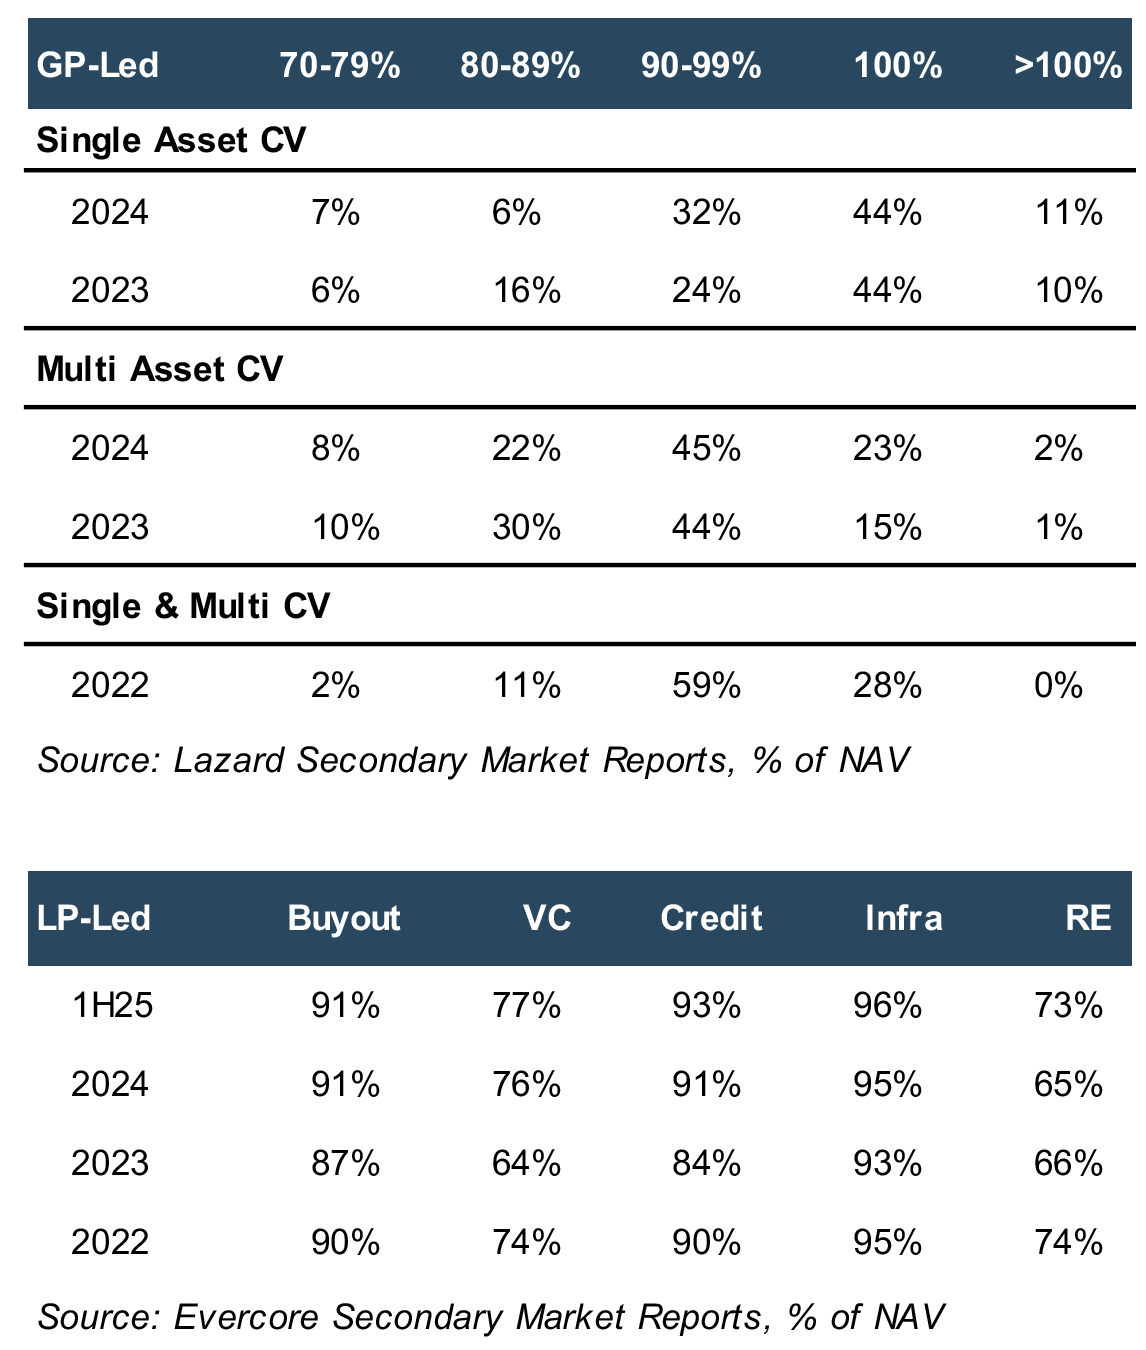
Continuation vehicles (“CV”) with five year lives that acquire assets from PE funds are a bridge to a potentially better tomorrow, but valuation gaps today based upon what the CV asset marketing process reveals vis-?-vis the current mark can be material though the data is nuanced. Evercore in its mid-year 2025 update estimates that 87% of GP-led secondaries transacted at less than NAV. Lazard estimates that 90% of single-asset and 70% of multi-asset GP-led secondaries transacted at 90% of NAV or higher in 2024. However, the data does not distinguish between cash paid at closing and contingent earn-out payments; so, the effective transaction price vs NAV may be wider.
LP-led secondaries offer additional perspective—albeit for a portfolio interest vs one or more ~plum assets—with discounts to NAV on the order of 10% for buyout interests vs 25% for venture and real estate assets. One could argue the LP discount or some portion of it reflects an illiquidity discount vs appropriateness of the NAV mark for
the portfolio.
Governance Under Pressure: The Business Judgment Rule
Directors of corporations operate under the long-held concept of the Business Judgment Rule (“BJR”) where courts generally will not second guess decisions as long as directors do not violate the fiduciary triad of care (informed decision making), loyalty (interests aligned with shareholders, conflicts fully disclosed), and good faith. Application of the BJR to GPs varies by state and will be viewed through the lens of the partnership agreement when disputes arise.
Secondary Market Transaction Volume Over Time ($bn)
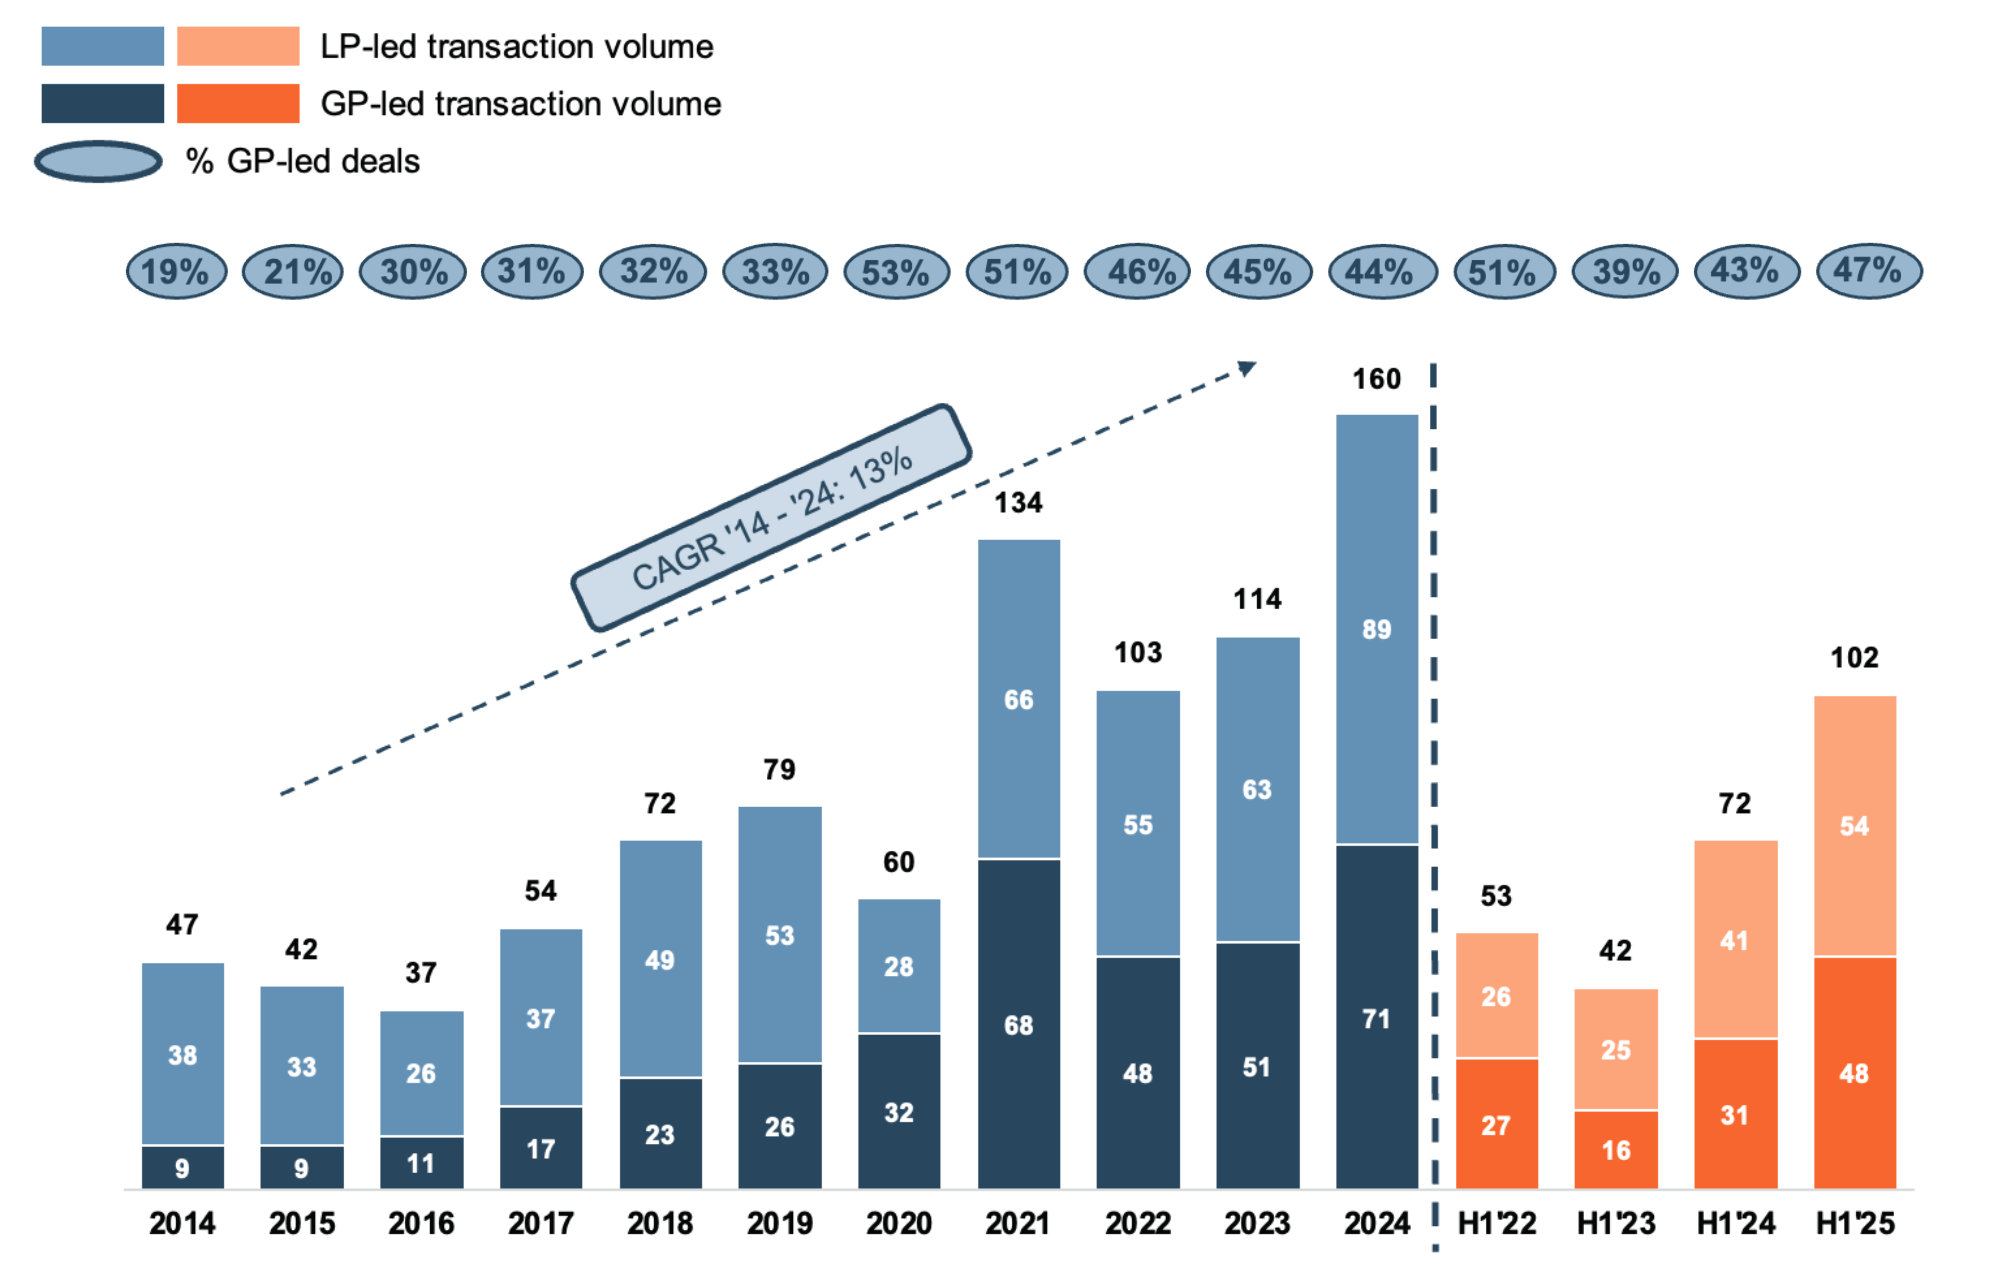
BJR murkiness notwithstanding, GP-led secondary transactions are problematic from a governance perspective because GPs are both seller and buyer, and the GP has a financial incentive to extend the period on which management fees and carry are earned.
The Role of Fairness Opinions
The institutionalization of GP-led continuation funds has led to the development of a fair dealing process to address the loyalty question—at least outwardly—in which a third-party financial advisor markets the subject asset(s) to investors who would capitalize a CV. The proposal with the combination of the best price and terms with confirmed access to capital will be selected to transact subject to a conflict of interest waiver from the LP advisory committee (“LPAC”).
Third-party fairness opinions emerge as indispensable here for the LPAC, bridging process and price vis-?-vis the historical fair value marks. Unlike binary “fair/unfair” verdicts, these assessments—rooted in rigorous due diligence—evaluate the marketing process, transaction terms from a financial point of view, dissecting NAV assumptions, cap rates, and exit multiples against market comps.
Best Practices and Industry Guidance
For continuation funds, the stakes are higher: GPs must demonstrate that discounts reflect arm’s-length negotiations, not convenient happenstance. The CFA Institute research on ethics in private markets emphasizes competitive bidding processes to mitigate manager incentives—strong financial additions like promoted interests in the new fund can skew outcomes toward overvaluation. ILPA’s 2023 guidance amplifies this, urging 30-45 day timelines for LP re-underwriting, full disclosures on advisor conflicts, and LPAC pre-approvals to safeguard alignment.
Beyond a Checkbox: Upholding Fiduciary Integrity
Ultimately, fairness opinions are not mere check boxes; they are part of the governance protocol to address the care and loyalty duties that are the cornerstone of the BJR.
About Mercer Capital
Mercer Capital is an independent valuation and financial advisory firm founded in 1982, specializing in business valuation, corporate transactions, and financial opinions. With offices in Dallas, Houston, Memphis, Nashville, and Winter Park, we serve private equity sponsors, portfolio companies, and institutional investors in valuing complex, illiquid equity, credit, mezzanine and other such securities. Our fairness opinion practice, a cornerstone of our expertise, provides objective assessments for conflicted transactions such as GP-led secondaries and continuation funds. Drawing on deep market insights and rigorous due diligence, we help clients navigate governance challenges, ensure regulatory compliance, and maximize stakeholder alignment. For more, visit mercercapital.com.
2025 Core Deposit Intangibles Update
Since Mercer Capital’s most recently published article on core deposit trends in September 2024, deal activity in the banking industry is showing some signs of improvement. There were 77 deals announced in the first and second quarters of 2025 as compared to 65 during the same period of 2024. It is possible that transactions will pick up further due to a less stringent regulatory environment in the Trump administration. Additionally, funding pressure has eased significantly over the last two years, and mark-to-market adjustments on loans and deposits are declining. Despite short-term interest rates declining from their peak, we have seen a marginal uptick in core deposit intangible values in the most recent deal announcements.
Figure 1 :: U.S. Treasury Yield Curve
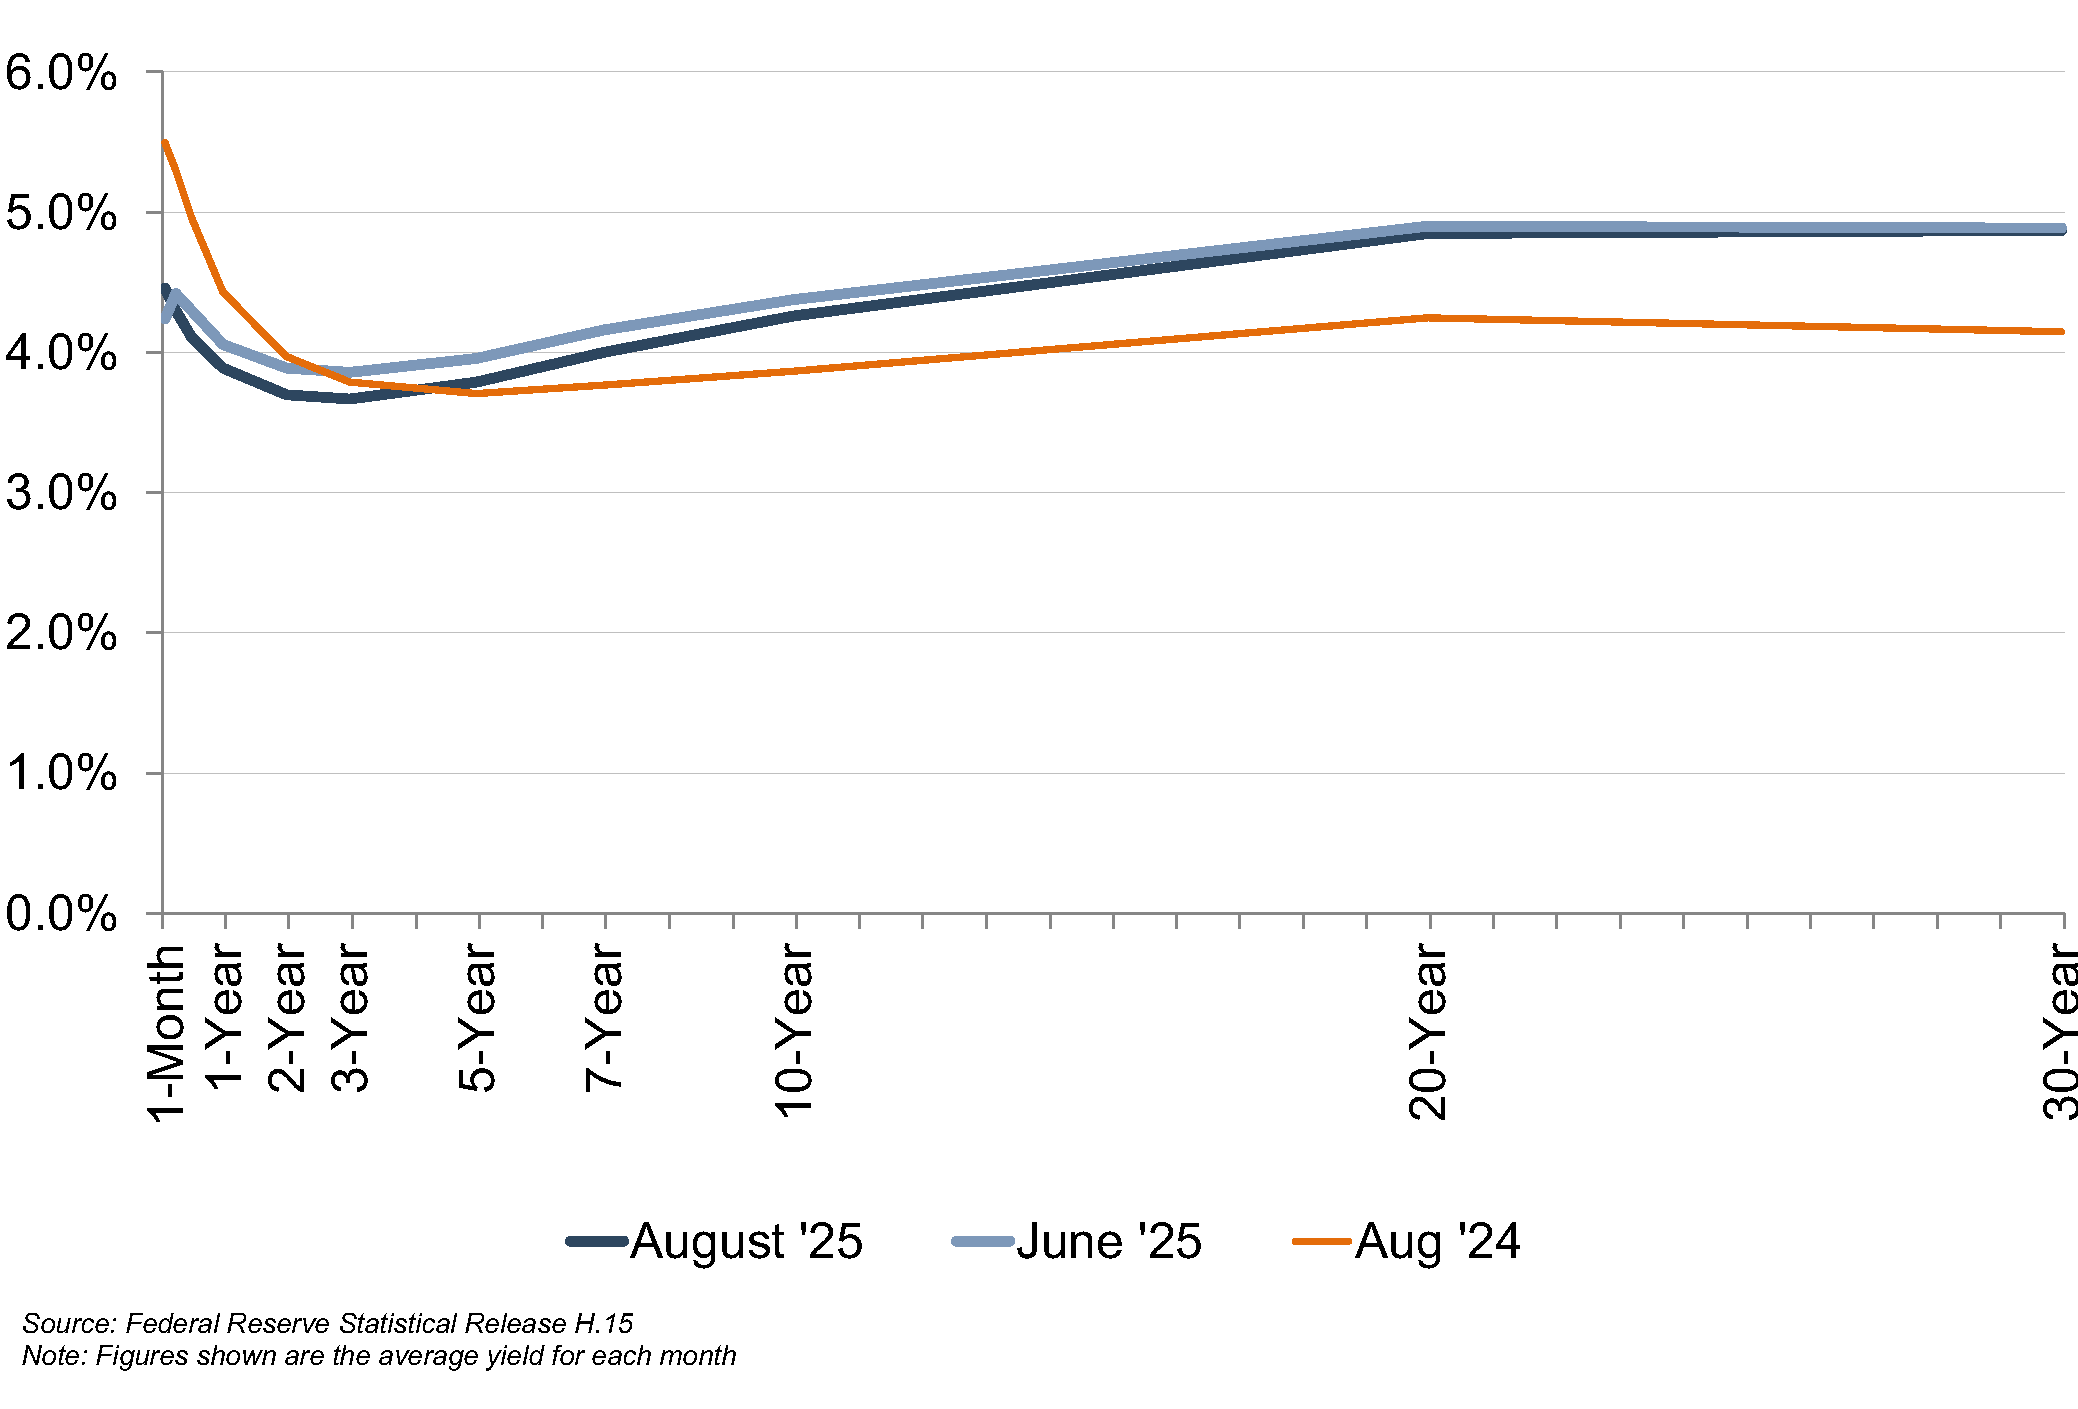
While many factors are pertinent to analyzing a deposit base, a significant driver of value is market interest rates. All else equal, lower market rates lead to lower core deposit values. In its September 2024 meeting, the Federal Reserve reduced the target federal funds rate by 50 basis points. This was the first downward adjustment since the FOMC began increasing rates in March 2022. In its third and fourth quarter 2024 meetings, the Federal Reserve reduced the target federal funds rate by 25 basis points at each meeting. After several quarters of steady rates, an additional 25 basis point reduction occurred in the September 2025 meeting. These cuts left the benchmark federal funds rate in a range between 4.00% and 4.25%.
Figure 2 :: Federal Reserve Dot Plot
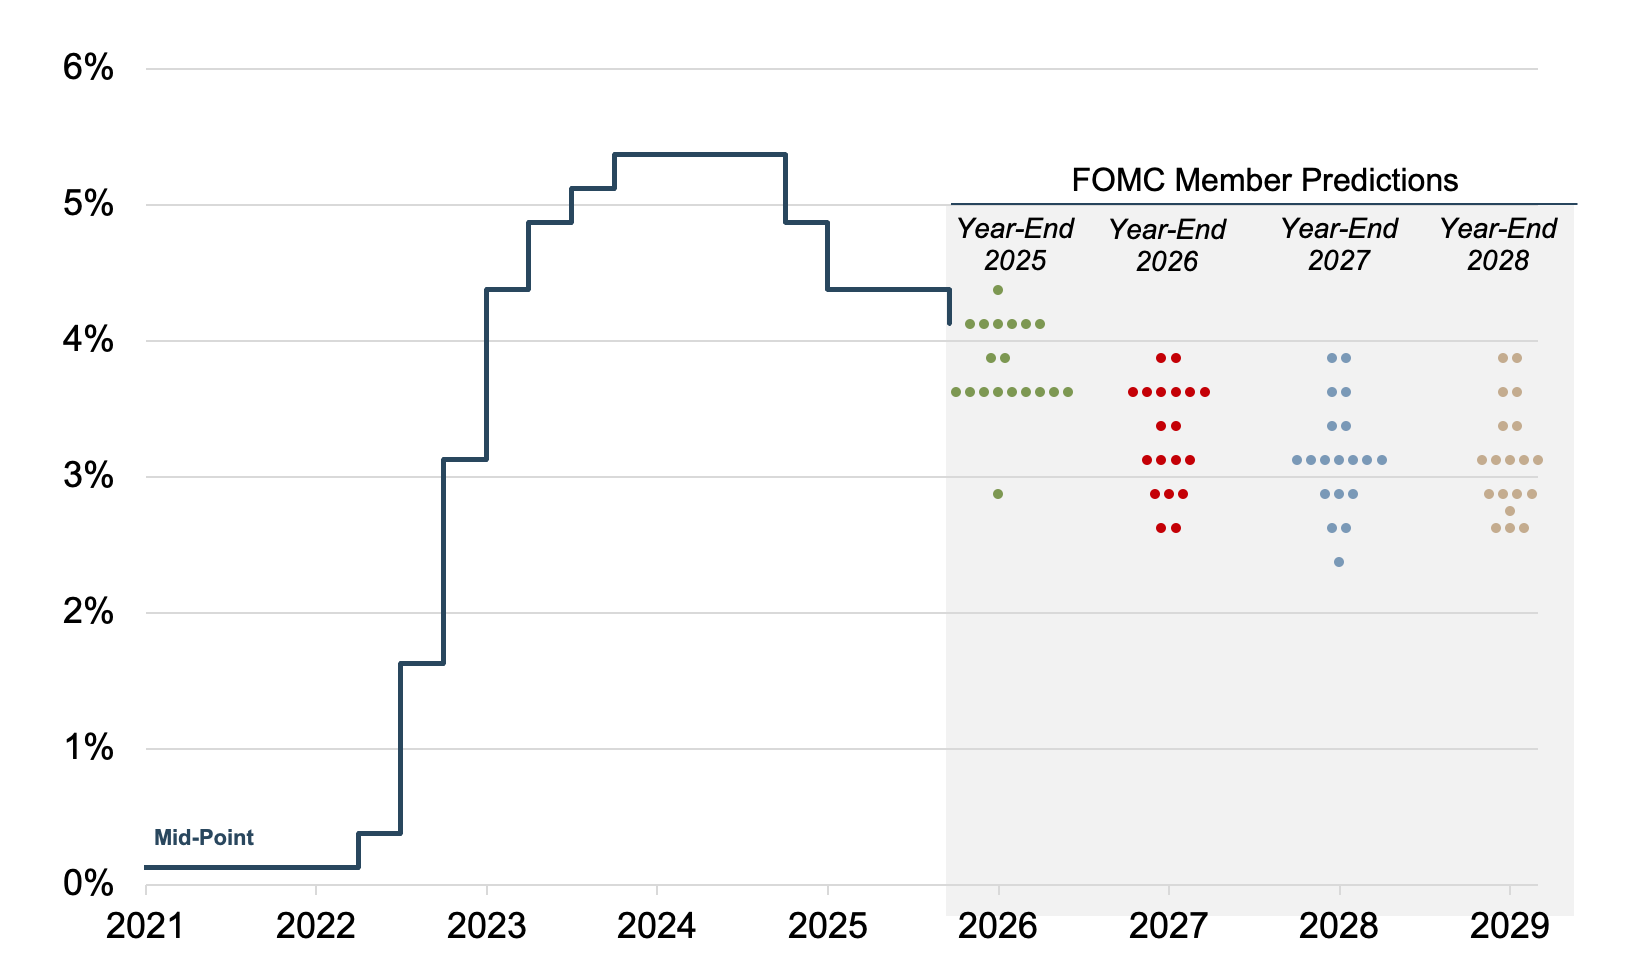 Source: Federal Reserve Summary of Economic Projections
Note: Figures shown represent predictions for the end of the calendar year
As shown in Figure 1, on the previous page, the yield curve for U.S. Treasuries has shifted downward relative to last year at this time for terms of less than five years, and the market expects further downward movement in short-term rates in the near-term.
The Federal Reserve’s “dot plot”, presented in Figure 2, on the previous page, exhibits a wide dispersion of expectations for the near term, especially for 2026. Although the magnitude of future adjustments to the target rate is unclear, the expectation is clearly for lower rates.
Trends In CDI Values
Using data compiled by S&P Global Market Intelligence, we analyzed trends in core deposit intangible (CDI) assets recorded in whole bank acquisitions completed from 2000 through mid-September 2025. CDI values represent the value of the depository customer relationships obtained in a bank acquisition. CDI values are driven by many factors, including the “stickiness” of a customer base, the types of deposit accounts assumed, the level of noninterest income generated, and the cost of the acquired deposit base compared to alternative sources of funding. For our analysis of industry trends in CDI values, we relied on S&P Global Market Intelligence definition of core deposits. In analyzing core deposit intangible assets for individual acquisitions, however, a more detailed analysis of the deposit base would consider the relative stability of various account types. In general, CDI assets derive most of their value from lower-cost demand deposit accounts, while often significantly less (if not zero) value is ascribed to more rate-sensitive time deposits and public funds. Non-retail funding sources such as listing service or brokered deposits are excluded from core deposits when determining the value of a CDI.
Figure 3 summarizes the trend in CDI values since the start of the 2008 recession, compared with rates on 5-year FHLB advances. Over the post-recession period, CDI values have largely followed the general trend in interest rates—as alternative funding became more costly in 2017 and 2018, CDI values generally ticked up as well, relative to post-recession average levels. Throughout 2019, CDI values exhibited a declining trend in light of yield curve inversion and Fed cuts to the target federal funds rate during the back half of 2019. This trend accelerated in March 2020 when rates were effectively cut to zero.
Figure 3 :: CDI as % of Acquired Core Deposits
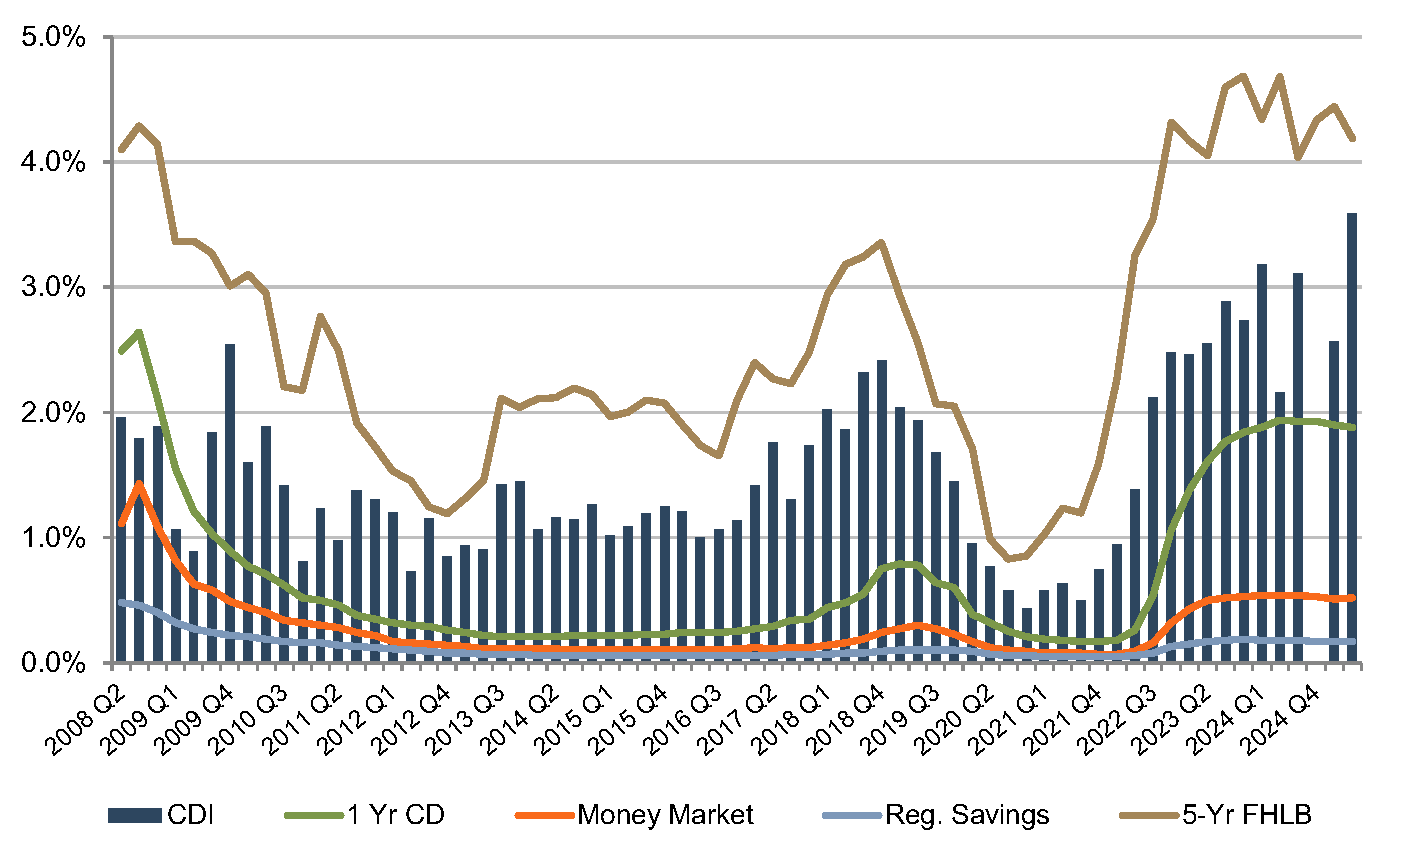 Source: S&P Global Market Intelligence Cap IQ Pro
CDI values have been somewhat flat compared to last year, averaging 2.47% through mid-September 2025. Excluding one transaction with an unusually low core deposit intangible ratio, the average is closer to 2.70%. This compares to a 2.73% average for all of 2024, 2.58% for 2023, 1.60% for 2022 and 0.63% for 2021. Recent values are above the post-recession average of 1.53%, and on par with longer-term historical levels which averaged closer to 2.5% to 3.0% in the early 2000s.
As shown in Figure 3, reported CDI values have followed the general trend of the increase in FHLB rates. However, the averages should be taken with a grain of salt. The chart is provided to illustrate the general directional trend in value as opposed to being predictive of specific indications of CDI value due the following factors:
- The September 17th Federal Reserve rate cut is not reflected in the data above. While the impact on CDI values of one 25 basis point reduction in the Fed Funds target rate may not be highly material—given that the forward rate curve has anticipated falling short-term interest rates for some time—continued reductions in the Fed Funds target rate or downward shifts in the yield curve may result in a larger decline in CDI values.
- General market averages do not reflect the individual characteristics of a particular subject’s deposit base.
- Most of the values presented above reflect the estimated core deposit intangible value at deal announcement, rather than the final core deposit intangible value as determined post-closing. Additionally, the quantity of transactions with known core deposit intangible value is fairly low for many periods. In the fourth quarter of 2024, for example, no transactions occurred with a disclosed core deposit intangible value.
Forty-four deals were announced in July, August, and the first half of September, and 13 of those deals provided either investor presentations or earnings calls containing CDI estimates. Excluding two outliers with an average estimated CDI value of 1.3%, these CDI estimates ranged from 2.0% to 3.9% with an average of 3.0%. However, the CDI premiums cited in investor presentations can be somewhat difficult to compare, as acquirers may use different definitions of core deposits when calculating the CDI premiums reported to investors. For example, some acquirers may include CDs in the calculation, while other buyers may exclude CDs or include only certain types of CDs.
Generally, we expect CDI values to fall in concert with falling market interest rates. How fast they decline could depend on several factors:
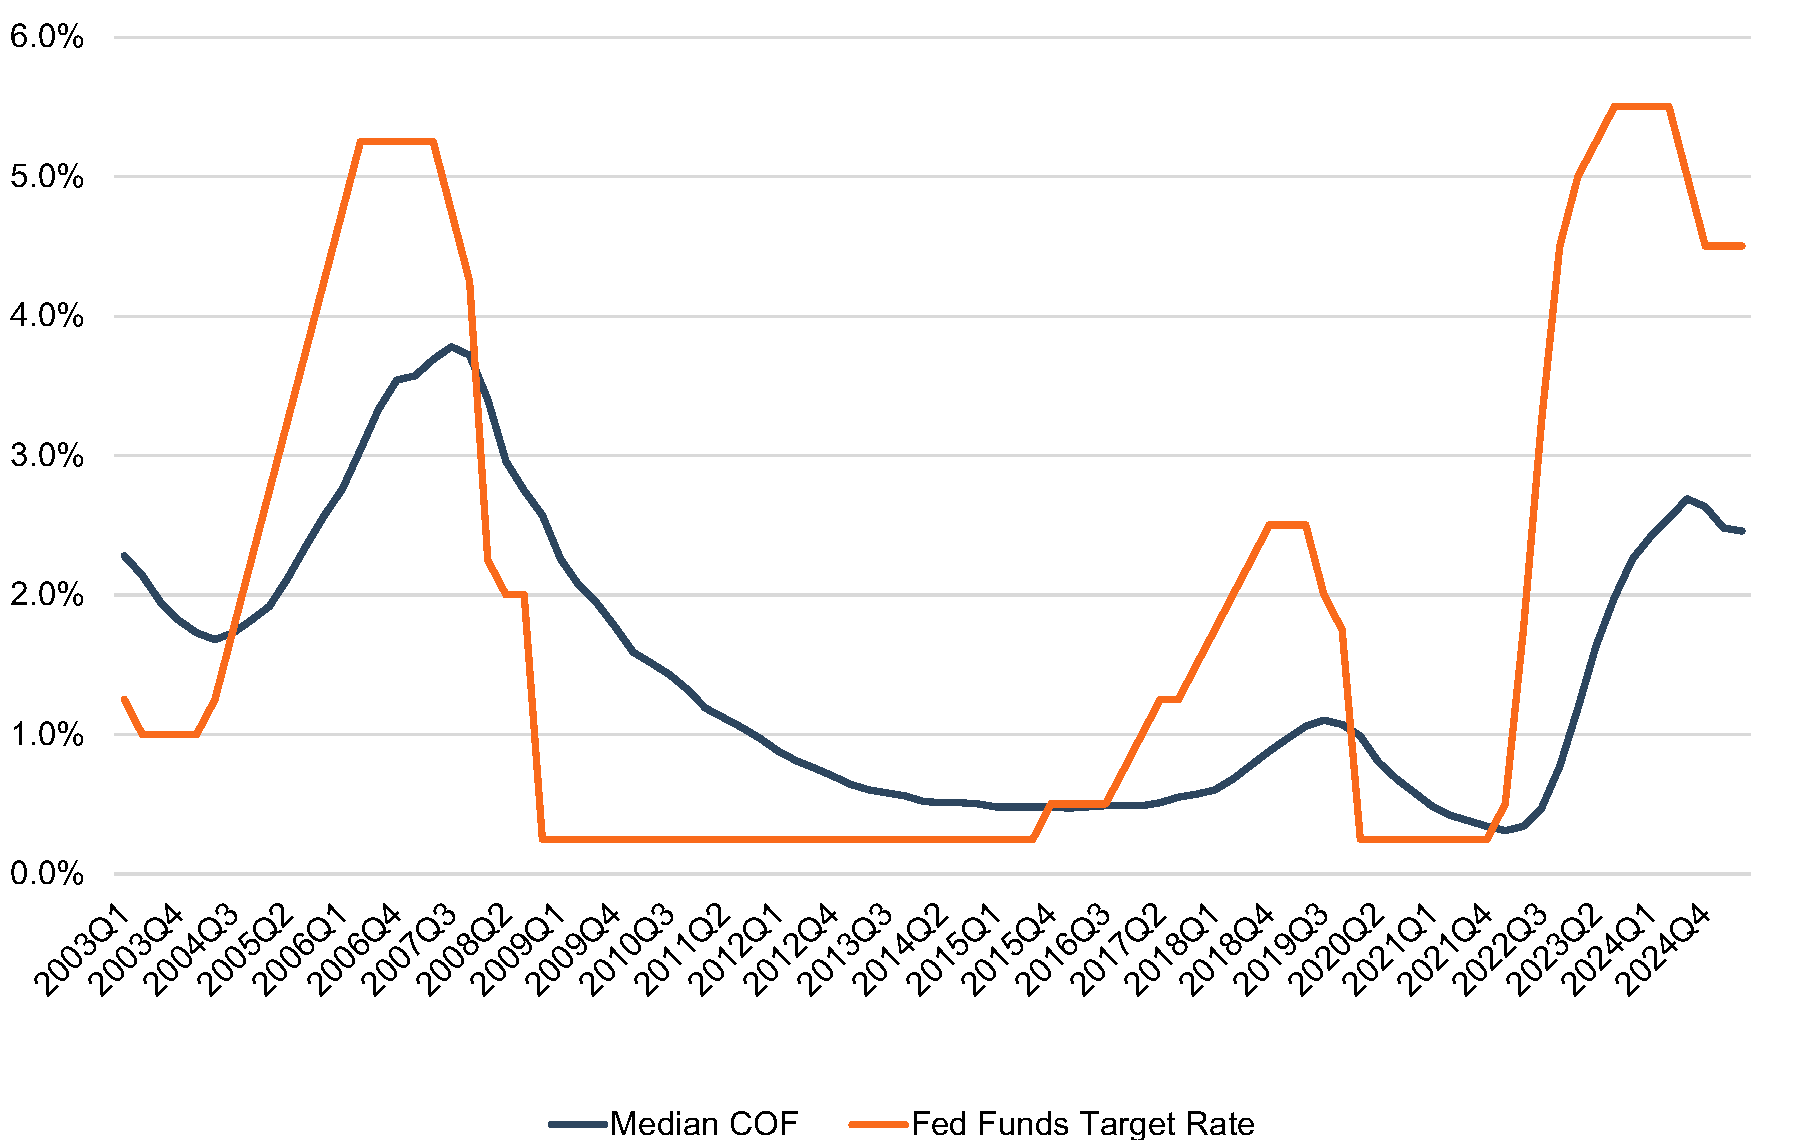
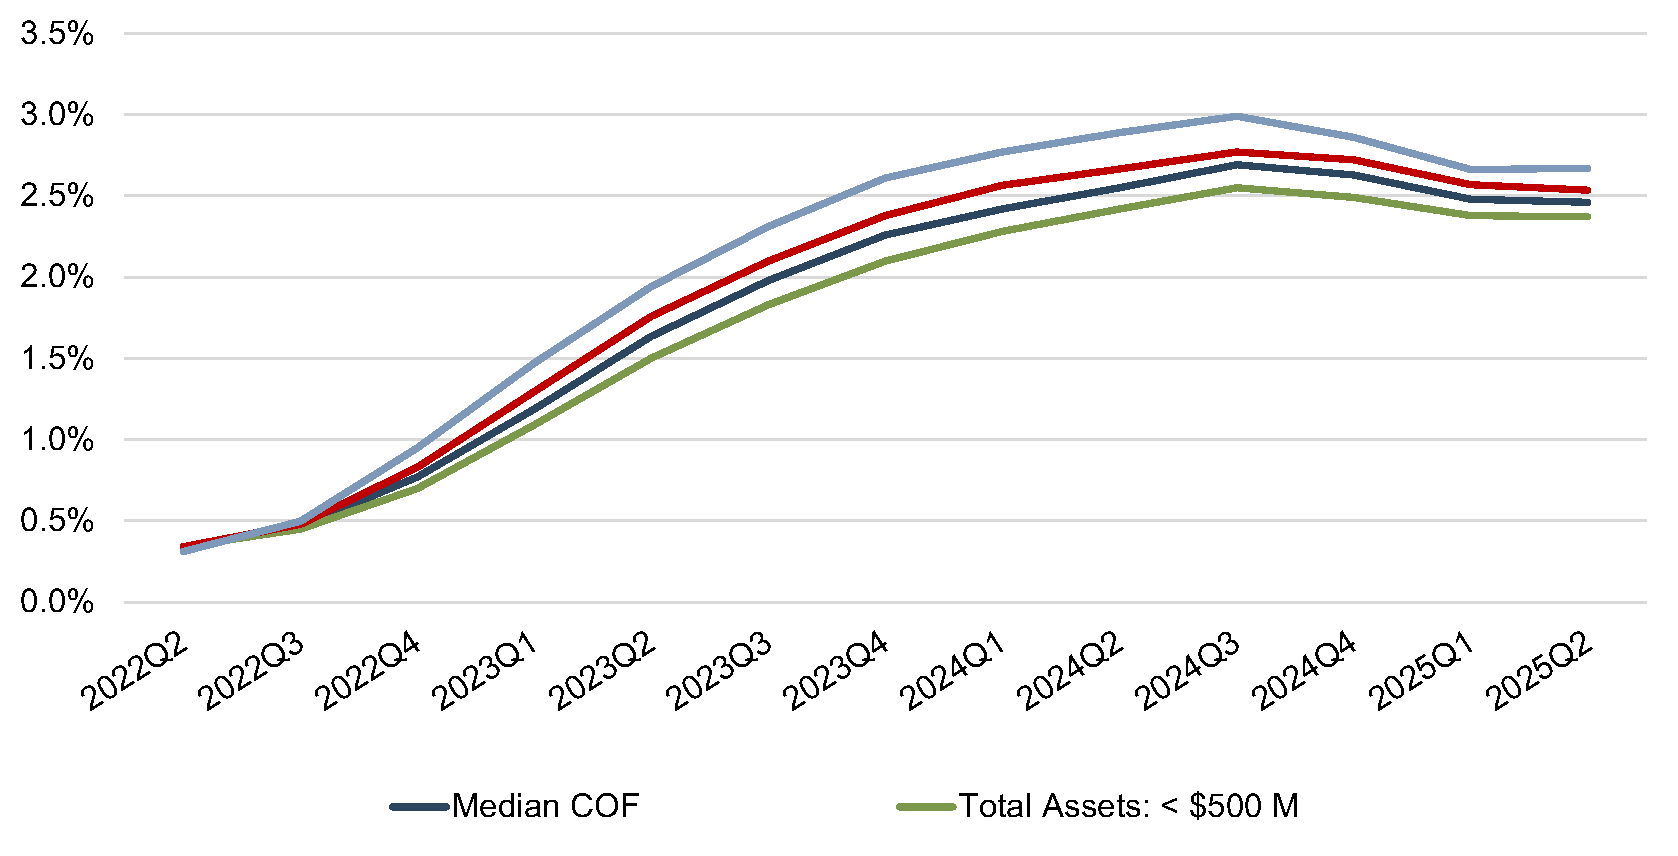
- Cost of Funds. Last year at this time, we expected that notifications of lower rates would trigger some depositors, who had become accustomed to higher rates, to seek alternatives. This would potentially limit a financial institution’s desire to reduce deposit rates given the need to preserve deposit balances. To the extent that a customer is particularly rate-sensitive, that account movement has likely already taken place, so there might be more room for downward movement in deposit rates. As shown on Figure 4, in falling rate environments, the median cost of funds has tended to decrease at a slower rate than the Fed Funds target rate. However, interest rate beta is in part determined by the size of the financial institution, as evidenced by Figure 5.
Figure 4 :: Median Cost of Funds as Compared to Target Federal Funds Rate
 Source: S&P Global Market Intelligence Cap IQ Pro
Figure 5 :: Cost of Funds by Asset Size – 2Q22 to 2Q25
 Source: S&P Global Market Intelligence Cap IQ Pro
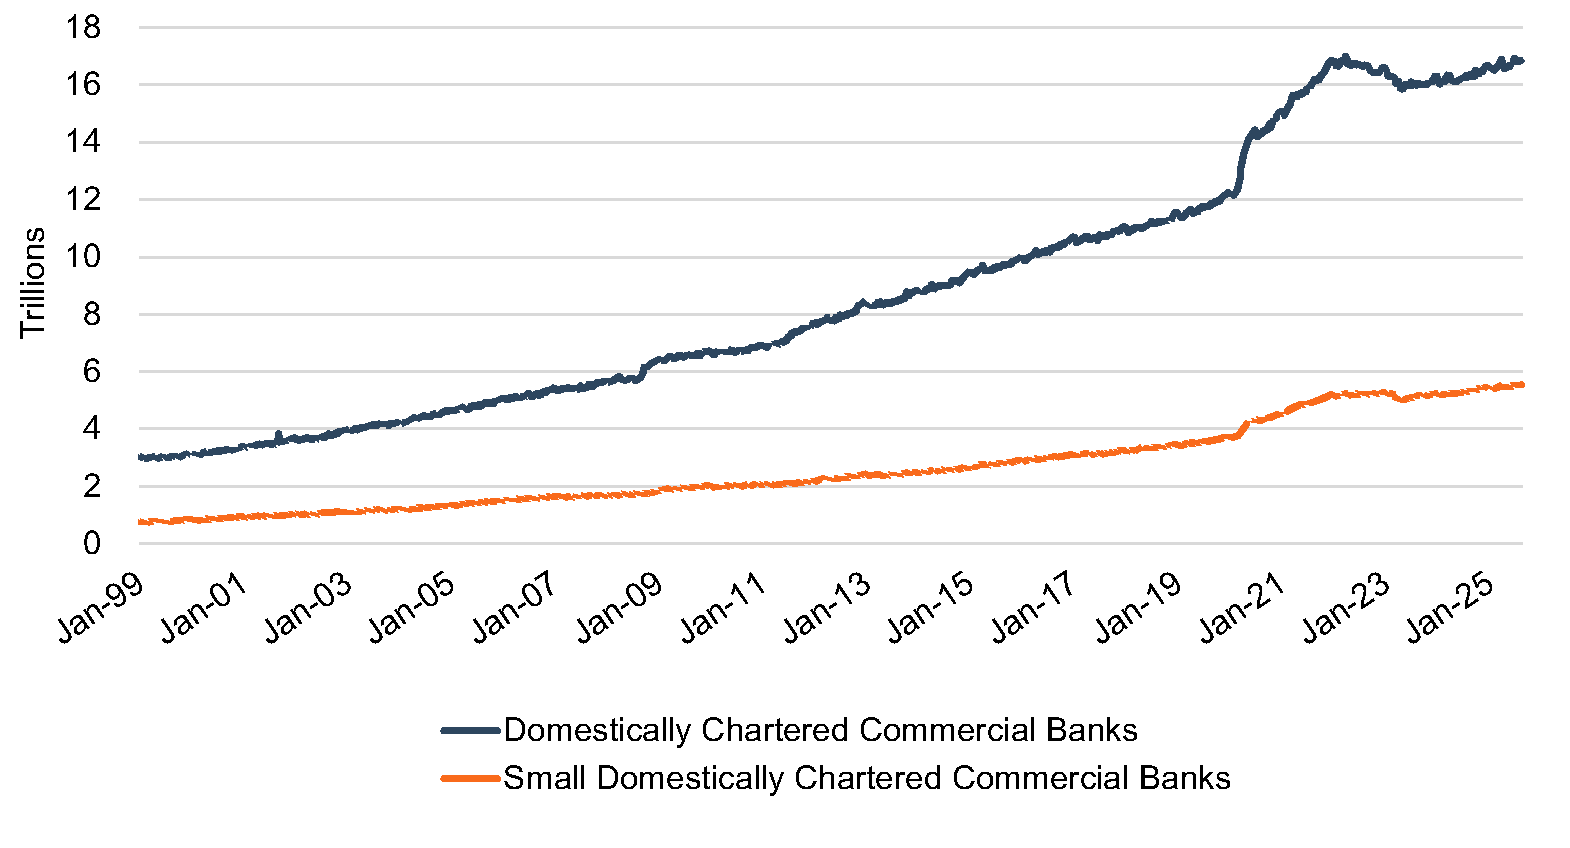
Figure 6 :: Total Industry Deposits Per Federal Reserve H.8 Release
 Source: S&P Global Market Intelligence Cap IQ Pro
- Deposit Levels. In 2022, total industry deposits fell 1.1%, the largest annual decline on record. Last year at this time, approximately half of respondents expected their organization’s deposits to increase between 1% to 5% over the next 12 months. This compares to the actual annual increase of 2.27% experienced by commercial banks during 2024. However, in the first and second quarters of 2025, deposits only increased modestly. In the same survey for the second quarter of 2025, over 80% of bankers expect deposits to grow over the next twelve months. All else equal, lower deposit runoff assumptions lead to higher indications of CDI value.
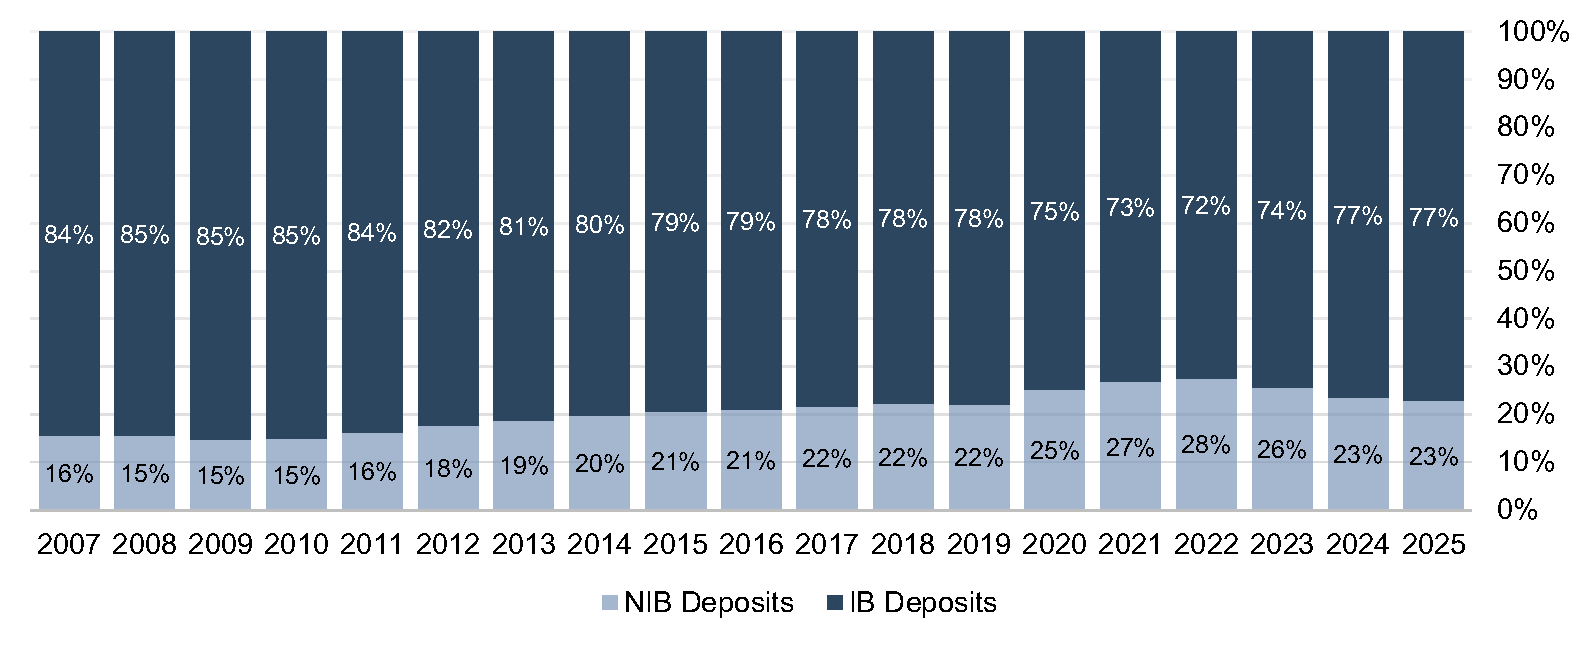
- Deposit Mix and Deposit Beta. Over the decade leading up to 2023, nationwide average deposit mix shifted in favor of noninterest bearing deposits. In 2023 through 2025, this trend began to reverse in a higher interest rate environment. However, the deposit mix shift toward interest bearing deposits might not continue in a falling interest rate environment. As noninterest-bearing deposits have higher CDI values, this could be a mitigating factor for the anticipated decline in CDI values.
- Uncertain Rate Outlook. The expectation is for lower rates, but the FOMC expressed concern related to both inflation and payroll data at the most recent meeting. The balancing act required to promote economic growth while mitigating inflationary pressures creates a murky view of the rate environment over the next couple of years.
Figure 7:: Deposit Mix Over Time
 Source: S&P Global Market Intelligence Cap IQ Pro
Trends In Deposit Premiums Relative To CDI Asset Values
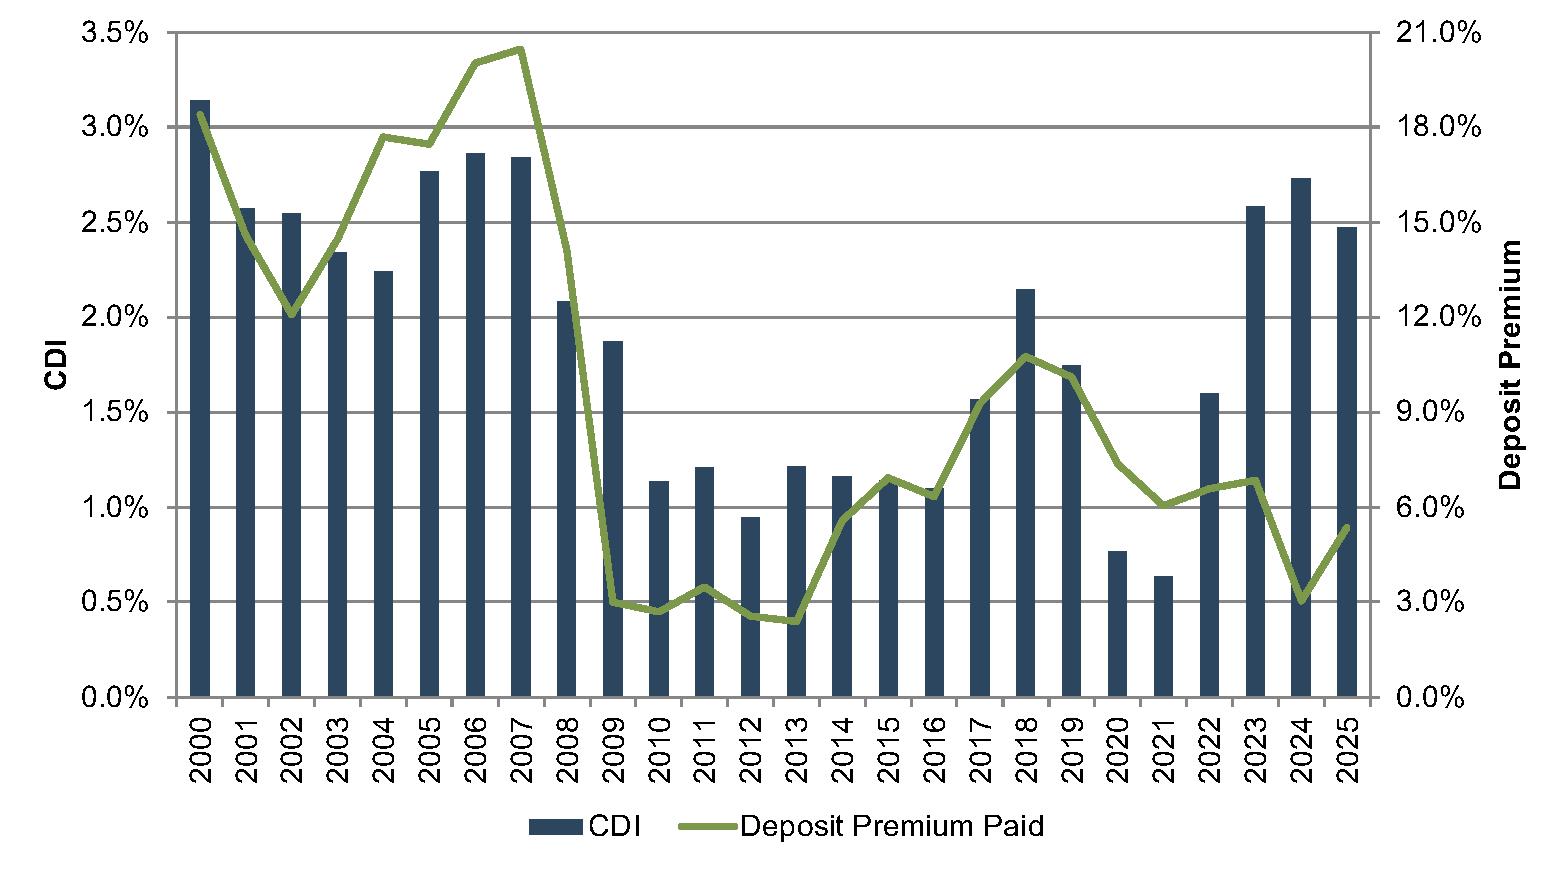
Core deposit intangible assets are related to, but not identical to, deposit premiums paid in acquisitions. While CDI assets are an intangible asset recorded in acquisitions to capture the value of the customer relationships the deposits represent, deposit premiums paid are a function of the purchase price of an acquisition. Deposit premiums in whole bank acquisitions are computed based on the excess of the purchase price over the target’s tangible book value, as a percentage of the core deposit base.
While deposit premiums often capture the value to the acquirer of assuming the established funding source of the core deposit base (that is, the value of the deposit franchise), the purchase price also reflects factors unrelated to the deposit base, such as the quality of the acquired loan portfolio, unique synergy opportunities anticipated by the acquirer, etc. As shown in Figure 8, deposit premiums paid in whole bank acquisitions have shown more volatility than CDI values. Deposit premiums were in the range of 6% to 10% from 2015 to 2023, although this remained well below the pre-Great Recession levels when premiums for whole bank acquisitions averaged closer to 20%. Net interest margin pressure—caused by assets originated at low rates during the pandemic and deposits that proved more rate sensitive than expected—resulted in deposit premiums in 2024 falling to levels last seen in the Great Financial Crisis. That is, low cost core deposits proved valuable in 2024, but CDI values in whole bank transactions were diminished by mark-to-market adjustments on the asset side of the balance sheet, which also resulted from the higher rate environment. In 2025, net interest margin pressure has subsided, and deposit premiums have increased.
Figure 8 :: CDI Recorded vs. Deposit Premiums Paid
 Source: S&P Global Market Intelligence Cap IQ Pro
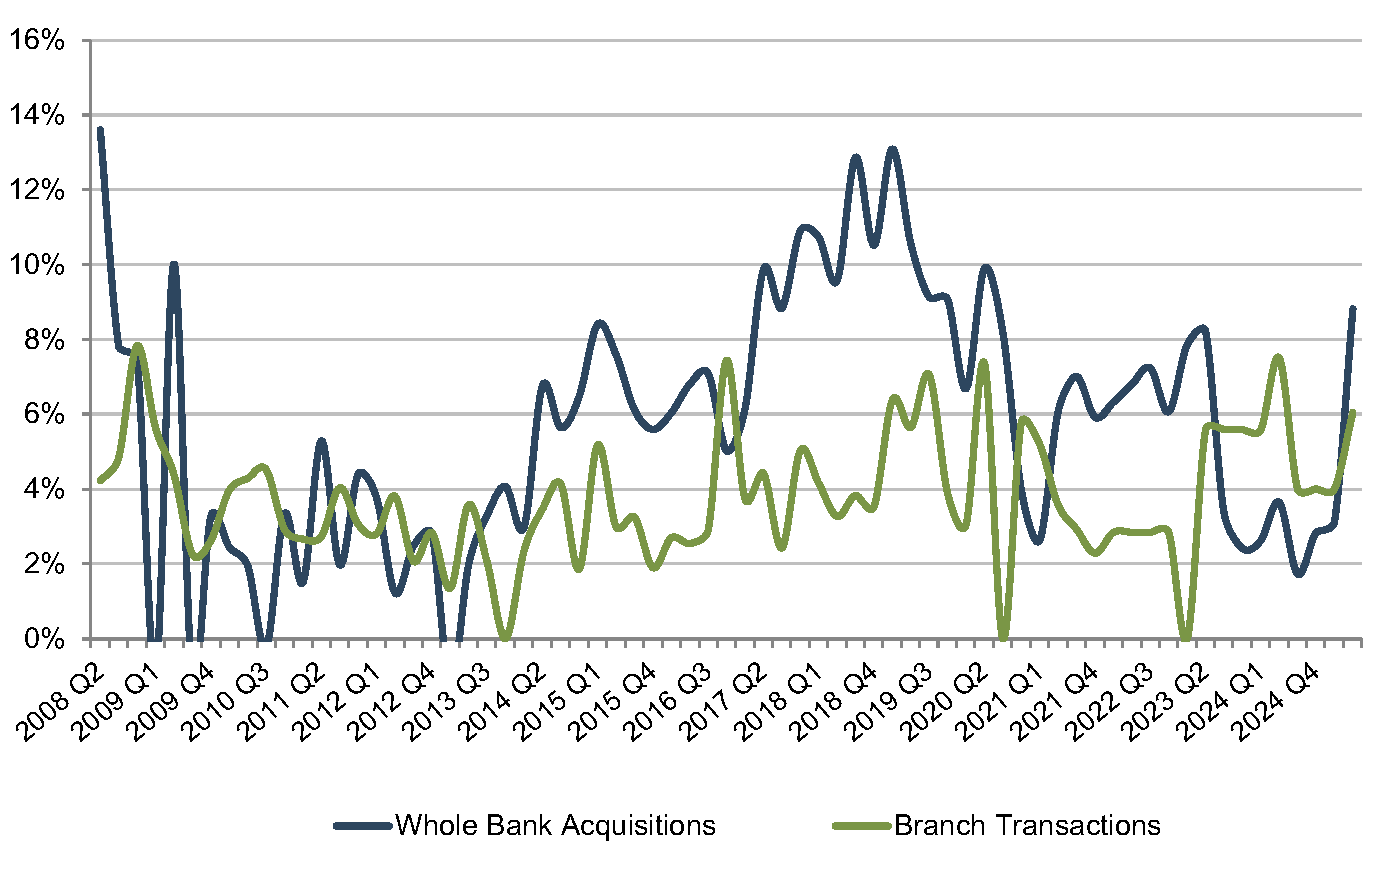
Additional factors may influence the purchase price to an extent that the calculated deposit premium doesn’t necessarily bear a strong relationship to the value of the core deposit base to the acquirer. This influence is often less relevant in branch transactions where the deposit base is the primary driver of the transaction and the relationship between the purchase price and the deposit base is more direct. Figure 9, on the next page, presents deposit premiums paid in whole bank acquisitions as compared to premiums paid in branch transactions.
Figure 9 :: Average Deposit Premiums Paid
 Source: S&P Global Market Intelligence Cap IQ Pro
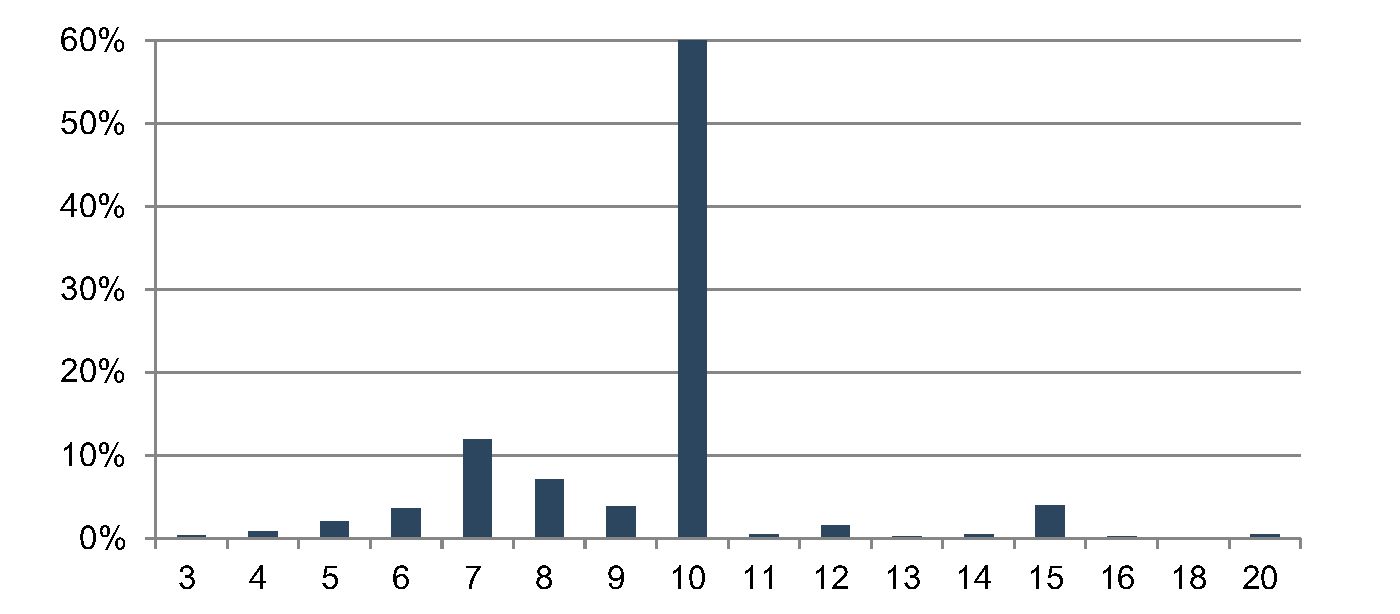
Figure 10 :: Selected Amortization Term (Years)
 Source: S&P Global Market Intelligence Cap IQ Pro
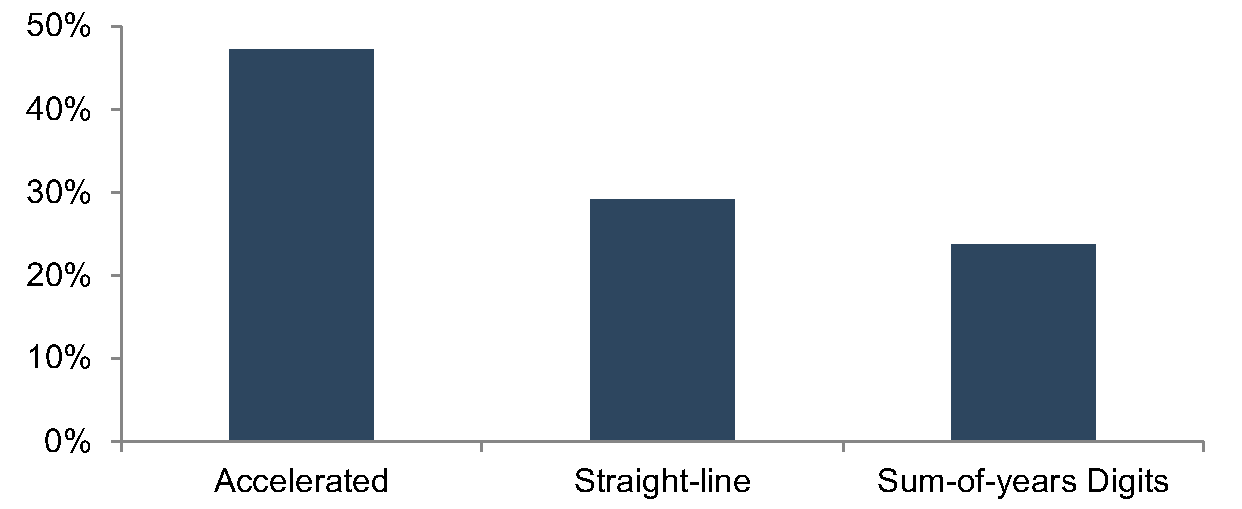
Figure 11 :: Selected Amortization Method
Source: S&P Global Market Intelligence Cap IQ Pro
Deposit premiums paid in branch transactions have generally been less volatile than tangible book value premiums paid in whole bank acquisitions. Only three branch transactions with reported premium data have occurred year-to-date in 2025. For those transactions, the deposit premiums were 7.0%, 4.6%, and 7.5%. The same number of branch transactions with reported premium data occurred in 2024, and the premiums were similar. The lack of branch transactions, though, is indicative of their value. With high short-term funding costs and tight liquidity, few banks have been willing to part with stable, low cost core deposits.
Accounting For CDI Assets
Based on the data for acquisitions for which core deposit intangible detail was reported, a majority of banks selected a ten-year amortization term for the CDI values booked. Less than 10% of transactions for which data was available selected amortization terms longer than ten years. Amortization methods were somewhat more varied, but an accelerated amortization method, including the sum-of-the-years digits method, was selected in approximately two-thirds of these transactions.
Conclusion
Core deposit intangible values are influenced by many factors, and each institution’s deposit base is unique. Mercer Capital has deep experience analyzing CDI values and advising financial institutions in transactions and strategic decisions. Contact us to discuss how we can help your organization navigate these trends.
The Discount for Lack of Marketability in Divorce: When Should It Apply? – Part 1
During divorce proceedings, one of the most complex financial issues may be “what is the value of a business interest?” When the business is the single largest asset on the marital balance sheet, the complexities for division and income may be even larger. This is where business valuation experts assist the process. For non-controlling business interests, two of the significant debated valuation adjustments are the discount for lack of marketability (“DLOM”) and the discount for lack of control (“DLOC”, or together, “valuation discounts”). Whether valuation discounts apply depends not only on the facts and circumstances but also on the state laws where the divorce is filed.
What is a DLOM?
Simply put, a discount for lack of marketability reflects the concept that a business interest that cannot be readily sold is worth less than an investment that can be freely traded, like shares in a publicly traded stock.
By illustration: if you own 100 shares of Apple stock, you can sell them today with the click of a button. But if you own 25% of a family-owned construction company, finding a buyer for that 25% minority interest can be much more complicated. You may be subject to approvals or rights of first refusal by other owners, among other attributes or restrictions, that preclude swiftly selling your interests. The lack of a ready market reduces the attractiveness of the investment, and thus its value.
In business valuation, experts often apply a DLOM when valuing non-controlling interests in private companies. That is because majority stakes in private companies can often exercise some level of control to achieve liquidity. It is important for a business valuation expert to understand the company’s governance structure, among other considerations, and how that influences the marketability of the subject interest and therefore its valuation. As there is a range of possible discounts, the analyst reviews and analyzes various qualitative and quantitative attributes to support his/her concluded valuation discount(s).
Not all business valuation experts have experience valuing subject interests that are subject to minority and marketability discounts. These discounts are applicable in valuation scopes like transactions, shareholder matters, and estate/tax valuations. Fifteen years ago, the IRS published the Discount for Lack of Marketability Job Aid for IRS Valuation Professionals, which defined the DLOM, discussed the benefits and drawbacks of available methodologies at the time, and generally provided a framework for professionals when valuing for gift and estate tax purposes.
Some practitioners may bifurcate the various negative valuation influences of a discount for lack of control (such as the ability to compel a sale or dividends) rather than marketability. While this can be reasonably defended, it is important that practitioners do not double-count the same negative consequence in both a DLOC and DLOM, and some practitioners prefer to capture all of this in a single DLOM that considers all the factors.
Fair Value vs. Fair Market Value
The standard of value applied in a divorce valuation has ramifications, as seemingly identical terms have different implications. The specific definition for each term can vary depending on the context and the standard-setter or regulatory authority. Below, we provide definitions and explain how each standard of value impacts the applicability of a DLOM.
- Fair Market Value (“FMV”) can be defined as “the price at which the subject interest would change hands between a willing buyer and a willing seller when the former is not under any compulsion to buy and the latter is not under any compulsion to sell, both parties having reasonable knowledge of the relevant facts” (IRS Revenue Ruling 59-60, 1959-1 C.B. 237, Section 2.02). It is important to understand that under fair market value, the buyers and sellers are hypothetical parties and not the actual parties that own an interest.
Under the fair market value standard, valuation discounts are often considered because the discounted value reflects what an outside investor would likely pay. All else equal, prospective buyers of a minority interest want to be compensated for the uncertainty surrounding their future ability to sell that interest. - Fair Value (“FV”) can be defined as “the price that would be received to sell an asset or paid to transfer a liability in an orderly transaction between market participants at the measurement date” (FASB ASC 820). In many jurisdictions, fair value is used in shareholder disputes and family law. Under this standard, courts frequently limit or even prohibit valuation discounts, reasoning that such discounts penalize the spouse who is not retaining the business interest.
Whether a state uses fair market value or fair value may determine whether valuation discounts are applicable in divorce. We note, however, that some states may have their own versions and/or definitions based on interpretation that do not directly correlate to the above definitions.
Examples of Jurisdictions That Allow (and Don’t Allow) a DLOM
It is important to understand the relevant statutes in the local jurisdiction, as states differ in their approach.
- New Jersey (No DLOM in Divorce): New Jersey courts have consistently rejected the application of a DLOM in marital dissolution cases. In Brown v. Brown (348 N.J. Super. 466, 2002), the Court held that applying such a discount would unfairly reduce the non-owner spouse’s equitable share. Because the business owner is not actually selling the interest, marketability is not deemed a real issue in the divorce context.
- Florida (DLOM Can Apply): In contrast, Florida courts have permitted DLOMs in some divorce valuations because the valuation should reflect the real-world limitations of a privately held business interest, even if no actual sale is taking place. From this perspective, ignoring the discount for lack of marketability inflates value beyond what the market would bear.
These examples show the importance of state statutes (or judicial interpretation of those statues). Two otherwise identical divorces can have very different outcomes depending on where they are filed. Furthermore, many cases are settled outside of the courts, and outside of any appeals process, providing further nuances to current considerations.
The Argument Supporting Application of a DLOM
Proponents of applying a DLOM in divorce assert that valuations should reflect economic reality. If a 25% stake in a private company couldn’t realistically be sold for “full” pro rata value in the open market, why should it be valued that way in a divorce?
From this perspective, not applying a DLOM creates an inflated conclusion of value that does not reflect the true financial worth of the marital interest. This could leave the owner-spouse saddled with an obligation (such as a buyout or cash settlement) based on an unrealistic valuation conclusion. A DLOM recognizes that private company stock isn’t as liquid as public stock.
The Argument Against Application of a DLOM
On the other hand, some assert that applying a DLOM unfairly harms the non-owner spouse. In most divorce cases, the owner isn’t actually selling the business interest. Instead, they continue to run the company and benefit from its cash flow.
Applying a DLOM in this situation results in a lower valuation and less economic benefit for the non-owner spouse. This may be especially problematic in cases where the business is the family’s largest marital asset. The underlying point of contention is: Why should the non-owner spouse bear a discount for a problem (marketability) that doesn’t actually exist in the divorce context? In other words, why assume a hypothetical sale when no such sale is contemplated?
Conclusion
In part 2, we will provide examples that demonstrate the real-world considerations that practitioners face in valuing non-controlling business interests in divorce.
Relative Total Shareholder Return Compensation
Trends, Challenges, and Valuation Considerations
Executive Summary
Relative total shareholder return (TSR) has become a central metric in long-term incentive plans, particularly for aligning executive compensation with shareholder outcomes. As companies navigate market volatility and evolving governance standards, a clear understanding of relative TSR-based awards is essential for effective plan design and regulatory compliance.
Definition and Mechanics
Relative TSR compensation typically involves performance-based equity awards—such as performance stock units (PSUs) or restricted stock units (RSUs)—that vest or pay out based on a company’s TSR performance relative to a defined peer group or market index over a specified period, commonly three years. TSR reflects stock price appreciation plus reinvested dividends, offering a comprehensive measure of shareholder value creation.
Unlike absolute TSR, which evaluates a company’s standalone performance, relative TSR benchmarks performance against peers. This structure is intended to reward outperformance regardless of broader market conditions. For example, executives may earn 150-200% of the target award for top-quartile performance, while below-median results may result in no payout. Under ASC 718, these awards are classified as market-condition grants, requiring fair value measurement at the grant date without subsequent adjustment for performance outcomes. Common design features include interpolation between performance thresholds, discrete payout levels, and caps for negative absolute TSR. As we have previously discussed, new proxy disclosure rules implemented in 2022 brought greater attention to these types of plans and awards.
Adoption Trends
Relative TSR has seen widespread adoption among U.S. public companies. In 2024, over 70% of S&P 500 companies granted PSUs tied to relative TSR, a significant increase from prior decades. Some companies also use hybrid models that combine TSR with financial metrics such as earnings per share (EPS) or return on invested capital (ROIC). Adoption rates among smaller companies remain lower (40–50%), often due to challenges in peer group selection and valuation.
For a summary of the changes and SEC commentary following the first year of pay versus performance on relative TSR plans, see our prior article on the topic.
Implementation Challenges
Despite its advantages, relative TSR presents several design and operational challenges:
- Peer Group Selection: Identifying appropriate comparable companies is complex and subject to scrutiny. Differences in industry, size, or business model can distort outcomes. Peer group changes due to mergers, acquisitions, or delistings require ongoing updates.
- Market Sensitivity: TSR can be affected by external factors beyond management’s control. High relative rankings may occur despite negative absolute returns, raising concerns about fairness.
- Negative TSR Caps: Without caps, awards may vest at high levels even when shareholders experience losses. Many plans now include caps (e.g., limiting payouts to 100% if TSR is negative).
- Accounting and Disclosure: ASC 718 prescribes grant-date fair value recognition, which
typically requires the use of Monte Carlo simulation. Disclosure complexity and potential SEC scrutiny may add to the administrative burden. - Proxy and Shareholder Oversight: Poorly designed plans may face negative say-on-pay votes. Proxy advisors penalize plans with low rigor or excessive payouts, prompting companies to enhance design robustness.
Valuation Considerations
Valuing relative TSR awards typically involves Monte Carlo simulation, which models thousands of potential stock price paths for the company and its peers. This method incorporates volatility, correlation, and dividend assumptions to estimate fair value at grant.
Key steps include:
- Input Collection: Gather historical stock returns, risk-free rates, and peer correlations.
- Simulation: Project stock paths using stochastic models such as geometric Brownian motion.
- Payout Calculation: Determine TSR rankings for each path and apply the plan’s payout scale.
- Fair Value Estimation: Calculate the average discounted payout across simulations to determine fair value.
- Tests of Reasonableness: Sensitivity analyses are often used to assess the impact of changes in key assumptions.
U.S. GAAP (ASC 718) requires Monte Carlo simulation for awards with market conditions, especially when payout structures are non-linear or include caps. Monte Carlo simulation requires technical expertise to implement, and inaccurate inputs or flawed modeling can lead to distorted compensation expense and misleading proxy disclosures.
Implications and Key Takeaways
Relative TSR remains a widely adopted mechanism for aligning executive pay with shareholder outcomes. Its effectiveness depends on thoughtful plan design, including:
- Selecting relevant and stable peer groups
- Incorporating safeguards such as caps on negative TSR
- Applying robust valuation methodologies
As market conditions evolve, companies should regularly review and adjust their compensation frameworks to maintain alignment with governance expectations and shareholder interests.
How Mercer Capital Can Support
Mercer Capital provides specialized valuation services for equity-based compensation, including relative TSR awards under ASC 718. Our team offers independent fair value assessments, Monte Carlo simulations, and strategic guidance on plan design and peer benchmarking. Contact Mercer Capital to learn how we can support your financial reporting and executive compensation strategies.
Navigating Business Valuations During Active M&A Processes: Critical Considerations for Estate Planners
Executive Summary
This article summarizes Mercer Capital’s whitepaper, Valuing a Business for Estate Planning Purposes During a Transaction, which addresses the complex intersection of business valuations and estate planning when M&A processes are underway.
Estate planning for business owners becomes much more complicated when a merger or acquisition process is underway. IRS guidance suggests requirements that business valuations for transfer tax purposes must consider all knowable facts as of the valuation date—including pending transaction processes. This creates both opportunities and risks for estate planners working with clients who own businesses actively engaged in sale discussions.
The challenge lies in determining how much weight to assign to potential deal proceeds versus traditional standalone valuations at different stages of the M&A process. While early-stage processes may warrant minimal consideration of transaction value, later stages with formal offers require greater weighting of expected proceeds. Understanding the nuances of an engagement of this type is essential for avoiding costly mistakes and ensuring credible valuations that optimize estate planning outcomes.
The intersection of business transactions and estate planning presents one of the most complex challenges in wealth transfer strategies. When business owners—whose enterprises often represent the majority of their wealth—simultaneously pursue exit opportunities and engage in estate planning, the valuation considerations become particularly intricate and consequential.
IRS Chief Counsel Advice 202152018
In Chief Counsel Advice 202152018 (“CCA 202152018”), the IRS addressed two issues in the context of a business owner who funded a GRAT during an active sale process. First, it considered whether hypothetical willing buyers and sellers would take into account a pending merger when valuing stock for gift tax purposes. The Service answered affirmatively: under the fair market value standard, known or knowable facts—including an ongoing sale process and offers already received—must be incorporated into valuation. Second, the IRS considered whether the donor retained a “qualified annuity interest” under §2702 when the GRAT was funded using a stale §409A appraisal that ignored the pending merger. The Service held that the retained interest failed to qualify, treating the entire transfer to the GRAT as a taxable gift.
The facts of the case reveal a pattern of valuation inconsistencies. The taxpayer used a seven-month-old §409A appraisal—prepared for deferred compensation purposes, not transfer tax purposes—to support the GRAT funding, even though multiple offers had already been received at higher prices. Shortly thereafter, however, the same taxpayer funded a charitable remainder trust using a contemporaneous qualified appraisal that reflected the higher offer price. This inconsistency, coupled with reliance on an outdated and contextually inappropriate appraisal, invited IRS scrutiny and resulted in the Service’s determination that the GRAT was fatally flawed.
While CCAs do not carry precedential weight, they are instructive of how the IRS is likely to approach similar fact patterns. CCA 202152018 signals heightened IRS vigilance where GRATs or other transfer tax strategies are executed amidst an ongoing or foreseeable liquidity event. It highlights the necessity of contemporaneous, purpose-appropriate appraisals that consider all relevant facts at the valuation date. Failure to do so risks not only valuation adjustments but also possible disqualification of retained interests under §2702, leading to the result of treating the entire transfer as a taxable gift.
Understanding the M&A Process Framework
To properly value businesses during transaction processes, estate planners must understand the typical stages of mergers and acquisitions. The process generally unfolds through six distinct phases, each presenting different levels of transaction certainty and information availability.
During the planning phase, when owners hire M&A advisors and organize information, there may be little quantifiable expectation of proceeds. However, once confidential information memorandums are distributed to potential buyers, expectations around selling prices become clearer. As the process progresses through qualification phases with indications of interest, buyer selection with letters of intent, due diligence, and final negotiations, the probability of completion and the certainty of proceed size generally increase.
The critical insight for estate planners is that valuation weight should shift toward transaction proceeds as deal certainty increases. A business in early marketing phases might warrant only modest consideration of potential proceeds, while a company with binding letters of intent is more likely to merit substantial weighting of expected transaction value.
Market Reality of Deal Success and Failure
Understanding transaction success rates provides crucial context for valuation decisions. In a McKinsey & Company analysis of over 2,500 large deals valued above €1 billion, approximately 10.5% of deals were canceled, with larger transactions facing higher failure risks. Deals exceeding €10 billion experienced cancellation rates above 20%, while those under €5 billion maintained consistent 10% annual cancellation rates.
In this analysis, industry factors significantly impacted success probability. Energy and financial sector deals showed the lowest cancellation rates at around 7%, while consumer discretionary and communications services faced higher failure rates of 13% and 19% respectively. Nearly 75% of canceled deals failed due to price expectations, regulatory concerns, or political issues.
However, these statistics apply primarily to publicly announced transactions, making them most relevant for closely held companies in later deal stages. Earlier-phase failures often remain private, suggesting estate planners should shift weight toward no-sale scenarios when businesses are in preliminary transaction stages.
Critical Success Factors
Several factors influence deal completion probability and should inform valuation weightings. Expected deal timelines matter significantly—longer processes face higher failure rates. Deal structure complexity creates additional risk, as mixed cash-and-stock transactions prove less successful than simpler all-cash or all-stock arrangements.
The number and quality of bidders affect completion likelihood. Multiple interested parties provide fallback options, though this dynamic can shift if secondary bidders lose interest. More sophisticated bidders, such as private equity firms or strategic acquirers with dedicated M&A teams, typically conduct more thorough early evaluation but also identify issues that might derail transactions.
External factors including economic conditions, political stability, and regulatory environment all influence completion probability. Companies with clean financial records, predictable cash flows, and minimal discretionary items in recent results face higher completion probabilities due to reduced due diligence risks.
The Levels of Value
Business owners and their professional advisors are occasionally perplexed by the fact that their shares can have more than one value. This multiplicity of values is not a conjuring trick on the part of business valuation experts, but simply reflects the economic fact that different markets, different investors, and different expectations necessarily lead to different values.
Business valuation experts use the term “level of value” to refer to these differing perspectives. As shown in the figure below, there are three basic “levels” of value for a business.
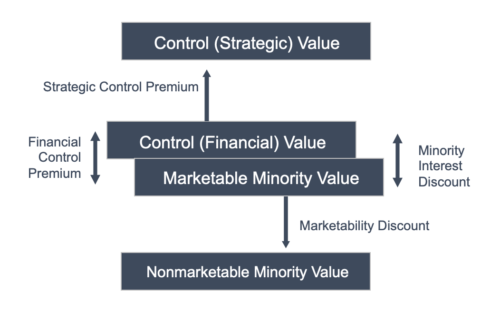
Estate planning transfers typically involve minority interests valued at the nonmarketable minority level, which may incorporate discounts for lack of control and marketability. In contrast, M&A transactions occur at control levels and may include strategic premiums for synergies.
This creates significant value gaps. A business with $100 per share marketable minority value might be valued at $65 per share for estate planning purposes after appropriate discounts. However, strategic buyers might pay $130 per share, creating a substantial differential between transfer values and transaction proceeds.
Understanding Deal Proceeds
Expected transaction proceeds require careful analysis beyond headline multiples. Deal terms may include earn-outs, contingent payments, or non-cash consideration that should be risk-adjusted and converted to cash equivalency. The proposed transaction could trigger corporate-level taxes that would need to be considered in valuing an equity interest. A transaction appearing to price at 12x EBITDA might only deliver 9x value on a cash-equivalent basis after considering payment timing, corporate taxes, and performance risks.
Practical Application Framework
Estate planners working with businesses in transaction processes should expect valuation frameworks that appropriately weight no-sale scenarios against expected proceeds based on process stage and specific circumstances.
As transaction processes progress through marketing phases with distributed information memorandums, modest weighting of expected proceeds becomes appropriate, though determining precise allocations requires careful analysis of company-specific factors and buyer interest levels.
Once formal indications of interest are received, increasing weight is likely to shift toward transaction proceeds, with the specific allocation depending on offer quality, buyer sophistication, and deal structure. By the time binding letters of intent are executed, substantial weighting of expected proceeds is typically warranted, though some consideration of failure scenarios remains appropriate until closing occurs.
Compliance and Documentation Requirements
The IRS guidance emphasizes that valuations should ideally use valuation dates matching transfer dates and consider all knowable facts. Using outdated appraisals prepared for other purposes creates significant compliance risks, particularly when those appraisals ignore ongoing transaction processes. Business appraisers should document their consideration of transaction processes and provide clear rationale for their weighting decisions.
Strategic Implications for Estate Planning
Understanding these dynamics enables more effective estate planning strategies. Business owners contemplating both exit strategies and wealth transfer can time their planning to optimize valuations while maintaining compliance. Earlier transfers in transaction processes may capture lower valuations, though this must be balanced against deal completion risks and the potential for significant value increases.
The complexity of these valuations underscores the importance of engaging qualified professionals who understand both IRS transfer tax requirements and M&A market dynamics. Estate planners need valuation specialists who can navigate the technical requirements while providing credible opinions that optimize client outcomes.
Conclusion
The intersection of business transactions and estate planning presents both opportunities and pitfalls for wealth transfer strategies.
Success in this complex environment requires understanding M&A process stages, deal success factors, valuation methodologies, and compliance requirements. Estate planners who understand these concepts can help business owners navigate simultaneous exit and wealth transfer strategies while avoiding the costly mistakes that have drawn IRS scrutiny.
The stakes are significant—business interests often represent the majority of owner wealth, making proper valuation essential for effective estate planning. With careful planning, appropriate professional guidance, and an understanding of regulatory guidance, these complex situations can be managed successfully to achieve both transaction and estate planning objectives.
With 40+ years of transfer tax valuation and M&A experience, Mercer Capital understands the complexities that arise when business transactions intersect with estate planning objectives. Our team of credentialed professionals has worked with numerous clients through these challenging scenarios, providing the expertise necessary for these engagements.
For estate planners seeking experienced partners who can navigate the intricate requirements of valuing businesses during active transaction processes, Mercer Capital offers the depth of experience and technical proficiency that these engagements demand.
Download Full Whitepaper
Rollover Equity in Private Equity Transactions
In the U.S. middle market, rollover equity has become an integral piece of many private equity (PE) transaction consideration structures whereby the seller exchanges some or their equity interest in the acquiring entity.
From the buyer’s perspective, rollover equity helps finance a transaction and should secure the seller’s support on a go-forward basis. Sellers benefit through a mix of direct liquidity and future upside—the so-called “second bite of the apple”—often enhanced by deferred tax treatment of the rolled proceeds.
The use of rollover equity in middle market deals has become more prevalent in recent years. According to Goodwin’s Private Equity Deal Database, the inclusion of rollover equity in transactions valued between $25 million and $500 million rose from 46% in 2020 to 57% in 2023.
This uptick reflects both the financing pressures facing PE buyers and the desire for alignment of incentives between new owners and ongoing management teams. Practitioners caution, however, that valuation and structural nuances can materially affect economic outcomes. For instance, disparities between rollover equity and PE-sponsor securities—such as liquidation preferences or senior rights—must be carefully valued, typically using the option-pricing method (OPM) under ASC 805, and may warrant discounts for lack of marketability.
As rollover equity becomes more prevalent, both buyers and sellers must engage in diligence regarding valuation, capitalization table dynamics, and exit expectations to fully assess its long-term impact.
About Mercer Capital
Since 1982, Mercer Capital has offered M&A advisory services to a diverse range of public and private companies, leveraging extensive valuation and investment banking experience to guide clients through complex transactions. While our team provides objective advice, we also advocate for our clients while navigating the competitive marketplace of private equity groups, family offices, and strategic buyers. We facilitate informed decision-making with a tailored, multi-phased approach to planning and executing transactions. For confidential consultation on your transaction-related needs, contact us today.
ADDITIONAL RESOURCES
BLOG POST – Should You Accept Rollover Equity? | Road to Riches or “Worst Idea Ever”
ARTICLE – Calibrating or Reconciling Valuation Models to Transactions in a Company’s Equity
Understanding the Company Specific Risk Premium – A Component of the Discount Rate
When valuing a business using the income approach, one of the most significant inputs is the discount rate, which is used to discount future cash flows to present value. In this piece, we focus on one of the components of the discount rate: the company specific risk premium (“CSRP”).
For further detail about all of the components of the discount rate, see Mercer Capital’s article: Understand the Discount Rate Used in a Business Valuation.
CSRP is an additional premium that captures unique risks to the subject company, above and beyond market, industry, and size risks accounted for in the other ‘build-up’ components to developing a discount rate.
In simple terms, the CSRP captures the unique risk profile of the subject company. As the CSRP is specific to the company at hand, it can be subjective in nature – there is no direct observable market evidence, or data, that can be directly tied to one’s assumption, i.e. chosen premium. Therefore, in determining the CSRP, one should consider: What is the return required by investors to invest in the subject company over an alternative investment? Also, what are the qualitative elements of the business that reduce or increase risk – this could be strengths or weaknesses of the business, and even threats and/or opportunities for the business and its industry. The table below provides a few common factors and questions that may influence and support a CSRP assumption.
| Geographic Concentration |
|
| Customer/ Supplier Concentration |
|
| Competitive Environment |
|
| Earnings Volatility |
|
| Depth and Quality of Management |
|
| Key Person Risk |
|
| Operations |
|
| Technological Obsolescence |
|
Conclusion
There is no universal standard to estimating CSRP – each company has unique attributes and risks that are factored into the discount rate, among other areas in the business valuation analysis. Quantifying a CSRP requires a thorough understanding of the qualitative and quantitative factors that affect the subject company. Thus, a competent valuation expert is needed to ensure that the fundamentals of business valuation are applied in a reasonable and appropriate manner.
The 2025 Tariff Surge: Timeline and Industry Impact – part II
In the Q1 newsletter, we discussed the impact of the newly levied tariffs on the transportation sector. We focused on the main targets of the original tariffs (Canada, China, and Mexico) and the proposed removal of the De Minimis exemptions. These actions led to an increase in imports due to companies rushing to acquire inventory prior to the start of the tariffs, and speculation that inflation would be on the rise shortly after. Since Q1, the ever-evolving tariff landscape has created new implications for importers and exporters alike.
The second quarter’s tariff news started on April 2nd, when President Trump announced the levels of the previously proposed “reciprocal” tariffs. All imports would be subject to a base tariff of 10%, and various countries would have additional tariffs levels, ostensibly based on the trade deficit with each respective country. The European Union, South Korea, and Taiwan would be subject to tariffs of 20%, 25%, and 32%, respectively. Two days later, China would face a total tariff of over 50%. China announced a retaliatory 34% tariff on U.S. imports. The 10% baseline tariffs were scheduled to go into effect on April 5th, and the reciprocal tariffs were going to be effective as of April 9th.
On April 9th, President Trump announced that most of the April 2nd tariffs would be subject to a 90-day pause, to allow for the negotiation of country-specific trade deals. This pause in the reciprocal tariffs would expire on July 9th. The 90-day pause also influenced the European Union to pause their own retaliatory tariffs for 90 days as well. Canada and Mexico both received relief from U.S. tariffs late in the first quarter after it was announced that imports that claimed and qualified for USMCA duty-free preference were exempt again.
As we move into Q3 negotiations are heating up between the United States and its trade partners. The following is a summary of the tariff changes during the second quarter.
- April 2: The levels for the reciprocal tariffs announced on March 24 are announced. A baseline tariff of 10% is supplemented by country-specific premiums. The White House also clarifies that goods covered by the USMCA will remain tariff-free and that further reductions to the tariffs on Mexican and Canadian goods are subject to the implementation of certain domestic policies.
- April 3: The previously announced auto tariffs become effective. Canada matches with a reciprocal 25% tariff on U.S. autos.
- April 4: China announces a reciprocal tariff of 34% on U.S. imports, slated to begin on April 10th. The Chinese
government also announces new export controls on rare earth metals. - April 5: The 10% global tariff goes into effect.
- April 9: The reciprocal tariffs announced on April 2 go into effect. Hours later, Trump suspends the tariffs for 90 days (new effective date will be July 9). The 10% baseline tariff remains in effect. Trump increases the tariff on Chinese imports to 125%. Canada’s reciprocal tariffs on U.S. autos takes effect. The European Union approve retaliatory tariffs, set to be phased in over the course of 2025.
- April 10: The White House clarifies the tariff on Chinese imports is 145%. The EU pauses its steel and aluminum retaliatory tariffs.
- April 11: China increase tariffs on U.S. imports to 125%. Trump announces a temporary pause on tariffs applicable to electronics.
- April 14: Trump announces that the auto industry may also be temporarily exempt from elevated tariff levels. The U.S. announces its intent to withdraw from a 2019 agreement with Mexico. The withdrawal will effectively apply a 20% tariff on Mexican tomatoes.
- April 29: Trump announces a series of rebates on autos and auto parts, aiming to aid “assembled in the U.S.” automobiles.
- May 8: The Unites States and Britain announce a trade deal, which will reduce tariffs on UK auto-imported to the U.S. and eliminate tariffs on steel and aluminum. In exchange, the UK will increase its imports of U.S. beef and ethanol. The 10% base tariff remains applicable. The EU publishes a list of U.S. products that may be subject to retaliatory tariffs in coming months.
- May 12: The U.S. and China agree to a 90-day cease fire with regards to tariffs. The U.S. tariff on Chinese imports is reduced to 30%; the Chinese tariff on U.S. imports is reduced to 10%.
- May 23: Following stalled trade negotiations with the EU, Trump announces a 50% tariff on all imports from the EU will begin on June 1.
- May 25: Trump delays the 50% tariff on EU products to July 9.
- June 4: Steel and aluminum tariffs increased from 25% to 50% on all trading partners except the U.K.
(remains at 25%). - June 16: The U.S.-UK trade deal is formally signed.
When tariffs are levied, they tend to lead to a variety of economic changes within a country with multiple driving factors. The key factor is that foreign products begin to become comparatively more expensive relative to domestic products. There can be an expenditure switch if imports from other countries become too expensive and domestic production can replace the imported goods. In either case, however, expenses to the consumer are expected to increase. During the first half of 2025, personal consumption expenditures were on the rise, up 2.6% on a year-over-year basis. This trend is expected to continue into the latter half of the year and as more tariffs continue to be levied.
Following the first quarter, there was much uncertainty for the transportation industry with the new implementation of tariffs. The second quarter of 2025 has included a 90-day pause, fluctuations in tariff rates, and new agreements between the United States and its trading partners. While we do not know the full extent of the tariffs, we are beginning to see some of the economic effects as we move into the second half of the year. The tariff outlook is an ever-evolving landscape with many deals expected in July which will lead to more updates as the year progresses. For now, the 90-day pause has allowed the transportation industry to take a step back before the cycle restarts.
Mercer Capital’s Transportation & Logistics team constantly watches the transportation industry and global events and economic factors that can impact the overall industry, the supply chain, or various aspects of transportation. Mercer Capital provides business valuation and financial advisory services, and our transportation and logistics team helps trucking companies, brokerages, freight forwarders, and other supply chain operators understand the value of their business. Contact a member of the Mercer Capital transportation and logistics team today to learn more about the value of your logistics company.
The 2025 Tariff Surge: Timeline and Industry Impact – part I
On January 20th, President Trump signed an executive order mandating that certain members of his cabinet develop reports for recommendations on tariffs by April 1st. Since that date there have been numerous tariffs imposed, impacting the majority of U.S. trading partners. While there are many foreign countries being affected, the three main targets are Canada, China, and Mexico. Some of the tariffs have proved to be short lived or been subject to delays while further trade agreements were discussed. This in turn has caused uncertainty and unsettlement within the transportation and logistics industry. The following is a summary of tariff milestones during the first quarter of 2025.
- January 20: In his inaugural address, Trump announces plan to tariff foreign countries, potentially by creating an External Revenue Service. Trump says he expects to place tariffs of 25% on imports from Canada and Mexico, to begin on February 1.
- January 26: Trump threatens to apply 25% tariffs on Colombian imports during an immigration dispute.
- January 27: Colombia applies a 25% retaliatory tariff on U.S. exports.
- January 28: Colombia and the U.S. resolve the immigration dispute and remove reciprocal tariffs.
- February 1: Trump announces 25% tariffs on non-energy imports and 10% tariffs on energy and potash from Mexico and Canada. Trump also announces a 10% tariff on imports from China. Tariffs to be effective February 4.
- February 4: Trumps announces a thirty day pause on the Canada and Mexico tariffs.
- February 10: Tariffs of 25% announced on steel and aluminum.
- February 13: Trump announces a plan for “reciprocal” tariffs, to be announced in April 2025.
- March 4: Tariffs on Canada and Mexico go into effect. Tariff on Chinese imports doubled to 20%. Canada immediately applied retaliatory tariffs; Mexico announces plans to do the same. China imposes tariffs of up to 15% on U.S. agricultural exports.
- March 5: Tariffs paused on goods relating to automobiles.
- March 6: Trump postpones tariffs on select Mexican and Canadian items.
- March 26: Trump announces 25% tariffs on auto imports, in an attempt to spur domestic manufacturing.
At the end of the quarter, countries were awaiting the schedule of reciprocal tariffs to be applied.
As tariffs continue to be levied against foreign countries, internal inflation is expected to continue rising. The Federal Reserve believes that “trade disruptions may affect consumer prices not only through the direct effect of increases in import prices, but also indirectly as a result of induced increases in the prices of domestically produced goods triggered by higher input costs.” This idea led to many companies stocking their shelves earlier than anticipated with impending tariffs looming. The Bureau of Economic Analysis (BEA) states that in Q1 2025 the transportation industry received a short boost due to the stockpiling of certain goods from overseas. This can be expected to fall as tariffs continue to take effect across the world.
In addition to the standard tariffs discussed above, the removal of De Minimis exemptions will also impact the transportation industry. Section 321 of the Tariff Act of 1930 allows for tariff-free goods imported by individuals, assuming the daily value of the good does not exceed $800. These imports are known as “de minimis entries.” The act essentially allows for items that are too trivial to be taxed to obtain certain exemptions from tariffs. De minimis entries grew in volume from 153 million in 2015 to over 1 billion by 2023, the growth in popularity of websites such as Shein and Temu being the main factor. The total value of de minimis imports topped $60 billion in 2023. In early February, the administration announced that they were removing this act on low value imports from China. While the change was initially applied immediately, the change was since delayed. The application of a tariff of any size to previously exempt merchandise is expected to have a chilling effect on consumption in the U.S. This has the potential to affect the whole transportation industry within the United States and significantly lower the volume of imports by parcel airfreight and last mile companies.
Furthermore, Congress.gov has identified the copper and lumber industries as the next fields to receive possible tariffs. These include all copper, lumber/timber, and their derivative imports but the initial rate is unknown. They reported that in early March investigations were launched with no clear timetable as to when the industries will be affected. This could be the start of a second string of tariffs implemented later in the year.
While tariffs have created uncertainty in the first quarter of 2025 for transportation, there is still hope for improvements across the nation. International trade will continue to decline as tariffs continue to be levied, but possibilities of a slight pause will allow for importers and exporters to recoup some of their lost profits. The auto parts, steel, and energy sectors have already been impacted, but the door is open for more domestic transportation and shipping upheavals. With the threats of more tariffs looming, it prompts levels of skepticism on the transportation industry not seen since the COVID pandemic.
>> Click here to read part II
From Disruption to Deposits: What Circle’s Rise Signals for Banks
With the signing of the GENIUS Act into law and the recent success of several fintech IPOs, a renewed interest in Stablecoins has reinvigorated market talk that traditional commercial banks could see some pressure on deposit franchises as occurred nearly 50 years ago when Merrill Lynch introduced the cash management account. Circle Internet Group, “CRCL”, made headlines with its IPO last month and is one of the key players in the current discussion regarding the evolving financial system.
Company Overview
Circle Internet Group, Inc. “CRCL” was founded in 2013 and is the issuer of USDC, the world’s second largest Stablecoin by market capitalization with $61 billion in circulation as of May 2025. Circle also issues EURC payment Stablecoins. USDC and EURC are digital currency tokens backed by reserves and redeemable on a one-for-one basis for U.S. dollars or euros, respectively. USDC was launched in September 2018, and EURC was launched in June 2022.
CRCL primarily generates revenue by investing the reserves that back Stablecoins in short-term U.S. Treasury securities. From 2020 to 2024, the company grew from $15.4 million in revenue in 2020 to $1.7 billion in revenue in 2024. CRCL reported $155.7 million in net income and $284.9 million in adjusted EBITDA in 2024.
IPO Overview
CRCL filed for its IPO in early 2025, targeting a valuation of up to $6.71 billion with an initial share price range of $24–$26. Due to high investor demand, the company upsized its offering and priced the IPO at $31 per share, above the revised range of $27–$28. The IPO raised $1.05 billion, with the company and selling stockholders offering 34 million shares. The IPO was highly anticipated, especially given the crypto-friendly regulatory environment under the Trump administration and the growing adoption of Stablecoins.
On June 5, 2025, Circle’s shares began trading on the New York Stock Exchange under the ticker symbol CRCL, opening at $69 per share, more than double the IPO price. On the first day of trading, the stock reached an intraday high of $103.75 and closed at $83.23, marking a 168% increase from the IPO price.
Stock Performance Since IPO
Since its debut, the stock’s volatility and upward trajectory have been notable. On its second day of trading, the stock surged nearly 30% to close at $107.70, and it reached a record high price of $298.99 in late June. CRCL’s strong performance has been fueled by favorable regulatory tailwinds (GENIUS Act), positive market sentiment towards fintech and AI, and the company’s strategic positioning, including Circle’s regulatory-first approach and a recently announced partnership with Fiserv. As of July 29, the stock price stood at $190.70, or approximately 6x its IPO price of $31 per share. While some analysts express concerns over competition and sensitivity of revenue to market interest rates, many remain bullish on CRCL’s long-term potential and position in the maturing digital asset landscape.
Banking-Related Takeaways
The success of Circle’s IPO, signing of the GENIUS Act, and increasing confidence in fintech and digital banking could have significant implications for the banking industry. Below are three key takeaways:
- Increased Adoption of Digital Assets in Banking. Circle’s IPO success signals a growing acceptance of digital assets by traditional investors and institutions. This trend could encourage banks to integrate Stablecoins and other digital currencies into their services, offering faster and cheaper cross-border transactions compared to traditional methods. On a recent Banking with Interest podcast episode hosted by Rob Blackwell, Alex Johnson, founder and publisher of FinTech Takes, discusses the impending race between nonbank Stablecoin issuers and banks who need to quickly find a way to tokenize key financial instruments like deposits. Johnson argues that ultimately, the question of how important it is to be the winner of that race is determined by the utility and use cases of tokenized money. In considering areas in which Stablecoins might be superior to payment methods already in place and what they might be used for, Jonhson lists five use cases:
- As bank accounts for the onchain economy.
- A safe place for individuals in countries with less stable currency regimes or less stable inflation to keep their money.
- International remittances as Stablecoins tend to work better, reach more places, and be cheaper than correspondent banking.
- Potential to be a better version of prepaid closed loop payment systems.
- With regulation, Stablecoins might displace banking as a service as the infrastructure of choice for fintech entrepreneurs to build new money apps on top of.
- Regulatory Clarity and Innovation. The favorable regulatory environment, particularly under the Trump administration’s embrace of cryptocurrencies, could spur innovation in the banking sector. Developments, such as the recently signed GENIUS Act, aim to establish a regulatory framework for Stablecoin issuers, potentially easing compliance for banks. This clarity could enable banks to develop new products, such as tokenized deposits or blockchain-based payment systems, enhancing their ability to serve customers in a digital economy. Circle’s application for a national trust bank license post-IPO, if approved, could set a precedent for banks to operate in the digital asset space under federal oversight.
- Pressure on Deposits. There is a lot of discussion surrounding the threat of Stablecoins to traditional banks and the impact on bank deposits. In the Banking with Interest episode, Johnson says he doesn’t think Stablecoins will result in a massive flight of deposits out of the banking system but do have the potential to accelerate deposit dislocation from small banks to larger banks as Stablecoin issuers will need to custody their deposits somewhere. In a recent American Banker article, the authors examine the potential increase in banks’ average cost of funds given a shift in funds from bank deposits to payment Stablecoins and the negative impact on households via reduced credit and higher borrowing costs.
About Mercer Capital
The growing presence of Stablecoins, coupled with regulatory clarity from the GENIUS Act, may have long-term implications for deposit flows and banking models. Mercer Capital has decades of experience evaluating disruptive trends and their impact on financial institutions. Please call if we can assist your board in navigating the strategic and valuation considerations of an evolving digital financial landscape.
2025’s Halftime Performance
This month, Zac Lange authored a mid-year economic and financial trends review and outlook for Mercer Capital’s Family Business Director Blog. As a timely and relevant piece to the grander economy, we chose to feature the piece on this month’s Valuation and Forensic Insights.
When it comes to investor sentiment, 2025 has been a tale of two very different quarters. During the first quarter of 2025, GDP decreased at an annualized rate of 0.2%, consumer spending only marginally increased, and the ongoing risk of recession grew. Following up on a post I wrote earlier this year, it’s July, it’s movie night, and Jerry Maguire is screaming, “Show me the money!”
As we officially transition from the first half of the year to the second, investors hope to continue what has been a historic recovery over the last three months. Krystal Hur and Karen Langley, in recent articles for the Wall Street Journal, discuss how solid economic data suggest that growth could continue. Inflation is trending near the Fed’s 2% target, continued trade negotiations are ongoing, and both the S&P 500 and Nasdaq hit all-time highs on Friday, June 27.
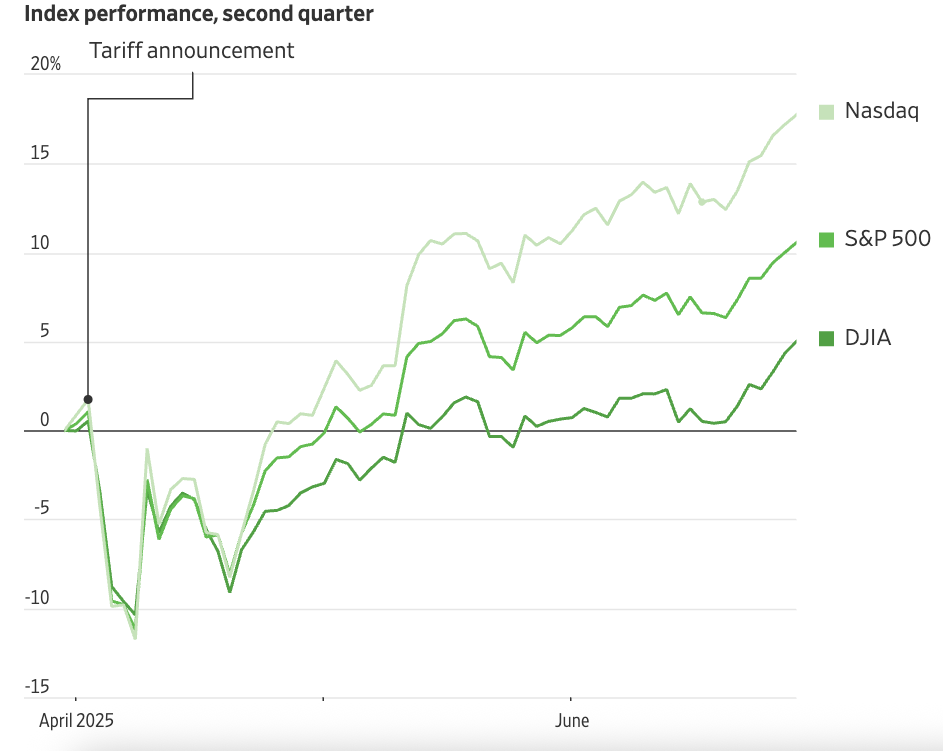
Although long-term uncertainty remains, in just a few months, the shift from uncertainty and fear to the rebound in the market came on April 9 as President Trump announced a 90-day pause on the planned tariffs. This triggered a 9.5% daily increase for the S&P 500, its best day since the 2008 financial crisis. And the index did not stop there.
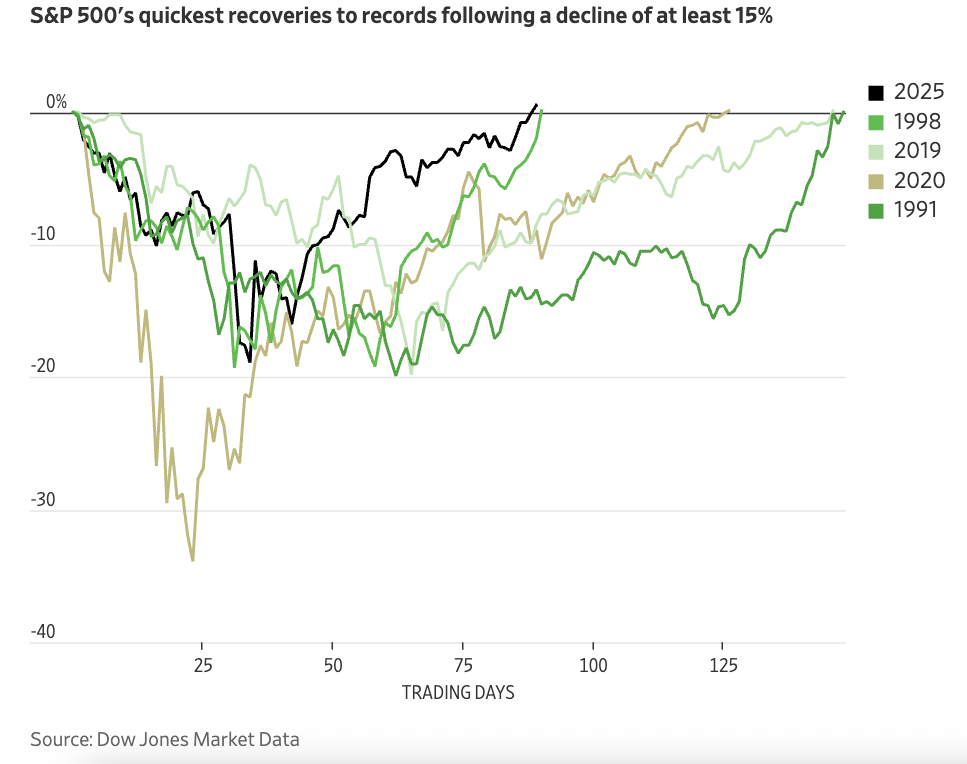
As the pause ends in early July, predicting where the market goes in the second half of the year remains troublesome. Langley and Hur discuss how investor optimism is reflected in the S&P 500’s top-performing sector this year, industrial stocks. This sector is a good representation of the overall economy’s strength, as industrials have increased 11%, compared to a 5% gain by the S&P 500.
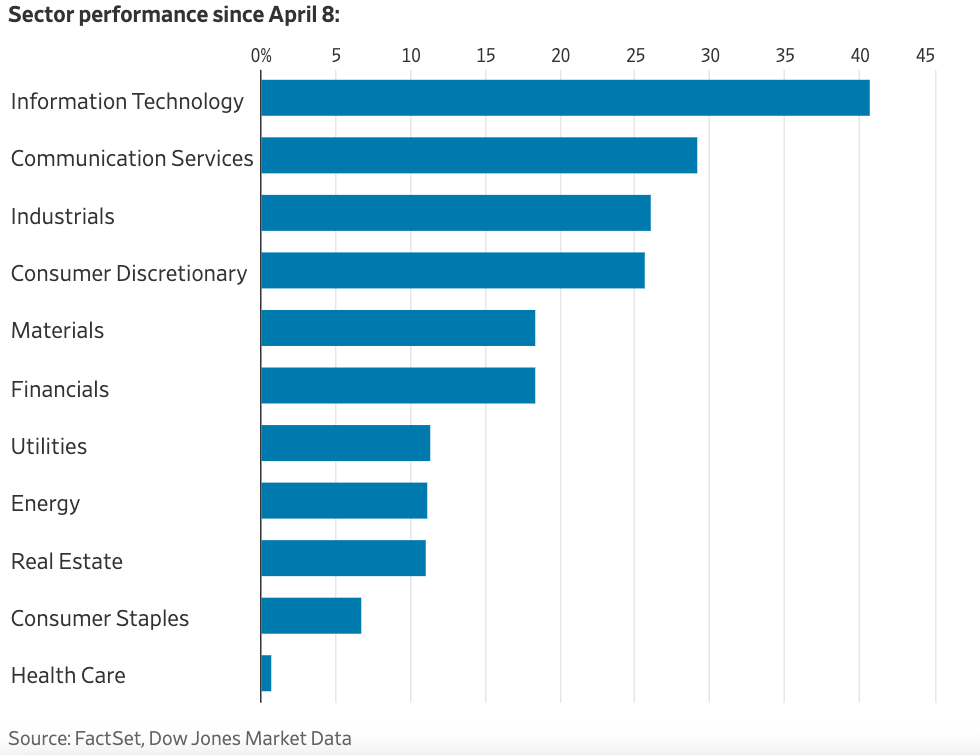
Moving Forward
As emerging investor optimism for the rest of 2025 washes away the Q1 uncertainty and pessimism, we want to focus on two key questions related to growth, risk, and the meaning of the family business: investment decisions and distribution policy.
We tend to assign one of the four basic meanings to a family business. The idea is that your family business’s appetite for growth and risk depends on what meaning your family assigns to the business. As shown below, the meaning of the family business influences the company’s dividend policy, investing, and financing decisions.

Investing
How the family business makes investment decisions is tied to how your family shareholders think about risk and growth. Family businesses make investment decisions from a wide range of potential alternatives — both within the business and through diversification. Highlighted below are some of the more common risk-return combinations available to investors. To achieve a higher expected return, investors must be willing to accept greater risk.

But how do family business directors approach the risk-return question? Reflecting on the meaning of your family business provides a valuable backdrop for making that decision. If your family business serves as a “source of lifestyle,” you are less likely to invest in higher-return (higher risk) projects or diversification efforts that could jeopardize current dividends and endanger business predictability.
Alternatively, suppose your family views the business as an “economic growth engine” meant to grow with your family. In that case, you will likely aim to make investment decisions that maximize the expected return (thus, increasing risk) to drive the economic growth of your business for future generations. Ultimately, your goal as a family business director is to reconcile the family shareholders’ risk-return objectives with the business’s growth and risk profile.
Distributing
The flip side of reinvesting in your family business is distributions. Net operating cash flows can either be reinvested into your business or paid out to shareholders.
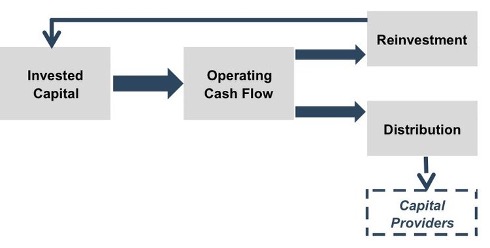
Companies that understand what the business means to the family can make distribution decisions that reflect shareholder objectives and needs. If family shareholders see the company as a growth engine, they should be willing to accept lower distributions to generate higher growth, just as shareholders seeking consistent distribution checks should be willing to accept more muted long-term growth.
Ultimately, family business directors need to remember their shareholders are just that: shareholders. While their equity may have been earned through familial ties, family business owners deserve the same considerations paid to public company shareholders — a focus on protecting and growing shareholder value through a mix of reinvestment opportunities and distributions.
Conclusion
A disciplined process of analyzing investment choices (we discuss in detail here) informed by an understanding of family shareholder objectives will help private business directors decide on investment and distribution strategies. Evaluating investment decisions for future growth and distribution policies in light of the family’s risk tolerance, growth objectives, and business meaning is critical. Give one of our family business professionals a call today for help with these topics.
The Impact of the One Big Beautiful Bill Act on Tax and Estate Valuations
During the first Trump administration, the Tax Cuts and Jobs Act (“TCJA”) introduced substantial modifications to the tax code, including significant reductions to estate tax liabilities. These reductions, however, were designed to sunset at the end of 2025, and addressing the expiring provisions became a priority for the current Trump administration. These were addressed in the One Big Beautiful Bill Act (“OBBBA”), an extensive legislative package touching on a variety of tax and spending policies. After a series of late-stage amendments, the OBBBA passed both chambers of Congress and was signed into law on July 4.
In this issue of Value Matters, we examine the OBBBA’s provisions from a valuation perspective, focusing on implications pertinent to tax and estate planning professionals.
Valuation Perspective
One of the key determinants of value of an interest in a company – be it a family-owned operating company or a real estate holding company – is the cash flow generated by the company and available to the shareholders for either distribution or reinvestment. The cash flow generated by a company directly impacts its valuation and the level of distributions made to shareholders impacts the magnitude of discounts applicable to nonmarketable minority interests in companies.
Impact of OBBBA on Valuation
The OBBBA directly impacts cash flows in several key ways.
- Permanency of TCJA Provisions: The OBBBA makes permanent various TCJA provisions that were scheduled to sunset at the end of 2025. These provisions include:
- 37% top individual income tax rate
- 21% corporate income tax rate
- The Section 199A Qualified Business Income (“QBI”) deduction allowing tax pass-through entities to deduct up to 20% of their QBI. The QBI applied to entities that fall under the IRS’s definition of a “specified service trade or business” and includes entities in health, legal, accounting, and consulting fields. Reducing the tax burden owed by owners of S Corporations or members of partnerships increases the economic dividend received. All things equal, this reduces the costs of holding the asset during a nonmarketable period, reducing applicable discounts.
- Bonus depreciation was also made permanent under OBBBA and expanded to include buildings. Bonus depreciation can impact the timing of fixed asset purchases and allows a company to take advantage of a large upfront expense write-off, as opposed to trickling out the depreciation over the asset’s service life.
- The OBBBA also changed the definition of adjusted taxable income used to calculate tax loss carryforwards. The changes will ultimately allow businesses to deduct more interest upfront, reducing carryforwards and increasing cash flow in the short term. At the end of the day, asset-heavy pass-through companies are the big winners from these provisions.
Changes to Capital Gains Tax Treatment
The exclusion permitted related to sales of Qualified Small Business Stock (“QSBS”) has also been expanded. For qualified five-year holdings, 100% of the capital gains up to $15 million is exempted from capital gains taxes. The exclusion cap is indexed to inflation beginning in 2026.
The OBBBA also introduced partial exclusions for QSBS shares held for shorter holding periods – 50% of gains are exempted for three-year holdings and 75% of gains are exempted for four-year holdings.
The QSBS rules apply only to C corporations in non-service industries (for example, tech or retail) but can be advantageous to those planning to transfer shares across generations.
Estate Tax Provisions
Of most immediate relevance to estate planners is the substantial revision of estate tax exemption thresholds. The lifetime exclusion amount – the amount under which estate and gift taxes are not owed – was increased to $15 million for single filers and $30 million for joint filers beginning in 2026. This amount is indexed to inflation and will increase in future years.
As shown in Figure 1, the lifetime exclusion amount has varied over time. The TCJA doubled the inflation-indexed exclusion amount from a base of $5 million to $10 million (or $5.49 million in 2017 to $11.18 million in 2018, after the inflation adjustment).
Figure 1: Lifetime Exclusion Amounts
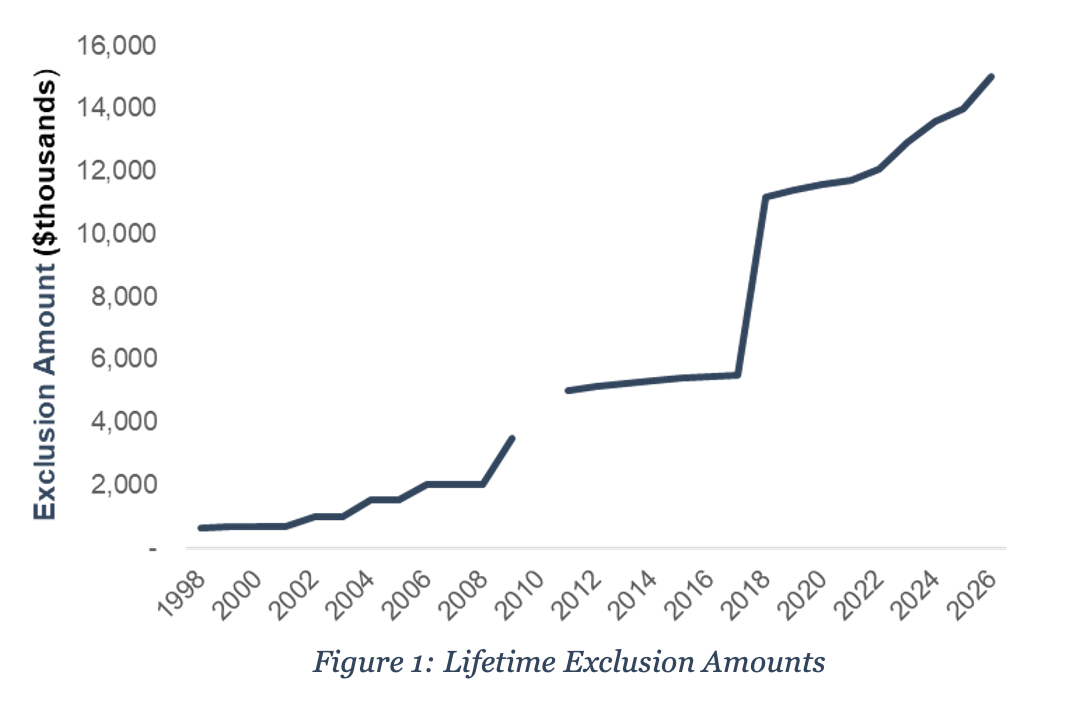
Absent the passage of the OBBBA, the expiration of TCJA in December 2025 would have resulted in the exclusion reverting back to the $5 million base level (which would have been just over $7 million in 2026 after the inflation adjustment).
It is also important to note that the estate exclusion amount is lifetime amount – gifts, estate, and generation-skipping transfers all work off of the same $15 million “pool” of exemption value. The actual rates applicable to gift and estate taxes are unchanged and portability between spouses remains.
Importantly, unlike the TCJA provisions, the OBBBA’s estate tax thresholds do not include sunset provisions, offering greater predictability. Nonetheless, future legislative changes remain a possibility, underscoring the importance of sustained, proactive planning.
Additionally, the OBBBA only impacts federal estate tax obligations; individual states may have their own estate tax rates and exemption levels. Taxpayers who maintain a course of consistent and vigilant estate planning will be best positioned to achieve their planning objectives and successfully thwart future challenges once the pendulum of enforcement activity and tax policies inevitably swing in the opposite direction.
Conclusion
As Ben Franklin observed over two hundred years ago, “in this world nothing can be said to be certain, except death and taxes.” In navigating these certainties, collaboration with experienced estate planners and valuation professionals is critical.
Feel free to reach out to us if you have any questions about the OBBBA’s impact on gift and estate tax valuations or to discuss a valuation issue in confidence.
Fairness Opinions for Continuation Fund Transactions
As the private equity industry grapples with a growing backlog of aging portfolio companies and limited exit opportunities, continuation funds have emerged as a vital solution for generating liquidity and extending investment horizons. These complex, often conflicted transactions, where the GP serves as both buyer and seller, demand rigorous oversight.
This presentation explores the evolving secondaries market and the critical role fairness opinions play in upholding fiduciary duty, ensuring transparency, and protecting limited partners.
Fairness Opinions
Evaluating a Buyer’s Shares from the Seller’s Perspective – 2025 Update
Perhaps the IPO market is signaling that a notable improvement in the M&A market may occur after a so-so start in 2025. Financial services companies have been active, with notable IPOs such as Circle Internet Group (NYSE:CRCL) and Chime Financial (NASDAQ:CHYM). A pick-up in IPO activity historically has presaged a pick-up in M&A.
Bank M&A Deal Flow: 2025 Trends in Context
As of June 27, 2025, there have been 70 bank deals announced, which on an annualized basis if sustained would equate to about 3% of the 4,487 charters as of January 1. Over the past 35 years, typically 2% to 4% of the industry is acquired each year. The average P/TBV and P/E for the 26 deals with reported pricing was 146% and 17x.
Excluding small transactions, the issuance of common shares by bank acquirers usually is the dominant form of consideration sellers receive. While buyers have some flexibility regarding the number of shares issued and the mix of stock and cash, buyers are limited in the amount of dilution in tangible book value per share (“TBVPS”) they are willing to accept and require visibility in EPS accretion over the next several years to recapture the dilution.
Because the number of shares will be relatively fixed, the value of a transaction and the multiple(s) the seller hopes to realize are a function of the buyer’s valuation. High multiple stocks represent strong acquisition currencies for acquisitive companies because fewer shares are issued to achieve a targeted dollar value.
It is important for sellers to keep in mind that negotiations with acquirers where the consideration will consist of the buyer’s common shares are about the exchange ratio rather than price, which is the product of the exchange ratio and buyer’s share price. A fairness opinion will address the fairness of the exchange ratio and consideration received by selling shareholders, not “price” per se in a stock swap transaction.
The Complexity of Evaluating Offers
Unlike cash deals, comparing and assessing fairness (and value) when stock swap offers are received requires a lot more deliberation by a board of directors and its advisor. One offer may entail a higher nominal price, but the acquirer’s shares may trade at a premium whereas a competing offer may equate to a lower price but the shares may entail less risk. Also, exchange ratios can be evaluated based upon the pro forma ownership of the acquirer post-closing compared with the contribution of operating income, core deposits and the like.
When sellers focus on price, it is easier all else equal for acquirers to ink a deal when their shares trade at a high multiple of TBVPS and EPS. However, high multiple stocks represent an under-appreciated risk to sellers who receive the shares as consideration. Accepting the buyer’s stock raises a number of questions, most of which fall into the genre of: what are the investment merits of the buyer’s shares? The answer may not be obvious even when the buyer’s shares are actively traded.
Board Oversight
Our experience is that some if not most members of a board weighing an acquisition proposal do not have the background to thoroughly evaluate the buyer’s shares. Even when financial advisors are involved, there still may not be a thorough vetting of the buyer’s shares because there is too much focus on “price” instead of, or in addition to, “value.”
The Role of Fairness Opinions in M&A
Fairness opinions seek to answer the question whether the proposed consideration is fair to a company’s shareholders from a financial point of view. The opinion should be backed by a robust analysis of all of the relevant factors considered in rendering the opinion, including an evaluation of the shares to be issued to the selling company’s shareholders. The intent is not to express an opinion about where the shares may trade in the future, but rather to evaluate the investment merits of the shares before and after a transaction is consummated.
Key Questions When Evaluating Acquirer Shares
As we have advised in the past, the key questions to ask about the buyer’s shares remain the same. They are:
- Liquidity of the Shares. What is the capacity to sell the shares issued in the merger? SEC registration and NASADAQ and NYSE listings do not guarantee that large blocks can be liquidated efficiently. OTC listed shares should be scrutinized, especially if the acquirer is not an SEC registrant. Generally, the higher the institutional ownership, the better the liquidity.
- Profitability and Revenue Trends. The analysis should consider the buyer’s historical growth and projected growth in revenues, pretax pre-provision operating income and net income as well as various profitability ratios before and after consideration of credit costs. The quality of earnings and a comparison of core vs. reported earnings over a multi-year period should be evaluated.
- Pro Forma Impact. The analysis should consider the impact of a proposed transaction on the pro forma balance sheet, income statement and capital ratios in addition to dilution or accretion in earnings per share and tangible book value per share both from the seller’s and buyer’s perspective.
- Tangible BVPS Earn-Back. The projected earn-back period in day-one dilution to TBVPS is an important consideration for the buyer. In the aftermath of the GFC, an acceptable earn back period was on the order of three to five years; today, two to three years as institutional shareholders have indirectly tightened the pricing box for M&A by demanding that publicly traded buyers limit TBVPS dilution to short payback periods.
- Dividends. Sellers should not be overly swayed by the pick-up in dividends from swapping into the buyer’s shares; however, multiple studies have demonstrated that a sizable portion of an investor’s return comes from dividends over long periods of time. Sellers should examine the sustainability of current dividends and the prospect for increases (or decreases). Also, if the dividend yield is notably above the peer average, the seller should ask why? Is it payout related, or are the shares depressed?
- Capital and the Parent Capital Stack. Sellers should have a full understanding of the buyer’s pro-forma regulatory capital ratios both at the bank-level and on a consolidated basis (for large bank holding companies). Separately, parent company capital stacks often are overlooked because of the emphasis placed on capital ratios and the combined bank-parent financial statements. Sellers should have a complete understanding of a parent company’s capital structure and the amount of bank earnings that must be paid to the parent company for debt service and shareholder dividends.
- Loan Portfolio Concentrations. Sellers should understand concentrations in the buyer’s loan portfolio, outsized hold positions, and review the source of historical and expected losses.
- Ability to Raise Cash to Close. What is the source of funds for the buyer to fund the cash portion of consideration? If the buyer has to go to market to issue equity and/or debt, what is the contingency plan if unfavorable market conditions preclude floating an issue?
- Consensus Analyst Estimates. If the buyer is publicly traded and has analyst coverage, consideration should be given to Street expectations vs. what the diligence process determines. If Street expectations are too high, then the shares may be vulnerable once investors reassess their earnings and growth expectations.
- Valuation. Like profitability, valuation of the buyer’s shares should be judged relative to its history and a peer group presently and relative to a peer group through time to examine how investors’ views of the shares may have evolved through market and profit cycles. Valuation is rarely a catalyst for a stock, but both absolute and relative valuation speak to one aspect of investment risk.
- Share Performance. Sellers should understand the source of the buyer’s shares performance over several multi-year holding periods with returns disaggregated into three components: EPS growth, multiple expansion or contraction, and the impact of reinvested dividends. If the shares have significantly outperformed an index over a given holding period, is it because earnings growth accelerated? Or is it because the shares were depressed at the beginning of the measurement period? Likewise, underperformance may signal disappointing earnings, or it may reflect a starting point valuation that was unusually high.
- Strategic Position. Assuming an acquisition is material for the buyer, directors of the selling board should consider the strategic position of the buyer, asking such questions about the attractiveness of the pro forma company to other acquirers.
- Contingent Liabilities. Contingent liabilities are a standard item on the due diligence punch list for a buyer. Sellers should evaluate contingent liabilities too.
Conclusion: Value, Risk, and the Post-Deal Reality
The list does not encompass every question that should be asked as part of the fairness analysis, but it does illustrate that a liquid market for a buyer’s shares does not necessarily answer questions about value, growth potential and risk profile. When one surveys the M&A history of banks, there is no shortage of sellers who were waylaid by the performance of the buyer’s shares after the deal closed.
We at Mercer Capital have extensive experience in valuing and evaluating the shares (and debt) of financial and non-financial service companies garnered from over four decades of business.
Potential Intersection of Estate Planning During the Divorce Process
Divorce is often an emotionally and financially draining process, and estate planning may be the last thing on the minds of the divorcing parties. However, reviewing estate plans during a divorce can be a step in preparing for the future. Like many aspects of divorce, timing matters and there are both advantages and drawbacks to updating your estate documents while the divorce is still pending.
The Pros of Estate Planning During Divorce
Divorce proceedings can take months or even years. During that time, the current spouse may still have legal authority over health care decisions, financial matters, and inheritances under a preexisting estate plan. Updating documents such as power of attorney, health care proxy, and beneficiary/trustee/guardian designations (if legally allowable as discussed later) can ensure that soon-to-be exes do not have unwanted control over affairs in the event of incapacitation or death before the divorce is finalized. There can also be a form of “reverse” estate planning, such as placing restrictions on certain persons as beneficiaries under a trust.
While everyone wants to know the value of their privately held business, it can be costly, which leads many business owners to go years without a valuation. As seen in our graphic “The Business Transfer Matrix”, death and divorce are two events that lead to the valuation process.
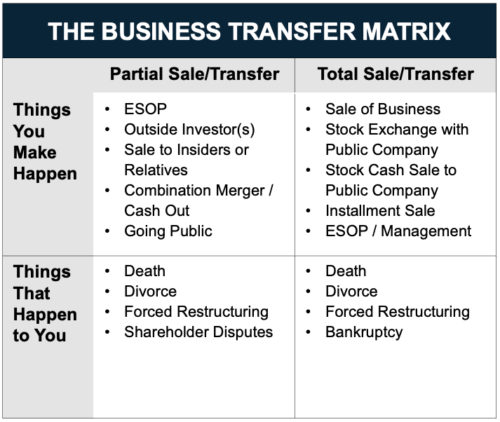
Revising an estate plan contemporaneous to on-going divorce proceedings may lead to efficiencies for divorcing and gifting parties. When a couple owns a business or multiple business interests, the expert fees associated with valuing the businesses can pile up quickly, particularly when there are competing experts, and two sets of attorneys preparing for a contentious trial.
Contrast this to the parties agreeing on one expert to value a business interest which is then transferred for the benefit of the divorcing couple’s children. While this approach may result in lower costs, it may also result in a significant benefit of reduced acrimony in settlement discussions. The in-spouse (the one who stays involved with the business post-divorce) does not want to overpay their spouse just as the out-spouse wants to receive as much in equitable distribution. By transferring the economic interest (perhaps even structuring such that one of the divorcing parties maintains operational control of the business), this can “take valuation off the table” because the business interest would no longer be part of the marital estate in addition to the many benefits of estate planning absent a divorce proceeding.
Transferring the business interest out of the marital estate may also become a last resort if the two valuation experts have irreconcilable valuations for the business. There is the added benefit of potential tax benefits available to married couples such as gift-splitting that will no longer be available post-divorce. While estate planning during divorce is not a one-size-fits-all approach, it can be a creative way to get a case settled and save money in the long-run.
The Cons of Estate Planning During Divorce
Some states impose “automatic temporary restraining orders” (ATROs) during divorce proceedings, which can limit the ability to change beneficiary designations or transfer assets. These rules are designed to prevent one spouse from hiding or dissipating marital property but may also restrict legitimate estate planning modifications. This is an appropriate safeguard and further highlights the need for cooperation to be able to embark upon estate planning during a divorce – something that is frequently not observed. For estate planning to realize optimal outcomes in a divorce process, a proper team should be assembled on the front end of a divorce process, as both parties are well-served to preserve end-goals such as tax planning, rather than have the dispute fall into a process of manipulation for personal-benefit reasons in the divorce process.
Until the divorce is finalized, the parties’ individual financial picture is in flux. We typically assist with the determination of asset values (like a business), equitable distribution, alimony, and child support obligations, that can make it hard to plan accurately for future asset composition. Premature changes to an estate plan might also conflict with the eventual divorce settlement or require costly revisions in the future, particularly if both parties initially agree, then one or both back out of the estate planning process.
One financial concept to think about is “core” and “surplus” capital, a framework that frequently arises in our discussions with wealth advisors. During an estate planning process, it’s important to know how much you can comfortably transfer to future generations or charitable causes. While reducing taxes and increasing proceeds for future generations is an admirable goal, this should not come at the expense of financial uncertainty. Stated plainly, advice we’ve heard is “don’t give away more than you can afford to realize your personal financial objectives”.
The divorce process already introduces a significant amount of uncertainty, going from one family budget to two households, among a host of other changes. Estate planning requires clear thinking and careful consideration — two things that may be in short supply during a divorce. For some, adding another layer of legal work may overcomplicate the process and lead to unwanted delays. This complexity reminds us of estate planning some business owners do in advance of selling their business.
To accomplish successful estate planning during divorce, respective legal counsel may collaborate on certain issues. While some family law groups are part of larger law firms, many others focus exclusively on family law. Firms that possess capabilities in both estate planning and family law may have a built-in advantage to realize a mutually acceptable estate plan during a divorce, but it ultimately comes down to communication amongst the attorneys, and being part of the same firm is not a prerequisite for good communication. Even firms that offer both legal disciplines may not represent the most efficient course of action if an estate plan was already drafted by another firm as it may be easiest to have the initial drafting firm update the documents based on discussions with the family law attorneys.
From a valuation perspective, a firm that is well versed in both family law and estate planning is best positioned to navigate the labyrinth of issues that lead to equitable outcomes. Mercer Capital’s senior professionals are members of the American Academy of Matrimonial Lawyers (AAML) Foundation Forensic & Business Valuation Division and are also regularly engaged by the nationally prominent estate planning attorneys. Our extensive valuation work for both family law and estate planning matters keeps us well informed of material developments in each field and how they may affect valuation and planning strategies.
Conclusion
In short, while estate planning during divorce adds complexity, in the right circumstances it can also be a vital resource — one worth considering depending on the size and composition of the marital estate as well as the cooperation opportunities amongst the divorcing parties. In all scenarios, seasoned legal counsel is advised. Combined with experienced valuation assistance, consideration of estate planning techniques in the midst of a divorce may result in a novel solution to the inherently complex and contentious divorce process.
Takeaways from the Pierce Case: The Importance of Relevant Data and Reasoned Analysis
The 2025 U.S. Tax Court opinion in Kaleb J. Pierce v. Commissioner of Internal Revenue (T.C. Memo 2025-29) offers insight on several issues that regularly feature in the valuations of privately held business interests. By presenting an issue-by-issue analysis, the Pierce decision reinforces an important message for appraisers and estate planners: relevant data and reasoned analysis carry the day in court.
Background
The subject company, Mothers Lounge, LLC, an S corporation for tax purposes, sold mother and baby products. The company sold cheaply manufactured goods directly to consumers. The business relied on a “free, just pay shipping” no returns model, which afforded it a high profit margin, but came with a plethora of unsavory business practices, including copying competitor products, over-charging customers for shipping, undermining wholesalers and marketing affiliates, and suppressing customer reviews.
The business history and practices detailed in the Findings of Fact are sufficient to raise eyebrows in a room full of former FTX executives. The dubious business model invited frequent litigation, with most lawsuits filed for trademark infringement. Two lawsuits were specifically described, one of which was for patent infringement and illegal marketing practices that had “ballooned into an existential threat.” Adding to these murky undercurrents were an affair of one of the business principals and a blackmail demand letter that spurred an FBI investigation. As noted by the Tax Court, these developments had “caused extreme dysfunction with the company’s management and demoralized the workforce” in the timeframe before the valuation date.
The company’s business practices may have raised eyebrows, but they were lucrative. The first successful product, a nursing cover, illustrates the model:

Despite giving the product to customers for “free,” Mothers Lounge, LLC earned a healthy 64% contribution margin on each unit sold, which was more than sufficient to cover all other operating expenses of the business. In 2013, the company had an EBITDA (earnings before interest, taxes, depreciation and amortization) margin of 29%, which many readers will recognize as above average for a consumer products business. The company was debt-free and required minimal investments in depreciating assets, making EBITDA a good proxy for pre-tax cash flow.
The Pierce court had to decide the proper value for gift tax purposes of two minority interests in Mothers Lounge, LLC that were transferred in 2014 (a 29.4% interest and a 20.6% interest).
Expert Witnesses
The taxpayer’s expert prepared a valuation report submitted at trial. During the administrative appeal of the case in 2017, the taxpayer’s expert had also prepared a forecast for the business (the “2017 Forecast”). The taxpayer’s expert did not rely on the 2017 Forecast in his appraisal of the subject interests before the Tax Court, but the valuation expert for the IRS did. To recap, there were two valuation experts at trial, one for the taxpayer and one for the IRS. In preparing his appraisal, the IRS’ valuation expert relied on the 2017 Forecast prepared by the taxpayer’s expert, but the taxpayer’s expert did not rely on the 2017 Forecast in preparing his appraisal.
Key Issues
Forecast
While both experts agreed on the application of the income approach, they relied on different forecasts. The forecast prepared by the taxpayer’s expert for his appraisal report relied on an analysis and assessment of relevant factors and market trends “known or knowable” as of the valuation date, which the Court deemed credible. In contrast, the IRS’ valuation expert relied on the 2017 Forecast “without independent verification,” which the Court easily rejected.
The fact that the taxpayer’s expert prepared the forecasts underlying both his own report and that of the IRS’ valuation expert is a unique feature of the case. While the Pierce court deemed the forecast used by the taxpayer’s expert credible, it declined to ascribe weight to the 2017 Forecast used by the IRS’ valuation expert (which was prepared by the taxpayer’s expert). According to the opinion, the taxpayer’s expert “was in a time crunch” to prepare the 2017 Forecast and he ultimately relied on post-valuation data to support its projections. The Court noted that the 2017 Forecast lacked any analysis or discussion of the events surrounding the FBI investigation and inappropriately relied on post-valuation data. The Court pointedly stated that “this reliance blurs the line between information that was known or knowable as of the valuation date and the information that was not reasonably foreseeable as of the valuation date.”
Tax Affecting
Both experts agreed that tax affecting the earnings of the company (an S corporation) was appropriate and used the Delaware Chancery method to calculate substantially equivalent tax rates (26.2% and 25.8%).
The Court commented that tax affecting earnings of tax pass-through entities can be rejected where “a party fails to adequately explain” its necessity or where the experts “have not accounted for the benefits of S corporation status to shareholders.” We note that the 2017 Tax Cuts and Jobs Act brought C and S corporations closer to parity in taxation, diminishing the additional economic benefits formerly realized by owners of pass-through entities. Nonetheless, the Pierce opinion affirms that the valuation of an interest in a tax pass-through entity should account for the effect, if any, of tax status on the value of the interest.
Discount Rate
Mothers Lounge, LLC had no debt and both experts developed a cost of equity capital (COEC) discount rate using the build-up method. The key differences between the experts were in the presentation of the underlying data and the application of a company-specific risk premium (CSRP).
The taxpayer’s expert used the Kroll Cost of Capital Navigator platform, which includes tables with output results, but does not present the underlying data. In contrast, the IRS’ valuation expert “provided a thorough review of his process and the academic papers that supported his equations.” Citing the lack of supporting data in the taxpayer’s expert report, the Court accepted the COEC rate concluded by the IRS’ valuation expert.
Of particular interest is the issue of company-specific risk premium. The taxpayer’s expert added a CSRP of 5% to the build-up analysis, while the IRS’ valuation expert applied a 0% premium. In discussing the company-specific risk premium, the Court acknowledged that the build-up method allows for the consideration of such risks, but expressed concern that such risk factors may already be accounted for in other elements of the build-up approach (such as the size premium). Ultimately, the Court did not accept the premium applied by the taxpayer’s expert, who had cited five risk factors he considered in arriving at his conclusion for the premium. The Court chided the taxpayer’s expert for failing to provide sufficient details to allow the Court to understand the derivation of the selected premium. The Court’s conclusion confirms the need to support the application of a company-specific risk premiums with reference to available market evidence and the overall reasonableness of the resulting conclusion of value.
Applicable Discounts
Both experts applied discounts for lack of control and lack of marketability in the valuation of the subject minority interests.
- With respect to the discount for lack of control, the experts differed in the approach used to determine the discount and its application. The Court adopted the taxpayer’s expert 5% discount which was based on analysis of the company’s operating agreement, capital market evidence, and consideration of relevant facts and circumstances. In contrast, the IRS’ valuation expert applied a 10% discount, but only to the non-operating assets of the business. In its rejection of the latter approach, the Court once again cited the lack of underlying supporting data and analysis.
- The experts applied similar (25% and 30%) discounts for lack of marketability supported by detailed explanations of their methodologies and conclusions. The Court found the methodology used by the taxpayer’s expert to be “slightly more persuasive.” The Court once more expressed concern that the IRS valuation expert relied on the 2017 Forecast. Of note, the Court’s finding in favor of the (lower) marketability discount proffered by taxpayer’s expert was actually adverse to the taxpayer’s overall position.
Conclusion
The material valuation issues in the Pierce case include the proper data to use in preparing a forecast, tax affecting pass-through earnings, and supporting appropriate risk factors and discounts to be applied in the valuation of closely held business interests.
The Court’s consideration of each issue underscores the importance of marshalling relevant data and presenting reasoned analysis in valuation reports.
All in the Family: X Corp. Merges with x.AI Corp.
Elon Musk Continues to Explore Corporate Governance and Fairness Boundaries
This presentation explores the fairness and corporate governance issues surrounding the March 2025 merger of x.AI Corporation and X Corporation, both controlled by Elon Musk. With a combined enterprise value of $125 billion, the stock-for-stock transaction raises questions about valuation methodology, board independence, conflicts of interest, and procedural rigor. Drawing comparisons to Musk’s past deals—such as Tesla’s acquisition of SolarCity and the leveraged buyout of Twitter—the analysis examines whether this latest “all in the family” merger meets the standards of fairness typically expected in transactions involving controlling shareholders.
Dividends and Shareholder Returns – A Ten-Year Lookback
Morningstar recently reported, given volatility in the equity markets, that U.S. equity funds and ETFs took in a relatively modest $5.7 billion in March 2025, of which $5.6 billion flowed into dividend growth funds. This investor preference for dividends caused us to reevaluate the role of dividends in bank shareholder returns.
An investor’s total return is a function of three variables:
- The stock price change over the holding period
- The cumulative dividends received
- The return on reinvested dividends. The market convention is that a dividend payment is reinvested in the issuer’s common stock. If the issuer’s common stock price increases after receipt of the dividend, this appreciation in value of the reinvested dividend will enhance the shareholder’s total return.
To simplify this analysis, we do not consider taxes.
A Middling Decade
In a period marked by moderate share price appreciation, dividends become a crucial component of shareholders’ total returns. As indicated in Table 1 below, the group of publicly traded banks generated a median total return of 114% over the 2014 to 2024 period, or a 7.9% annualized return. For the median bank, stock price appreciation was 59%, implying that the remainder of the median bank’s 114% total return came from dividends and the return on reinvested dividends.
Returns were rather pedestrian for several reasons.
- The median compound annual growth rate in earnings per share and tangible book value per share, excluding accumulated other comprehensive income, was about 7% over the 2014 to 2024 period. The impact of higher interest rates continues to weigh on banks’ earnings and, therefore, book value growth.
- Multiple compression also weighed on returns. As shown in the chart below, price/earnings multiples compressed between 2014 and 2024, while price/tangible book value multiples would have fallen to a greater extent absent the unrealized losses existing on securities portfolios.
Price/Earnings and Price/Tangible Book Value Multiples
Banks with Assets of $1 – $3 Billion & Return on Tang. Equity 7.5% – 15%
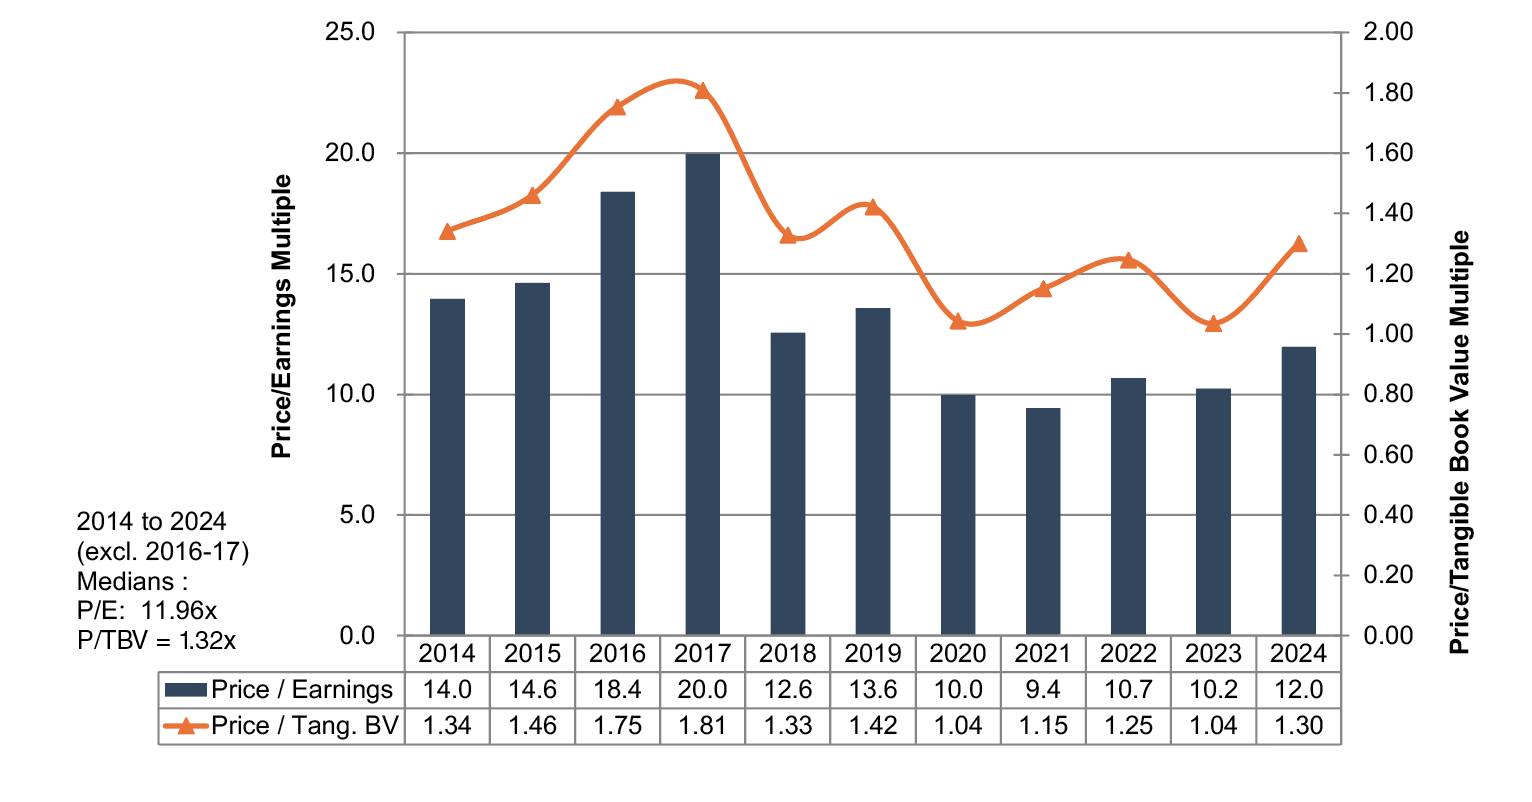
Dividends Make a Difference
In a period marked by moderate share price appreciation, dividends become a crucial component of shareholders’ total returns. As indicated in Table 1 below, the group of publicly traded banks generated a median total return of 114% over the 2014 to 2024 period, or a 7.9% annualized return. For the median bank, stock price appreciation accounted for 59% of investors’ total return, implying that the remainder came from dividends and the return on reinvested dividends.
Table 1
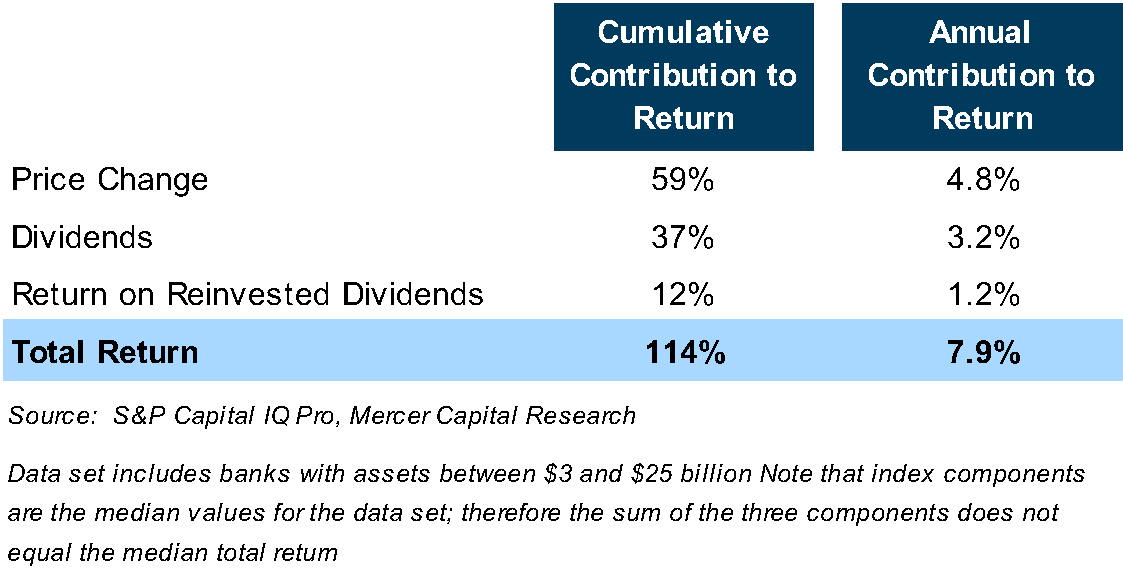
Table 2 stratifies the 120 banks included in the analysis by their total return. Almost one-half of the banks reported a total return between 50% and 150% over the 2014 to 2024 period, which equates to a mid to high single-digit annual return.
Table 2
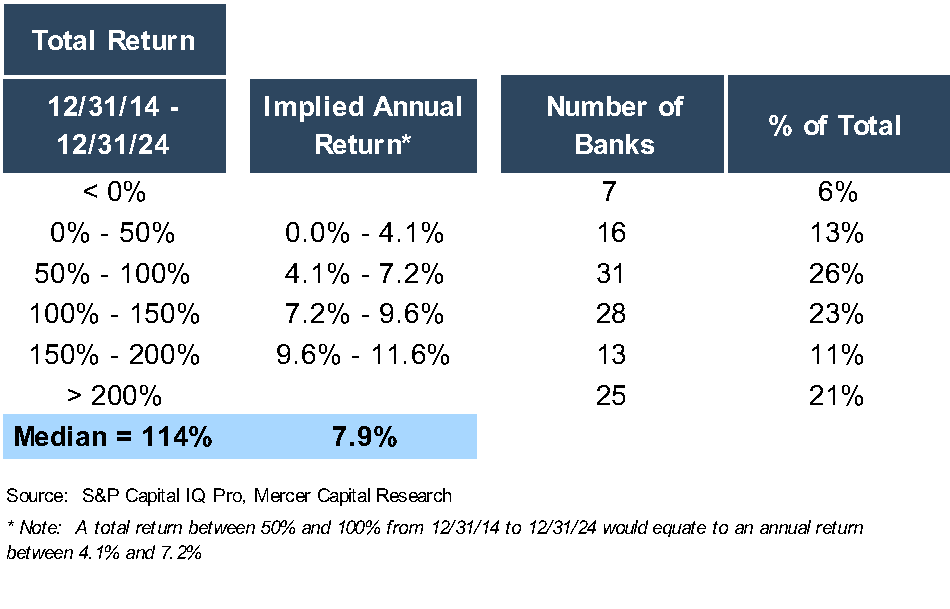
Implications
Does the impact of dividends on shareholder returns mean that bank management teams should immediately increase dividend payouts? Not necessarily, as markets reward growth in per share earnings and book value. Table 3 suggests that shareholder returns are negatively correlated with dividend payouts; that is, banks with the highest dividend payouts report the lowest shareholder returns. It is difficult to draw firm conclusions, though, as few banks in the analysis pay dividends of 0% or greater than 50%.
Table 3
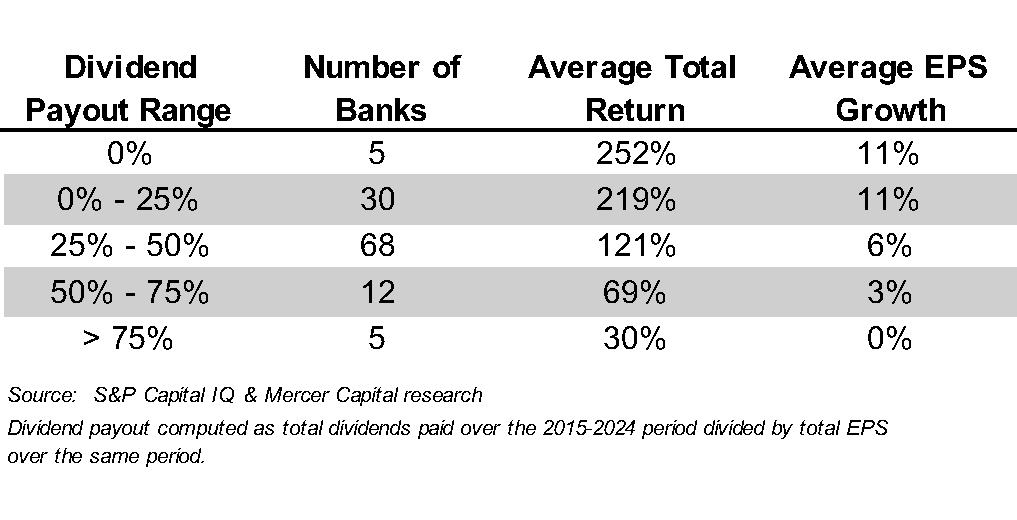
Figure 1 below compares dividend payout ratios and shareholder returns. The scatter plot suggests another factor influencing shareholder return: risk. Banks with low dividend payouts report widely dispersed returns, but returns tend to be more clustered for banks with dividend payouts in the 30% to 50% range. Dividend payout ratios are one way to estimate the potential volatility—and therefore the risk—of an investment, and investors want higher returns for assuming more risk.
Figure 1
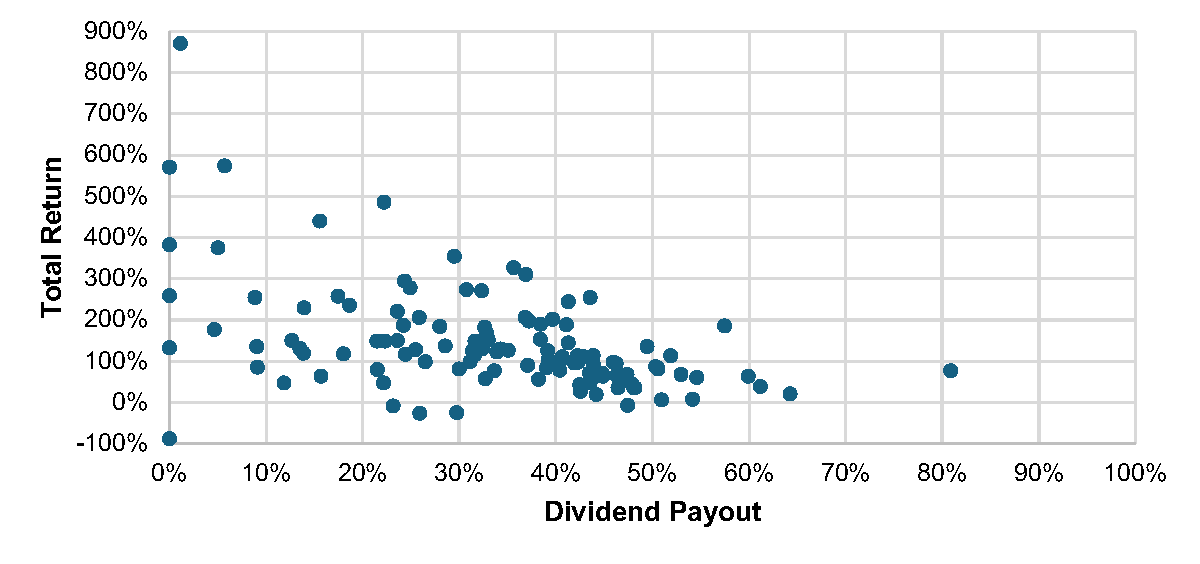
The relationship between shareholder returns and dividend payouts makes sense, as banks with high payouts often have fewer organic growth opportunities and, therefore lower EPS growth. Table 4 stratifies the data set by compound annual growth in EPS over the 2014 to 2024 period, whereby banks with the lowest EPS growth have the highest dividend payout ratios (and lower shareholder returns).
Table 4
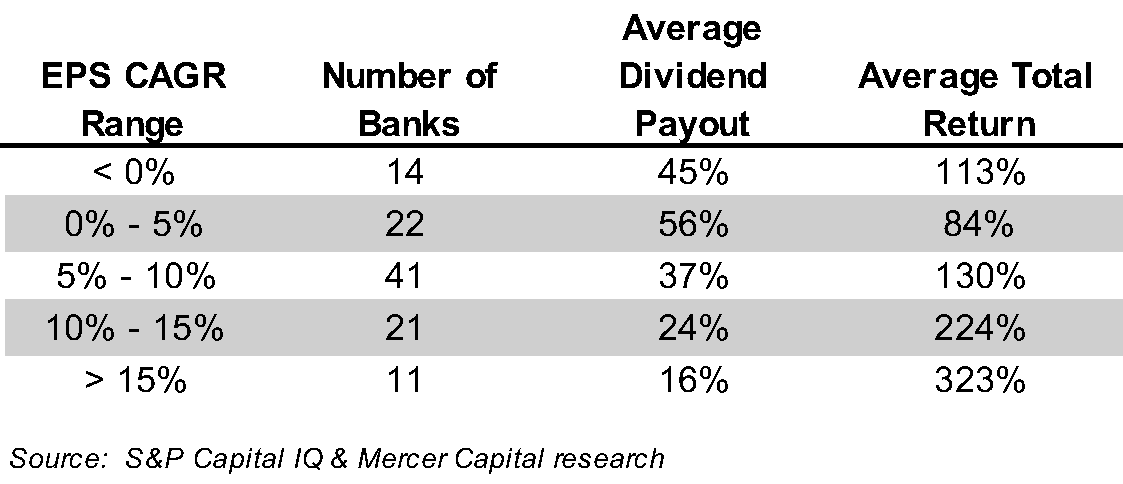
We also evaluated the relationship between the tangible common equity/assets ratio and dividend payouts. One may expect that banks with lower TCE/asset ratios have lower dividend payout ratios, but the data does not support this expectation. We note, though, that banks with excess capital, defined as TCE/asset ratios over 12%, tend to maintain higher dividend payout ratios. These banks can offer a relatively high payout, as well as maintain dry powder for opportunistic initiatives.
Table 5
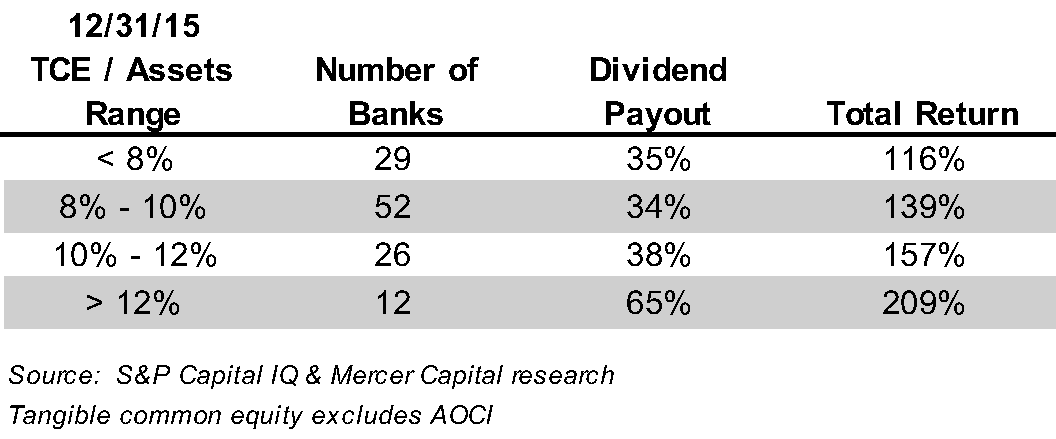
Conclusions
The analysis shows that dividends, while an important component of shareholder returns, do not necessarily drive shareholder returns. Our analysis includes 120 banks, and 60 have dividend payout ratios between 30% and 50%. With dividend payout ratios clustered in a relatively tight range, it is difficult to make fine distinctions about dividend policies and shareholder returns. The implication is not that a bank with low EPS growth likely will enhance its shareholder returns by reducing its dividend payout ratio.
Over a long period, we know that shareholder value is created by growing earnings per share, which leads to rising tangible book value per share. Earnings also enable the dividend policy. Most banks have recognized, though, that they can both invest in growth opportunities and provide immediate return to shareholders through dividends. In challenging market environments, as occurred over the last ten years, this capital management strategy provides a material source of shareholder return.
While BankWatch does not make investment recommendations, we noted a recent article in the Wall Street Journal regarding dividend investing. It proposed, with some historical support, sorting the S&P 500 into quintiles by dividend yield. The research suggests that the quintile with the highest dividend yield underperforms, as high yields often result from financial distress and suggest the risk of future dividend cuts. Rather, investors should invest in the quintile with the second highest dividend yield, which has been shown to outperform the S&P 500.
We replicated this investment strategy for our bank universe. We did find that banks with the highest dividend yields at year-end 2014 underperformed over the next ten years. However, we found no evidence that the second quintile outperformed
(Table 6).
Table 6
