This article first appeared as a whitepaper in a series of reports titled Appraisal Review Practice Aid for ESOP Trustees. To view or download the original report as a PDF, click here.
This publication provides general insight about emerging issues and topics discussed in recent forums and events sponsored by the ESOP Association (“EA”), The National Center for Employee Ownership (“NCEO”) and elsewhere. Much of the current discussion is related to general valuation discipline, but none are new to a longstanding agenda within the ESOP community. Heightened Department of Labor (“DOL”) attention and the recent settlement agreement concerning the Sierra Aluminum case are driving renewed discussion of numerous critical topics within the ESOP fiduciary domain.
All guidance, perspective and other information contained in this publication is provided for information purposes only. The issues and treatments highlighted in this publication do not produce the same response from all ESOP professionals and valuation practitioners. Certain treatments and perspectives contained herein lack consensus in the valuation profession and may be addressed or treated using alternative rationales. This publication is not held out as being the position of or recommended treatment endorsed by the EA or the NCEO. The purpose of this publication is to alert and inform ESOP stakeholders and fiduciaries regarding the rising standards of practice and prudence in the valuation of ESOP owned entities.
In recent years there has been increasing concern among ESOP sponsors and professional advisors (trustees, TPAs, business appraisers, legal counsel) regarding the scrutiny of the DOL, the Employee Benefits Security Administration (“EBSA”), and the Internal Revenue Service (“IRS”). These entities (and agencies thereof) are tasked with ensuring that ESOPs comply with the Employee Retirement Income Security Act (“ERISA”) as well as with various provisions of the federal income tax code concerning qualified retirement plans (including ESOPs). Citing concerns for poor quality and inconsistency in business appraisals, the DOL has sought in recent years to expand the meaning of “fiduciary” under ERISA to include business appraisers. In the most recent forums of exchange and deriving from various court actions, there are numerous areas of concern that DOL/EBSA appear to have regarding ESOP valuations. These areas of focus include but are not limited to:
These topics have received heightened attention from numerous committees of the ESOP Association including the Advisory Committees on Valuation, Administration, Fiduciary Issues, Finance, and Legislative & Regulatory. This paper will focus on the use of financial projections in ESOP valuations. While all of the cited issues are of importance, the use (or misuse) of financial projections is often the most direct cause of over- or under-valuation in ESOPs. Other Mercer Capital publications provide insight regarding control premiums, the market approach, and other important ESOP valuation topics.
Business appraisers who practice valuation using one or more credentials in the field are required to adhere to their respective practice standards (ASA, AICPA, NACVA, CFAI). Additionally, there are overarching standards and guidance that generally dictate to and govern the valuation profession and the general considerations and content of a business valuation. The Appraisal Standards Board of The Appraisal Foundation promulgates the Uniform Standards of Professional Appraisal Practice (“USPAP”) and the IRS issued Revenue Ruling 59-60 (“RR59-60”) more than 50 years ago.
Collectively, these standards and protocols provide a basic outline for procedural disciplines, analytical methodologies, and reporting conventions. Specificity on the disciplines and procedures for vetting a financial projection (and growth rates in general) are generally lacking in the body of valuation standards, but that does not exempt appraisers and trustees from the core principle that a valuation must collectively (and in its constituent parts) constitute informed judgment, reasonableness and common sense.
Traditional financial and economic comparative analysis suggest vetting a projection by way of studying it from numerous perspectives:
The answers to these questions provide the appraiser a foundation upon which to construct the other required modeling elements in the valuation. An appraiser may elect to disregard projections in the valuation process in situations where forecasted outcomes are deemed beyond the organic and/or funded capacities, competence, and/or opportunity of the subject enterprise. An appraiser may elect to consider justifiable risk and/or probability assessments, among other adjustments, that serve to hedge the projections and their respective influence on the conclusions of the valuation report.
Regarding valuation and the general concern for rendering valuations that heighten an ESOP trustee’s anxiety for a sustainable ESOP benefit over time, many appraisers elect to capture only proven performance capacity, avoiding the counting of eggs with questionable fertility. If today’s projection proves excessive in the light of future days (when the DOL/EBSA comes calling), the concern for a prohibited transaction rises and poses significant risk and potentially fatal consequences for the plan and the parties involved.
A complete, formal appraisal opinion requires the consideration of three core valuation approaches. These approaches are the Cost, Income, and Market Approaches. Generally speaking, valuations of business enterprises using the Income or Market Approaches contain either an explicit projection in the methodology or capture an underlying implicit projection embedded in (or implied by) a singular perpetual growth rate assumption or in a singular capitalization metric. Appraisers and reviewers that fail to recognize this are simply blind to the basic financial mechanics of income capitalization. Accordingly, the concern for projections, in the view of this practitioner, extends beyond the discrete modeling of cash flow to the broader domain of growth in general. For the sake of further discussion, assume the following comments relate specifically and only to the Income Approach and its underlying methods.
The size and sophistication of the subject enterprise often dictates whether or not an appraiser will enjoy the benefit of management-prepared projections. Projections are often crafted for purposes of promoting operational and marketing outcomes, or for satisfying the reporting requirements that many companies have with their lenders, shareholders, suppliers and other stakeholders. In cases where the subject enterprise is small and its performance subject to unpredictable patterns, appraisers commonly employ a single period capitalization of cash flow or earnings. In lieu of a series of discrete cash flows projected over the typical five-year future time horizon, the appraiser simply employs a measure of current or average performance and applies a single-period capitalization rate (or capitalization multiple as the case may be) in order to convert a base measure of cash flow directly into an indication of value. Seeking not to speculate on a finite sequence of future growth rates, many appraisers employ a rule-of-thumb mentality by correlating cash flow growth to a macroeconomic, inflationary, or industry-motivated rate, often ranging from 3% to 5%. In many instances this could be appropriate; in others it could reflect surprisingly little attention regarding the most basic long-term market externalities and/or internal opportunities of the subject company.
The veil of a single-period capitalization approach does not relieve the appraiser from examining the various combinations of growth that could reasonably apply to the base measure of cash flow assumed in an appraisal. Many appraisers are of the mind that in the absence of management-prepared projections, no discrete projection can be developed and thus no Discounted Cash Flow Method can be employed. In lieu of fleshing out the dynamics of operational cash flow, the required capital investments, working capital needs, or the cash flow benefits deriving therefrom, the appraiser simply defaults to the time-honored single period capitalization of cash flow and calls it a day. The binary position that an appraiser cannot prepare cash flow projections lacks credibility and in some cases is simply flawed thinking. Furthermore, any appraiser that applies a perpetual growth rate assumption to develop a capitalization rate is, in fact, asserting a projection over some projection horizon. This is the simple and inescapable mathematical construct that is the Gordon Growth Rate Model. With all due respect and concern about projections – appraisers, trustees and regulators must recognize the inherent projection represented by a perpetual growth rate assumption in a single-period capitalization method. In essence, there is no income approach without either an explicit or implicit projection of future cash flows.
Imagine you are a trustee tasked with reviewing an ESOP valuation prepared by the plan’s “financial advisor.” Business appraisers in their role as the trustee’s financial advisor issue opinions of value they believe to be supported by the facts and circumstances, but ultimately the appraisal of the plan assets is the trustee’s responsibility. How can the stakeholders and fiduciaries of an ESOP gain understanding and comfort in projections prepared by the Company and employed by the appraiser?
The foundation begins with the general process of examining historic and prospective growth. Company projections must make sense to gain inclusion in the valuation of an ESOPowned company. A disconnect or sudden shift (whether in magnitude, trend or directionality) in expected performance is a red flag that requires specific explanation. Absent a sound rationale for a significant change in the pattern of future performance, projections that seem too good (or too bad) to be true must be reconciled with management and potentially disregarded in the appraisal process.
Not all projections are created equally. Some are prepared for budgetary purposes and are constrained to a single year of outlook. Projections may be prepared for many reasons including the study of operational capacity, financial feasibility concerning capital investments, debt servicing and lender requirements, sales force management, incentive compensation, and many other reasons. Projections may be the product of a bottom-up process (originating in the operational ranks of the business) or may originate as a top-down exercise (descending from the C suite).
Business appraisers cannot be indiscriminate in their employment of forward-looking financial information. Understanding the goals, intentions, motivations, and possible shortcomings of a budget or projection is vital to assessing the viability of a direct or supporting role for the projections in the valuation modeling. The nature and maturity of the business are also significant to understanding and troubleshooting a projection. For the sake of further commentary we will assume that most ESOP companies are relatively mature and not subject to the intricacies and uncertainties of valuing a start-up business (albeit, even mature business can experience significant swings in business activity).
A bottom-up process whereby front-line managers project their respective business results, which are then combined to create a consolidated projection, is often the most informative projection. Motivation mindset can be important as many projections are designed to “under-promise” results. Conversely, some projections are deliberately overstated to impart a mission of growth or goal-oriented outcomes. Projections that emanate and evolve through multiple levels of an organization are typically subject to more checks and balances than projections that originate in the vacuum of a single executive’s office. Conversely, such a process can also depict an organizational mob mentality that could distort reasonable expectations.
A CFO’s budget may vary significantly from the sales projection of a sales manager or the projections of a senior executive. In some cases, an appraiser may review projections prepared for a lender that vary from a strategic plan projection. Often the differences can be reconciled. Projections prepared for external stakeholders such as lenders and as communicated to shareholders and possibly endorsed by a board of directors are likely to be the most relevant and appropriate for the valuation.
If numerous projections exist, the trustee and appraiser are best advised to inquire about the outlook that best reflects a consensus of the most likely outcome as opposed to aspirational projections that are tied to new and/or speculative changes in the business model. In a recent engagement, a client was deploying significant capital to extend core competencies into adjacent markets. Rather than the hockey stick of growth most typical of such projections, this client’s net cash flows were relatively neutral in the foreseeable future because they included significant capital and working capital investment, which effectively paid for increased business volume. The premise behind their strategy was simply one of being larger and more diverse under the assumption that size and diversity facilitated a less risky business proposition and a broader range of potential long-term outcomes for the business.
Functional use is often linked to who prepares the projection. Be wary of projections that may intentionally (or as a byproduct of purpose) under or over shoot actual expected forecast results. In many cases a bottom-up projection process receives the review of senior management before becoming a functional element of business planning and accountability.
Are past projections reconciled to actual results with adequate explanation for variances? Firms with consistent and organized processes often produce more informative projections. Granted, a company may consistently under or over perform their projection. The quality of a projection may be better measured by its consistency over time than by its ultimate accuracy in a given year. One clue to the experience and care taken in the projection process is the model underlying the projection itself. For example, was the forecast model developed using numerous discrete modeling assumptions (such as year-to-year growth, and year-to-year margin) or from more global assumptions that are carried across all years in the projections? While modeling complexity can serve to obscure and is not automatically a sign of a well-developed projection, the inability of a projection model to be adapted quickly to alternative scenarios and assumptions may be a sign that the model was not studied for its sensitivity and reasonableness. A projection that appears to be “living” and easily modified could be a sign that the company actually uses the projection and modifies it in real time to assess variance and to modify assumptions as business conditions evolve and change. Appraisers and trustees should empower themselves with the ability to study the sensitivity and outcomes of a projection. Projections that lack detailed growth and margin details (year-to-year and CAG) should be replicated and/or reverse engineered in some fashion to facilitate basic stress testing and/or sensitivity analysis before the appraiser simply accepts the projections.
In general, valuation standards call for the consideration of all known or reasonably knowable information (financial, operational, strategically or otherwise) as of the effective date of the appraisal, which for most ESOPs is the end of the plan year. As a matter of practicality, financial statements (audits and tax returns) are not prepared for many months subsequent to the plan year end. Likewise, projections are often compiled in the first few months of the following year and may be influenced by the momentum of activity after the valuation date.
Appraisers typically cite financial information delivered after the valuation date to be known or knowable and projections, while potentially exposed to a hint of subsequent influence, are often integrated without much question regarding their timeliness to the valuation date. In many cases, clients struggle to get information to us in order for their 5500s to be filed in a timely fashion (typically July 31st). In most cases we find that projections prepared after the end of the plan year are perfectly fine to employ. We inquire with management if there are aspects of the projection that were influenced by subsequent events and if so, with what degree of certainty could the subsequent event or activity have been expected at the valuation date. In some situations it may be advisable or reasonable to alter a projection’s initial year due to subsequent influences; typically the more distant years of a projection follow a pattern of knowable expectation unless there has been a material subsequent event that alters the global posture of the business. If a material subsequent event occurs that is not factored into the projections, then as a matter of common sense, the appraiser may elect not to perform a DCF, or better yet, may request that the projections be modified to take the event into financial consideration so that a DCF can be more accurately informed regarding changes in business posture.
If a projection reflects a pattern of significant change in business activity, it is vital to consider whether new business represents an extension or replication of past expansions. If the company has proven the ability to expand and absorb new business (territory, staffing, productive capacity, etc.) then a projection depicting such an increase is likely reasonable, but should be gauged by past similar experiences whenever possible. And, any business expansion must be reflected in the investment and working capital charges applied to develop net cash flows. We refer to this as “buying the growth” – remember there is no free lunch.
Projections with significant topline and profit growth must reflect adequate investment. This investment may take the form of the organic investment in the existing business lines or strategically by way of acquisition. If the projections include a speculative expansion into new revenue areas, the appraiser should properly assess the likelihood of successfully achieving the projection. Business extensions into logical adjacencies which leverage pre-existing supply and customer relationships may be more believable than the widget company whose projections include entry into the healthcare industry.
In cases where projections include speculative ventures, the appraiser has numerous potential treatments that can temper speculative (high-risk) contributions, essentially replicating the framework applied in the valuation and capital raising processes for start-ups or early-stage companies. In some cases the appraiser may request the projection be revised to eliminate contributions from new growth projects that lack adequate investment or are simply too speculative to consider until they become observable in the reported financial results of the business. In some rare cases, not only is the projection hard to believe, but concerns are compounded by the risky and foolish deployment of capital. Betting the farm on the next reinvention of the wheel is not the making of a sustainable ESOP company.
Perhaps it’s a dirty little secret in the hard-to-value world of closely held equity, but valuations using the standard of fair market value (as called for under DOL guidance) are inherently lagging in nature and typically less volatile than is the stock market or the public peers to which a company may be benchmarked. This is generally a function of regression to the mean captured in virtually every conservatively constructed projection and DCF model. The terminal value of a DCF is effectively a deferred single period capitalization using the Gordon Growth Model and often comprises 50% or more of the total value indicated under the method. Near-term performance swings (whether favorable or not) get smoothed out in the math of the terminal value calculation. As depicted in the appended growth scenarios and projection modifications, the regression of future performance to a targeted benchmark can have a similar influence on valuation as the old-guard habit of using historical averages in a single period capitalization method. The primary valuation differences between such a DCF and single period capitalization stem from the specific cash flows during the discrete projection period (years one through five).
A sound reason for employing a DCF model is to capture the pro forma performance of a business based on its going-forward revenue base. Most mid to large sized businesses, particularly mature ESOP companies, experience contraction and rationalization of business lines and markets over time. In many cases, the valuation might reasonably improve based on the discontinuation of unprofitable operations and the recapturing of poorly deployed capital. However, care must be taken to understand how all P&L accounts from revenue down to profit are affected by changes in facilities, products, services, staffing, etc. Projections that pretend unsupportable improvement by way of the deletion of a relatively small portion of the business lines are inclined to excessive optimism and may suggest the belief in bigger issues that management deems too daunting to fix. Regarding profitability, so-called “addition through subtraction” is similar to the concern public market investors have with public companies that cut expense merely to manufacture earnings in the near term. As the maxim goes, you can’t cut your way to success in the business world.
Financial projections that lack an operational perspective can be difficult to assess. Not all business are margin based, many are spread based – meaning that profits are more of a function of a nominal spread over cost as opposed to some percentage of sales. This is particularly true of service businesses, financial services entities, and commodity driven operations. Accordingly, neither past nor future performance can be properly understood without some idea of how much stuff is getting sold and at what price. In many cases, the required comfort level of a projection simply cannot be reached without it. Breaking revenue into primary volume and price components, as well as further into its departmental or categorical groupings, allows appraisers and trustees a better understanding of the projection and its relation to past performance and market expectations. Revenue per full-time equivalent employee, units produced per labor hour and many other performance metrics are helpful in teasing out reality from a potentially fictional projection.
Our comments here exclude the consideration of risk associated with high levels of concentration on the rain-making parts of a business – such considerations are often tackled in the appraiser’s assessment of the cost of capital by way of firm-specific risk.
Many dealerships, distributors, parts manufacturers, fabricators and service companies owe their existence to market demand created by their suppliers and customers. Many companies service the needs of customers and suppliers by effectively outsourcing some aspect of their respective industry model to an external provider. For example, a producer of value-added materials may use an external company to provide sales and logistical support to get product to its end users (i.e. classic bulk breaking, repacking and transportation). Regardless of which leg of the multi-leg industry the subject business may represent, the assessment of projected growth should include a consideration of what is happening to suppliers and customers (the other legs of a common stool). This same path of inquiry serves the dual purpose of understanding the risk side of the valuation equation. If these multiple legs of consideration don’t reconcile, the projection could prove too unstable for use in the valuation.
Studying projection variance can be a highly useful tool in communicating about value and in assessing the correlation between expectations and actual results. Let’s face it – we all like it when people do what they say they are going to do. But the first thing we know about any projection today is that it will be wrong tomorrow. Variances need to be explained and reconciled against the continuing willingness of the appraiser (and the trustee) to employ projections moving forward. Providing financial feedback to management and the trustee during the process of due diligence and in the form of a valuation can help refine the projection process over time. Just as we reserve the right to improve how we do things in the valuation world, so too must our clients have the leeway to refine and improve their processes.
Valuation is a forward looking (ex-ante) discipline. History can be highly instructive regarding how projections are scrutinized in real time. Projections that under-promise and over-deliver tend to undervalue companies in real time. Conversely, projections that over-promise and under-deliver can lead to an over-statement of value. In the case of the later occurrence, most appraisers operate under the axiom of “fool me once shame on you, fool me twice shame on me.” Ultimately, attempts at value engineering via optimistic projections need to be balanced with an equal measure of devil’s advocacy from both appraiser and trustee. Ultimately, a DCF model views the impact of any projection through a risk-adjusted lens. The process of hedging a projection generally begins with an observation of historical variances in projected performance and actual results over time, with the primary emphasis place on most recent periods. Projections that appear to overshoot are often hedged either through risk assessment, probability factoring, or a more exotic multi-outcome analysis.
In recent decades the concept of the traditional five-year business cycle lost favor in some circles. Thought evolution evolved to encompass a lengthier cycle of ten years, mitigated volatility (not so high and not so low as in the past), higher fundamental causation (such as globalization) versus the classical cyclical drivers (such as swings in productivity), continuing evolution of the information sector, disruptive technologies, and since the early 2000s, the persistence of and sensitivity to geopolitical and terrorist events. Then along came the debt crisis followed by the great recession. Lessons of business cycles past have now garnered renewed attention and distant economic history seemed more relevant despite the modernization, globalization and regulation of the economy.
Presently, we are witness to a reasonably stable economy that is slowly being weaned from years of fiscal and monetary life support and subsidization. For us business appraisers, we are beginning to lock in on the new norms of our clients’ businesses. For the last many years, our clients were reticent to speculate on a projection (“no visibility”). Many clients recall with anger and humility the great glory projected from atop the last peak cycle in 2006. Almost a decade later, many have finally re-achieved their former glory. Many others can only look up from the corporate grave. From this point forward we can only assume that some version of the business cycle is still with us. Many are now disposed to the concept of a prolonged period of relatively modest and unevenly distributed economic performance, similar to the patterns demonstrated by Japan and characterized as “secular stagnation.” The academicians can argue about how to brand it; valuations professionals and ESOP Trustees are faced with how to consider it in our valuations.
Speaking from personal experience, there is a greater appreciation for industry cycles as opposed to macroeconomic cycles. Given such, we see companies vacillate between boom and bust based on numerous underlying elements and drivers that are not purely correlated to the overall economy. Recall the classic business cycle (peak / contraction / trough / expansion / peak). Appraisers and trustees must be attentive and weary of projections that cannot be supported by reasonable facts and circumstances. Some may wonder – when are projections unrealistic? The truthful answer often includes the echo: “not sure, but I know it when I see it.”
Companies emerging from the trough of a business/industry cycle may have unusually robust projections. High growth during a period of recovery does not constitute grounds for the dismissal of the projection. Likewise, declining growth from a peak level of performance is not necessarily overly pessimistic. As discussed in the growth scenarios studied in the appended examples, regression to a mean level of future expectation can be achieved in varying ways. The concern for appraisers and trustees alike is the comfort and common sense of near-term expectations relative to recent performance and the level of steady-state performance assumed in the terminal value modeling of the DCF. Ex-post and ex-ante trend analysis, as well as benchmarking to relevant indices from both public and private sectors is vital to establishing the context of a specific projection.
On the weight of evidence and common sense, if a projection is highly contrary to external expectations and lacks symmetry with the proven capabilities of the company, appraisers and trustees are cautioned from directly using the projection. An alternative approach for employing the projection is iterating the discount rate and terminal value modeling assumptions required to equate the DCF value indication to value indications developed from other methods (past and present). There are many instances when data lacks reliability during a given period or cycle. In such cases we tend to study the information and reconcile it to the alternative valuation results deemed more reliable. In this fashion we alert the report reviewer that projections exist that may appear contrary to the weight of history and/or external expectations.
Are the projections lacking detail and limited in supporting documentation? Projections that are not integrated into a full set of forward looking financial statements and that lack explanation for critical inputs may be unreliable or require significant augmentation before being integrated into a DCF valuation model. As a matter of practicality, many companies do not project more than a simple income statement. Does the lack of a balance sheet and a cash flow statement automatically exclude the projection from consideration? Not in my view, however, under many circumstances there could be a need for augmentation to consider numerous significant aspects required to develop the typical DCF model. These considerations include:
Collectively, these cash flow attributes can have a significant effect on the discrete cash flows of an entity during the projection. Absent a balance sheet and/or cash flow statement, the impact of these considerations may be difficult to properly assess. In cases where the business is not deploying significant new capital and the projection is following a more or less mature pattern, capital expenditures and incremental working capital may be easily determined based on historical norms and comparative analysis with peer data. Accordingly, a full detailed projection of the balance sheet may not be required to develop reasonable modeling and outcomes. As always, a vetted and complete projection of the financial statements is desirable.
Supporting documentation can take numerous forms. Reconciliation of modeling assumptions to external drivers, operating activities, market pricing, throughput capacity, supplier expectations and trends, bellwether industry peers and market participants, downstream and upstream expectations and many other supporting considerations is always helpful but generally lacking for many projections. Often, a review of the projections using such benchmarks leads to a modification or adjustment of the projections by management. In this fashion, the appraiser’s and/or trustee’s review serves to effectively adjust the projections before and/ or during their use in a DCF model – thus the need for a flexible and adaptive modeling platform built from the projection.
A baseline for assessing reasonableness or believability is always a good first step. A graphic representation of revenue, EBITDA and key volume measures can assist a reviewer in studying the reasonableness of a projection. Supernormal and/or counter-trend activity requires a compelling justification. Let’s use the information in the following graphic as a baseline for demonstrating some fundamental curiosity and addressing some basic questions regarding reasonableness.
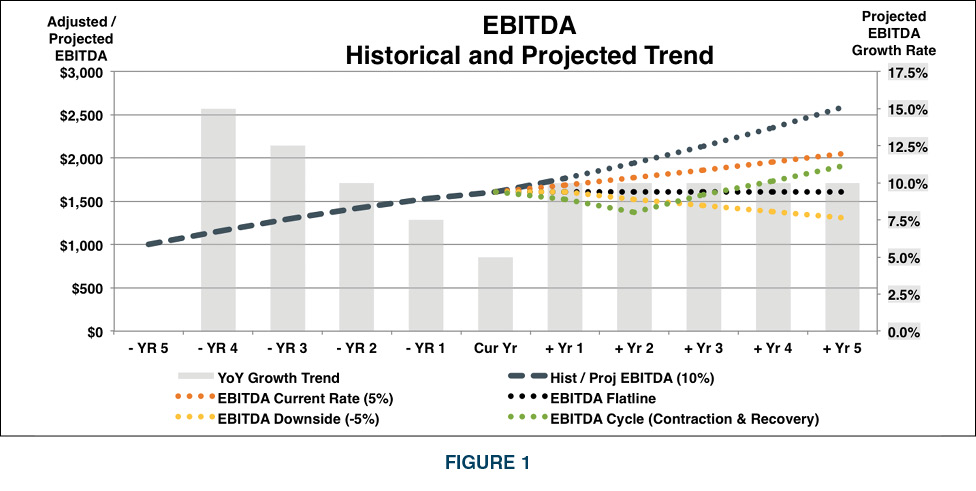
The five-year trend for adjusted EBITDA at the valuation date reflects a pattern of strong growth (illustrated by the dotted blue line in Figure 1), but at a decelerating rate (illustrated by the columns in Figure 1). The projected annual growth rate for each of the next five years is 10%. In this case, management represents that the 10% annual growth projection is based on the compound annual growth rate for the five years leading up to the valuation date. This is an all too familiar “technical” rationale for growth forecasting. However, it begs the question of why the decelerating trend would suddenly flip favorable as opposed to continuing its decline or perhaps stabilizing at the most recent level of modest growth. Of course, the current trend could mature as a contraction in performance before an upturn that repeats the prior cycle.
Figure 1 depicts a wide variety of plausible alternative projections based on a technical review of the trend and a healthy dose of analyst scrutiny of management’s optimistic projection. The projection provided by management could easily be an order of magnitude overstated relative to other plausible outcomes. If EBITDA growth remains at the most recent rate (5% annually) then management’s projection is overstated 25% by year five (the orange dotted line). If EBITDA flatlines at current levels management’s year five projection is overstated by 60% (the black dotted line). If the deceleration of growth actually turns to a steady contraction (5% annually) then management’s projection is almost 100% overstated. If a modest near-term contraction is followed by a renewal of the previous growth cycle (the green dotted line), then management’s base 10% annual growth projection is overstated by 35% in year five. We could iterate infinite variations in future outcomes, but I submit that the variations shown above stem from a reasonable risk averse, conservative framework. The real concern is how well the projection reconciles to external and internal drivers that have proven to influence past business outcomes and/or drivers that are virtually assured to influence future outcomes.
In the present case example, the platform of management’s projection is built on the prevailing economy (generally favorable but inconsistent growth) and involves a market-beta industry (highly correlated to the overall economy). More specifically, the subject company is a construction contracting concern whose early growth began from a deep trough in the cycle, then was temporarily juiced with shovel-ready government funded activity which eventually dried up as the general economy stabilized. New norms are uncertain but project budgets and financings are expected to be more difficult as real interest rates become more than zero and underwriting hurdles remain quite high. In this light, a simple extension of the five-year CAG into the future for five more years appears to ignore the decelerating trend. Absent specific contracts and backlog, industry-based drivers, and perhaps geographic hotbeds of significant in-migration, management’s projection outcome appears over optimistic if not outright aggressive.
Projections that appear contrary to external trends and opportunities and which are not reconciled to the company’s capacity (whether existing or planned with the associated capital required) may need to be disregarded in the valuation process. Alternatively, the appraiser and trustee could view the projections with heighten concern for their realization and elect to effectively hedge the projections using appropriate discount rates, probability assessments, or other treatments that mimic the behavior of hypothetical investors. Ultimately, the reliance or weight placed on a projection based valuation method demonstrates the comfort of the appraiser/trustee with the method. If the final weights or reliance are placed on alternative valuation methods with materially different value indications than the DCF, the appraiser/trustee is effectively disregarding or modifying the projection. Surely, every valuation conclusion, under any valuation approach or method, has an underlying implied projection through which the same value outcome is produced.
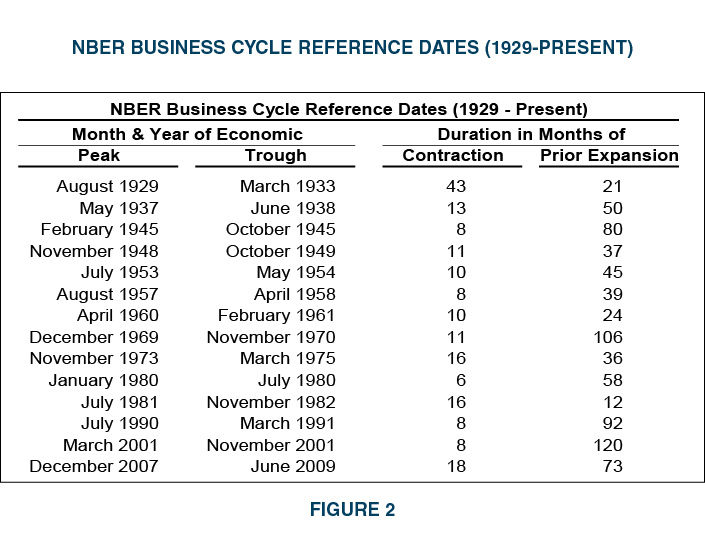
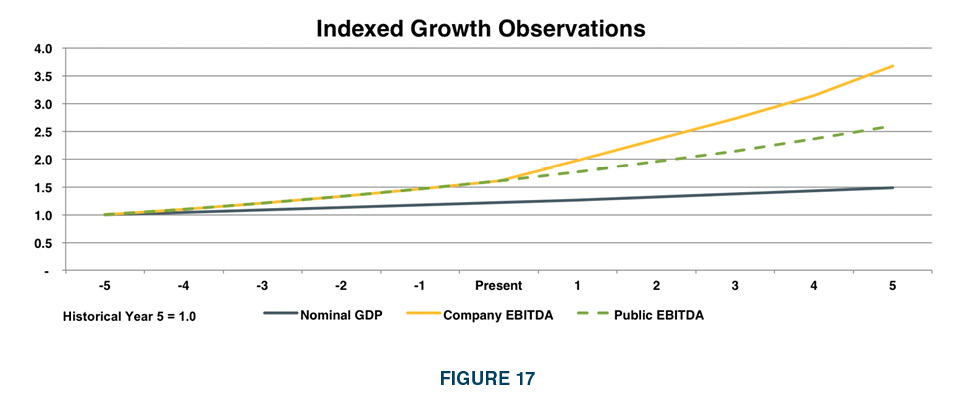
Assuming a company’s growth and/or projected financial performance is highly correlated to general macroeconomic growth is often an underpinning of long-term sustainable growth rates. Care must be taken when observing data reported from government agencies as such data can be “real” or “nominal” in quantification. Real rates are generally representative of movements net of the influence of inflation and nominal growth is generally total growth including inflation. Accordingly, growth rates in valuations that mirror inflation are effectively zero real growth rates. Gross domestic product is almost always reported and discussed in real terms, meaning the addition of a long-term inflation rate is typically called for in cases where the appraiser/trustee considers a company’s performance to be similar to that of the overall economy. For perspective, Figure 2 presents the history of economic cycles and the more recent performance of real GDP over the last several years (Figure 3).

On the basis of inflation of approximately 2.5% in recent years, nominal overall economic growth has approximated 4.5% to 5% subsequent to the great recession. Ah, the rule of 5% +/- for growth. There is a wide variety of alternative economic measures and subsets of GDP that could serve as a proxy for long-term sustainable growth in most valuations. Of course, such growth rates may fail to capture all the underpinnings of a given industry or market and may also fail to recognize the specific financial and operational details of a given company. Most companies tend to grow in phases as capital investment, hiring, product offerings and other business attributes evolve over time. This discussion could extend to an infinite spectrum of data and benchmarks.
Appraisers employ various tools and data resources to determine the appropriate cost of capital for use in a valuation. Employing a bit of analytical deduction using the disciplines of the Capital Asset Pricing Model and the Gordon Growth Model, one can observe some tendencies regarding the markets’ implied earnings growth expectations. One of the most frequently employed resources is the annual Morningstar/Ibbotson SBBI publication. Given this data, and an assumed range of price-to-earnings ratios, one can deduce the implied perpetual earnings growth rates embedded in the market’s pricing over time. This framework can be applied to a specific company, a group of companies, or an industry. The example in Figures 4 and 5 demonstrates market-based influences regarding analyst predispositions about earnings growth over time. As with other tools and sensitivity analyses in this publication, changes to the inputs can result in significantly different outputs.
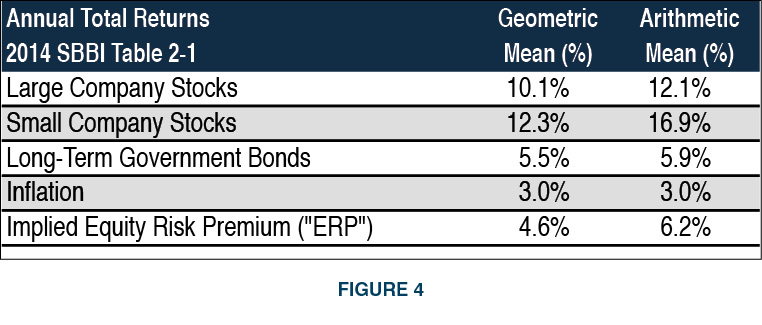

Relative to the growth dynamics of the different sized public companies depicted in the preceding table, it’s no wonder that the closely held, mostly mature, mid-market companies typically seen in the ESOP world (with enterprise values ranging from $10-$500 million) are imbued with net cash flow growth rates on the order 3% to 5% in the appraisal process (the “comfort zone” ). However, the timing of growth during the projection can be significant to a DCF value indication and can also influence growth rates in single-period capitalizations to measures outside of the comfort zone.
By convention, virtually all business valuations include a presentation composed of five years of historical financial performance. Depending on the nature of the underlying financial reporting of the sponsor company, the presentation will include balance sheets, income statements and cash flow statements. The notes to the reported financials may also contain a myriad of underlying detail and disclosures supporting the chart of accounts displayed on the core financial exhibits. Commonly, these financial exhibits are augmented with derivative analysis to study the common size (percentage of assets) balance sheets, common size income statements (historical margins expressed as a percentage of revenue), financial ratios, peer/ industry data sets, and year-to-year and compound annual growth rate measurements.
The foundation for studying the reasonableness (or believability) of a forecast derives from a firm grasp of the relevant history of the subject enterprise. The reported financial statements are often recast to reflect the proper historical base from which most projections are cast. Ultimately, the valuation methodology captures the adjusted, pro forma financial performance and position of the company that serve as the appropriate base from which forecast results are projected to emerge.
Financial history is not the only context for vetting projections. To the extent possible, the financial exhibits should be annotated and/or augmented with operational data (and graphics) that allow the appraiser to demonstrate and consider how the company’s activities relate to its financial performance. In addition to common size financial data, revenue and profit segmentation can be critical to understanding what aspects of a business are performing well and what parts are hindering results. In addition to perspectives on revenue mix, the report should also reflect a functional unit volume analysis that promotes an understanding of how pricing and activity volumes drive revenue and profitability. In turn, these observations help inform the appraiser about the physical capacities, break even levels, labor resources, and other aspects of the business model and operational flows that should dove-tail with the projections.
For example, if a projection implies that a business will exhaust its current operating capacities or markets, then an adequate and properly timed charge to cash flow for capital expenditures should be included in the forecast to promote continued growth. Otherwise, little or no growth (beyond the price component of revenue) should be reflected in the model. Additionally, the duration of the discrete forecast should span the number of periods required for the company’s operating and financial performance to reach a reasonable normative state from which a steady level of continuing performance can be expected. Thus, a five-year projection may require augmentation of a few periods to regress a high-growth model to a mature state, or a negative growth model to a new state of sustainable performance. Ultimately, the timing of when growth occurs can be an important value determinant in a DCF model as well as a vital consideration to developing a perpetual growth rate for cash flow.
When assessing a perpetual growth rate assumption, which is required in a single-period capitalization of earnings or net cash flow, one key to estimating a reasonably correct growth rate is an understanding of the internal and external factors that drive the assumption. While some appraisers are of the mind that projections cannot or should not be developed by an appraiser; surprisingly there is no debate as to the requirement of postulating a perpetual growth rate. These seemingly different disciplines are in fact one in the same. Arguably, an appraiser seeking to quantify or justify a perpetual growth rate must employ elements of the DCF mentality to define what that growth rate should be. Of course, the base amount of the cash flow is a vital starting point. For those appraisers who gravitate to the 3%-5% perpetual growth rate range, the use of a multi-period cycle-weighted historical average of cash flow can create a significant error in the valuation.
Let’s construct a simple example to demonstrate the valuation issues that could result from two different historical conditions that have the same average of performance. As crazy as it may be in practice, it is not uncommon for appraisers using multi-period averages to effectively ignore prevailing conditions and use a nominal long-term average growth rate that is correlated to GDP or some other prominent macroeconomic or industry performance measure. This mentality renders real time trends and real time expected directionality in performance as irrelevant. The following example is engineered to demonstrate how far astray the mentality for averaging and the failure to model growth can lead the valuation.
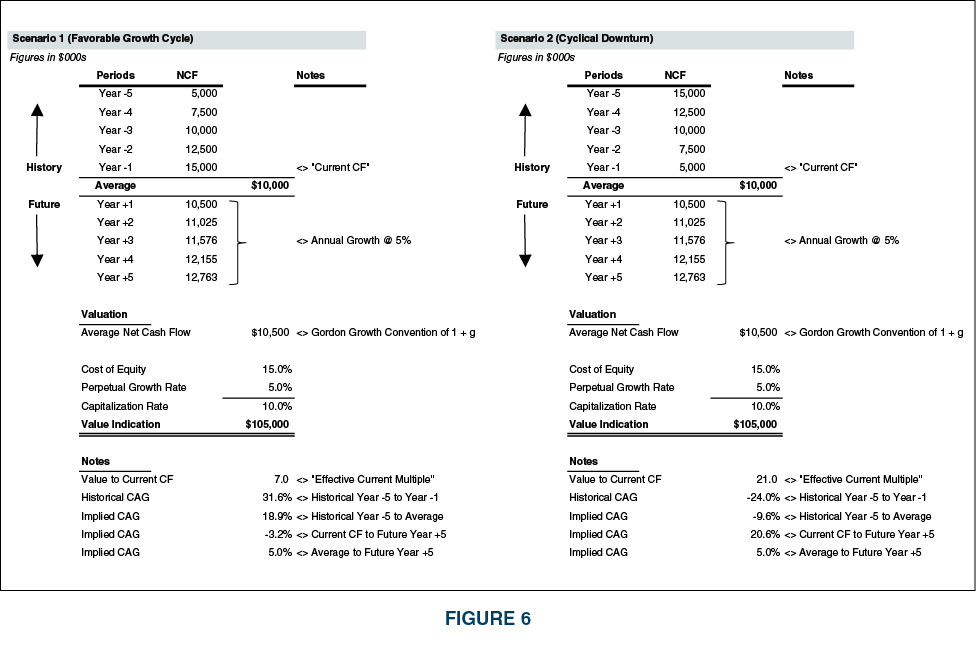
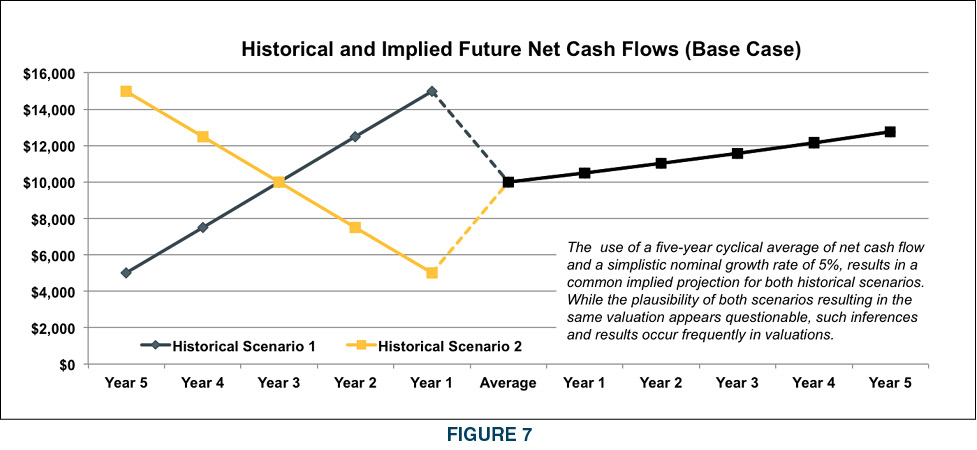
As can be seen in Figure 6, relative to the common valuation of $105,000, Scenario 1 represents undervaluation by approximately 30% (10 x $15,000 = $150,000) relative to recent annual performance, while Scenario 2 reflects an overvaluation by over 100% (10 x $5,000 = $50,000). More disturbing than two quite different trends giving rise to a common valuation of $105,000 is the spread of the value range from $50,000 to $150,000 derived from the “Current CF” measures of each scenario. Which valuation is more reasonable? Are there alternatives to modeling growth that represent more plausible projections or growth rates?
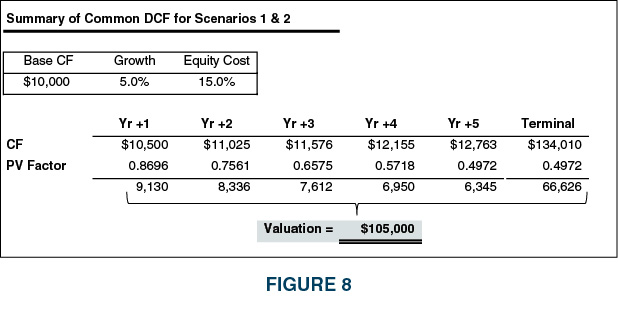
As can be seen in Figure 8, a valuation of $105,000 is derived from the two distinctly different historical scenarios. How might alternative projections be modeled that provide an enhanced perspective from which to study a reasonable perpetual growth rate for each scenario? Frankly, most seasoned valuation professionals would admonish the appraiser in each of the example scenarios for failing to study a projection that “engineers” the prevailing cash flows from their current respective conditions to an assumed cycle-neutral point five years hence. Simultaneously, how could a discrete projection be modeled that develops the value associated with a series of future cash flows that reconciles to a reasonable steady-state measure of cash flows and forward growth?
Taking Scenario 1 first, the five-year average cash flow ($10,000) results in a measure of cash flow well below the current performance ($15,000). What might a superior path of analysis be to capture the concern that current performance is unsustainable in the near-term? Substituting the implied growth rate of cash flow resulting from the assumed perpetual growth rate of 5% and a base average of $10,000, one might postulate a more believable pattern of performance and valuation as in Figure 9.
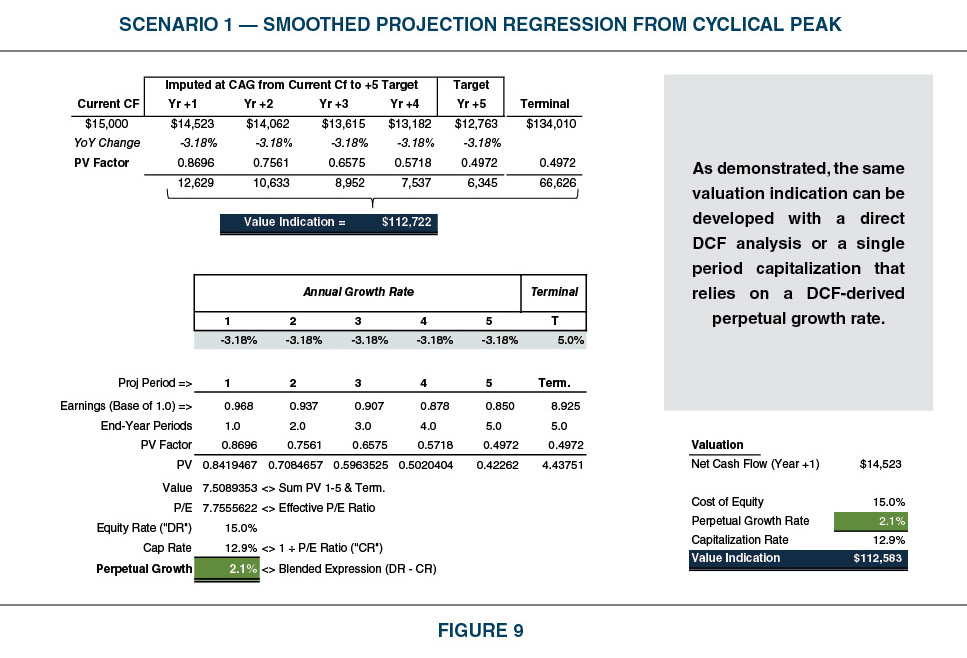
Note that the year five CF is determined as the same amount ($12,763) ultimately reached in both implied forward cash flow scenarios using the 5% perpetual growth from the base average cash flow of $10,000. An alternative modification to the original implied projection would be to regress the current cash flow performance ($15,000) to the forward year five adjusted base ($10,000 x 1.055 = $12,763). The valuation resulting from the modified projection is 7.4% higher due to a less abrupt decline than the default first year drop from $15,000 to $10,500. While this is not a radical percentage difference in the valuation, the alternative smoothed projection is a more intuitively appealing and believable model. Such a construct allows for analysis to support the development of a growth rate applicable to the cyclical high Current CF of $15,000. Using the following proof we can devise a perpetual growth rate that will reconcile the Current CF to a similar adjusted valuation of approximately $113,000.
Based on Figure 9, a growth rate of approximately 2% could have been reasonably applied to the Current CF ($15,000), lending enhanced credibility to a single-period capitalization than using 5% against the multi-year average performance of $10,000. The original, default approach used by many appraisers represents a 50% immediate first year disconnect from prevailing performance that lacks a reasonable basis. This is not to say that some circumstances don’t call for an abrupt shift in assumed cash flow versus prevailing cash flow, but that is typically a fundamental issue such as the loss or gain of a significant product, territory or customer. Too often this type of flaw is the result of the default five-finger rule to averaging five years of cash flows and using a 5% growth rate.
Repeating the previous exercise for Scenario 2 results in Figure 10.
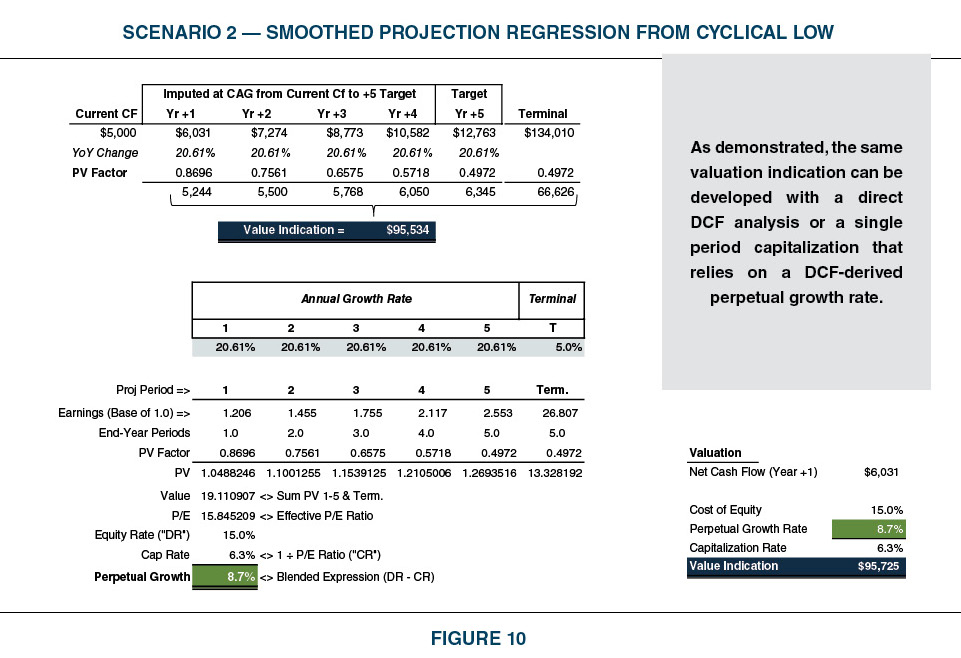
Based on the example in Figure 10, a growth rate of approximately 8.7% could have been reasonably applied to the Current CF ($5,000), lending enhanced credibility to a single-period capitalization than using 5% against the multi-year average performance of $10,000. Again, this is not to say that some circumstances don’t call for an abrupt shift in assumed cash flow versus prevailing cash flow, but such a scenario is typically a fundamental issue such as the loss or gain of a significant product, territory or customer.
Now that both of the implied projections have been modified to reflect more gradual regression to a mean level of assumed stable performance and sustainable future growth, the valuations reveal differentials from approximately 7.2% higher to 8.9% lower relative to the $105,000 derived from the default valuation mentality often employed. More significantly, the respective valuations are better suited to the prevailing cash flows and the expected directionality of performance. Each model now reflects a more thoughtful consideration of the time value of money.
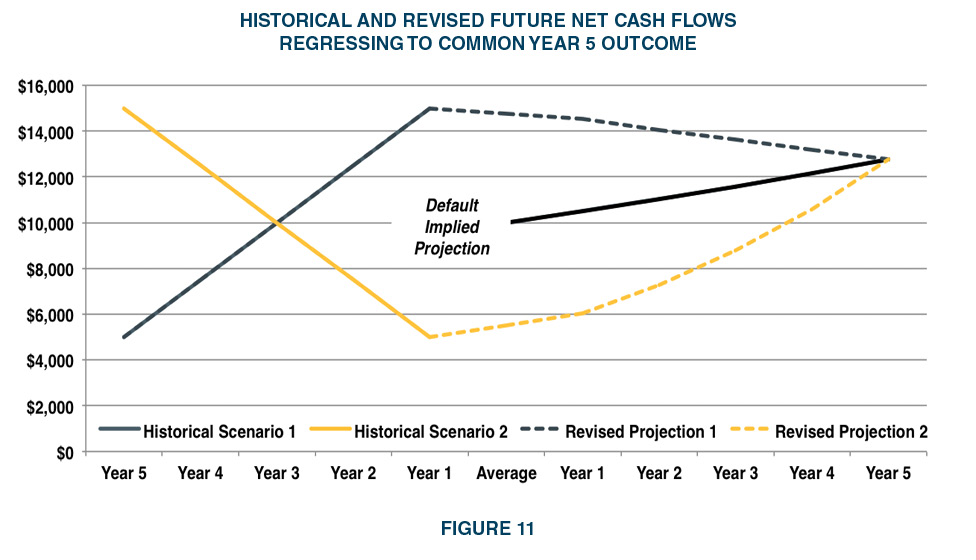
Figure 11 shows how the respective projections for each scenario converge on an estimated cyclically neutral level of future performance. The respective valuations, either in the form of a DCF or in the form of a single-period capitalization, are refined to capture the time value of money corresponding to a more believable performance regression/progression forecast. It should seem logical that the refined projection showing a gradual decline (Scenario 1) that starts with an above historical average level of performance, results in a higher value than the original $105,000. Likewise, the increasing projection (Scenario 2) that starts with below historical average performance results in a lower valuation than the original treatment.
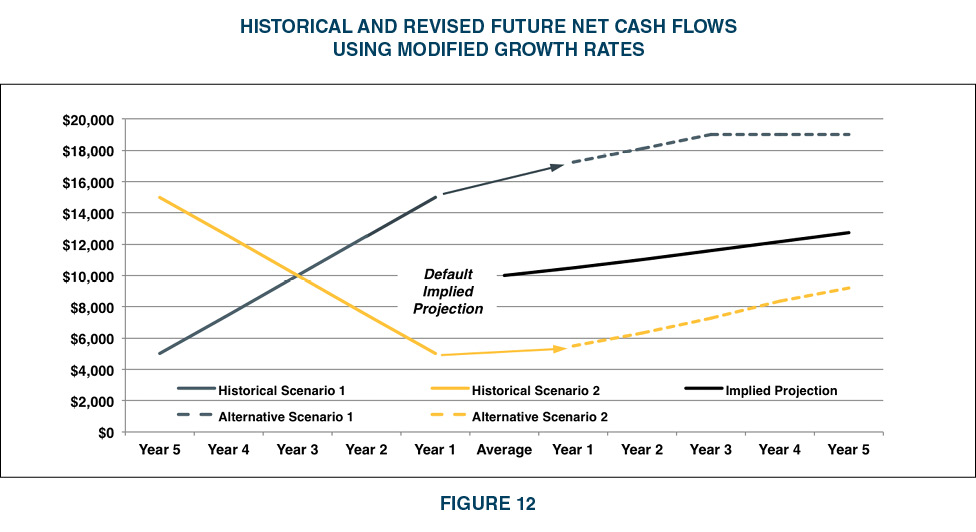
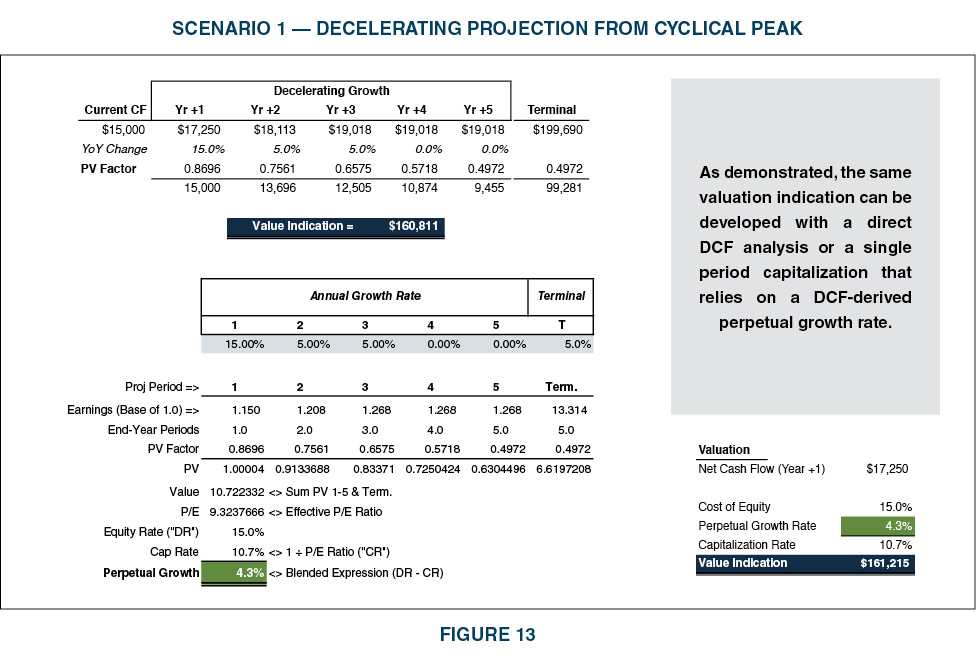
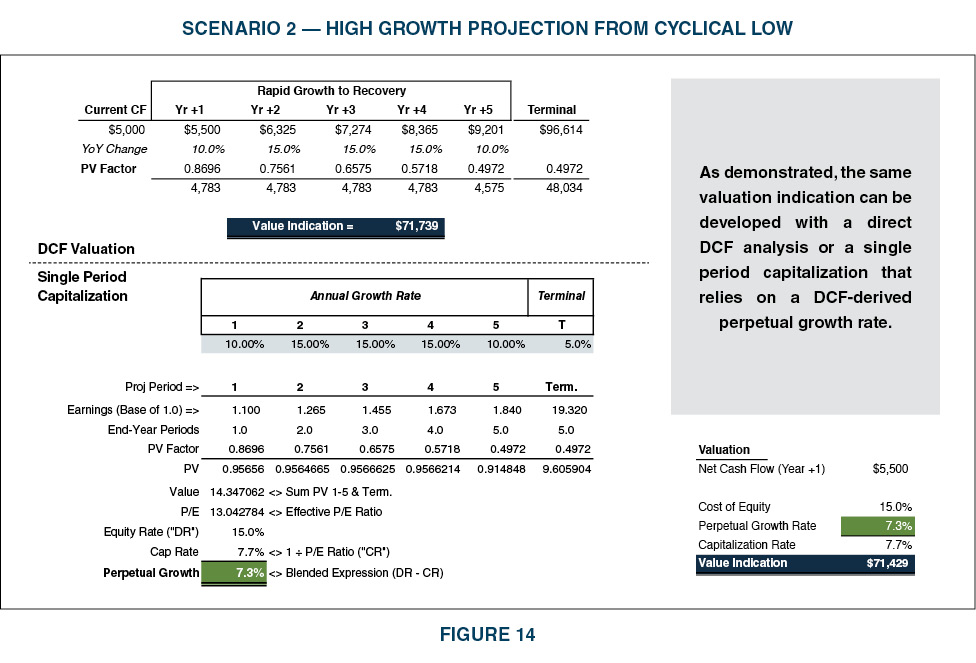
The chart in Figure 11 implies that performance has a gravitational attraction to the five-year outcome as a notional level of future performance ($12,763). An alternative and perhaps more realistic projection would craft a regression of the growth rate rather than a regression of performance to a notional future amount. Decelerating growth from either its peak performance (Scenario 1) or applying rapid growth during a mode of recovery (Scenario 2) seems more logical in most real world situations than the default trend. These competing projections are depicted in Figure 12. The valuations resulting from the smoothed growth patterns are developed in Figures 13 and 14 respectively. Of course, the pattern of future deceleration or acceleration requires specific study and support. The assumed patterns are presented for example purposes. A study of these alternative modeling inputs suggests that the original valuation of $105,000 is potentially flawed.
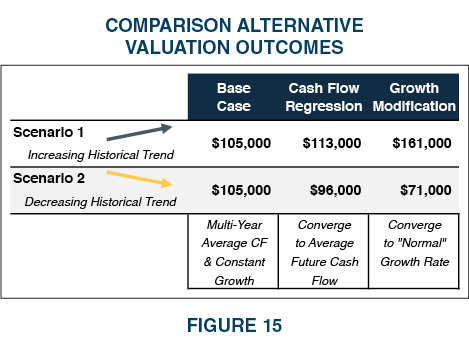
Let’s summarize the various valuation outcomes from the two different scenarios. Remember, common averaging techniques coupled with seemingly benign growth assumptions result initially in the same valuation under both scenarios. However, scrutiny of the growth and/or projection modeling reveals some dramatic differences. Admittedly, in most valuations there would be underlying facts and circumstances supporting one of three modeling conditions applied to each scenario. One can easily see how valuations can be viewed quiet differently by differing parties under differing circumstances. The primary valuation differential for each stems from the implied projection and growth modeling.
The common appraiser mentality of using historical average performance (rule of thumb mindset) combined with the typical “normal/benign” assumptions concerning growth and the cost of capital, can serve to understate or overstate value. Growth analysis and reasonable forecasting (birds of the same feather) allow for a more believable and optically pleasing analyses and conclusions. Comparing alternative projections from otherwise implied projections can provide better insight into growth modeling and promote more rational forecasting.
One of the most debated and poorly supported assumptions in business valuation is that of the growth rate in performance, be it earnings, net cash flow, or debt-free cash flow. The default reliance on macroeconomic or industry based data is a good beginning but often falls short of the full growth profile for a specific business in a specific industry in a specific geography at a specific point in time. The real world is often lumpy and most companies experience shifts in top-line activity, cost efficiencies, and operating leverage throughout the business cycle or in conjunction with changes in the business model. Skill and experience are powerful influencers for what feels “right,” but too often the five finger-growth mentality rules the day. What tools can an appraiser use to develop and defend growth rate assumptions and how can such a tool be used as a critical review tool?
Let’s study an example featuring a combination of typical facts and circumstances.
Example Conditions:
It is not uncommon for an appraiser to uncover the above information in the course of due diligence. Yet, the same management team that can relate such feedback to the appraiser will not “speculate” on a projection. A competent appraiser should be able to cobble together the framework of a projection for purposes of quantifying a growth rate for a single-period capitalization as well as performing a summary DCF analysis (perhaps as a test of reason or as additional direct valuation evidence). Figure 16 depicts how the facts and circumstances are expected to play out in sales and EBITDA.

Most often the typical approach would be to grab a recent average level of performance and use a growth rate likened to nominal GDP (4%), perhaps influenced up a bit to reflect the recent growth performance. However, the 6.3% perpetual growth rate developed does not tie directly to the underlying data and general information. For an appraiser to get the single-period perpetual growth rate correct, he/she would simply have to get that “just right” feeling. Clearly, a bit of extra effort and the constructive extension of logic would allow for an anecdotal or direct DCF-type study that could offer support for the generally favorable growth rate required in the analysis.
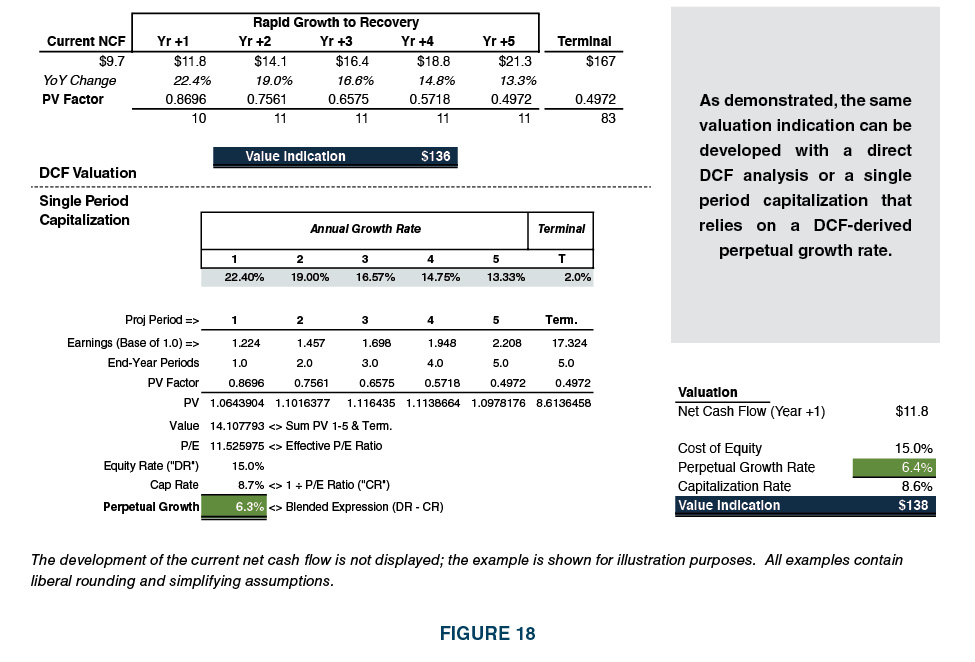
Figures 16-18 serve notice that macroeconomic growth rates, sprinkled with a little current and near term company performance are often misleading and can fail to capture the influence of timing on the value of future cash flows.
Report reviewers are frequently confined to terse, misguided, or unjustified positions concerning growth rates. Typically, report users are bludgeoned with anecdotal growth evidence or with historical observations that fail to translate directly into reasonable future expectations. The time value of money is frequently obscured by a failure to reconcile multi-stage growth expectations into a meaningful single-period growth rate.

Figure 19 displays a matrix of single, perpetual growth rates derived from the blended short term and long term growth rate expectations based on a 15% equity discount rate. Given a beginning measure of net cash flow or earnings, the table provides the single-period growth rate necessary to derive the same value result as a DCF using a five years of annual growth from the vertical axis (displayed left) and a terminal value developed using the growth rate from the horizontal axis (displayed top). For example, a company expecting to achieve 10% annual growth for years one through five and a terminal value growth rate of 5% would require a perpetual growth rate of 6.4% to equate a Gordon-style capitalization to a DCF valuation. The 6.4% perpetual rate may lack direct or specific support anywhere in the industry or economic data, but it may functionally capture the short-term and long-term expectations that are reasonable.
Some appraisers may find this simple concept too burdensome to develop and communicate and thus a trustee often ends up with the five-finger approach to growth analysis.
Figure 19 provides a quick and powerful tool for assessing growth rates in valuation reports (at the specific 15% equity discount rate). Even if future growth lacks “visibility,” the fact is that years one through five are more predictable than beyond five or more years. That being a matter of common sense, a given company’s prevailing and near term trends might reasonably serve as the annual growth rate for years one through five while an industry/GDP/inflationary assumption might reasonably serve as the perpetual growth rate after the initial five-year implied projection (e.g. the terminal value growth rate).
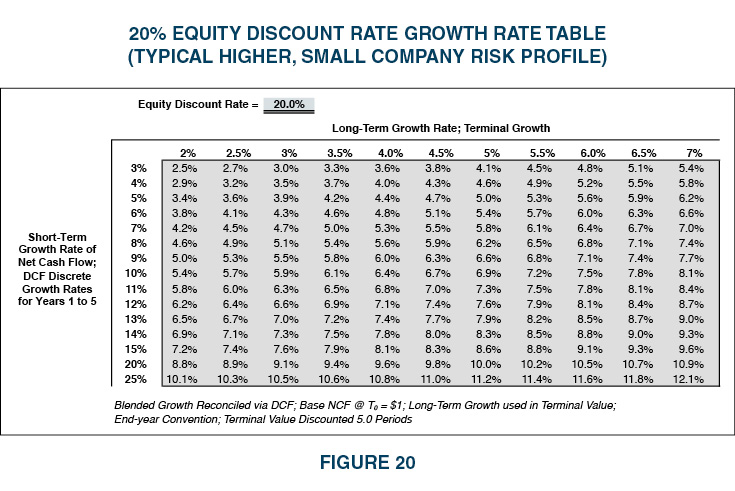
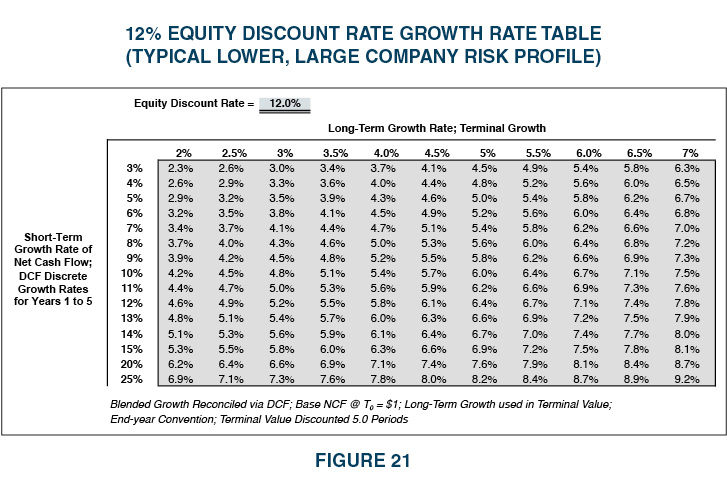
Figures 19-21 are based on alternative equity discount rates. The use of the subject’s company’s equity discount rate is vital to developing a proper growth rate perspective. We note that growth rates applicable to alternative cash flows, such a cash flow to total invested capital, can also be studied using a similar approach as described in these examples. Replicating the math of these growth tables is relatively easy for any experienced analyst or reviewer.
For purposes of the following case study analysis, let’s refer to the various projection scenarios depicted in Figure 22. Additionally, let’s frame the effect on the valuation from the projection scenarios using a valuation of the unadjusted management projections.

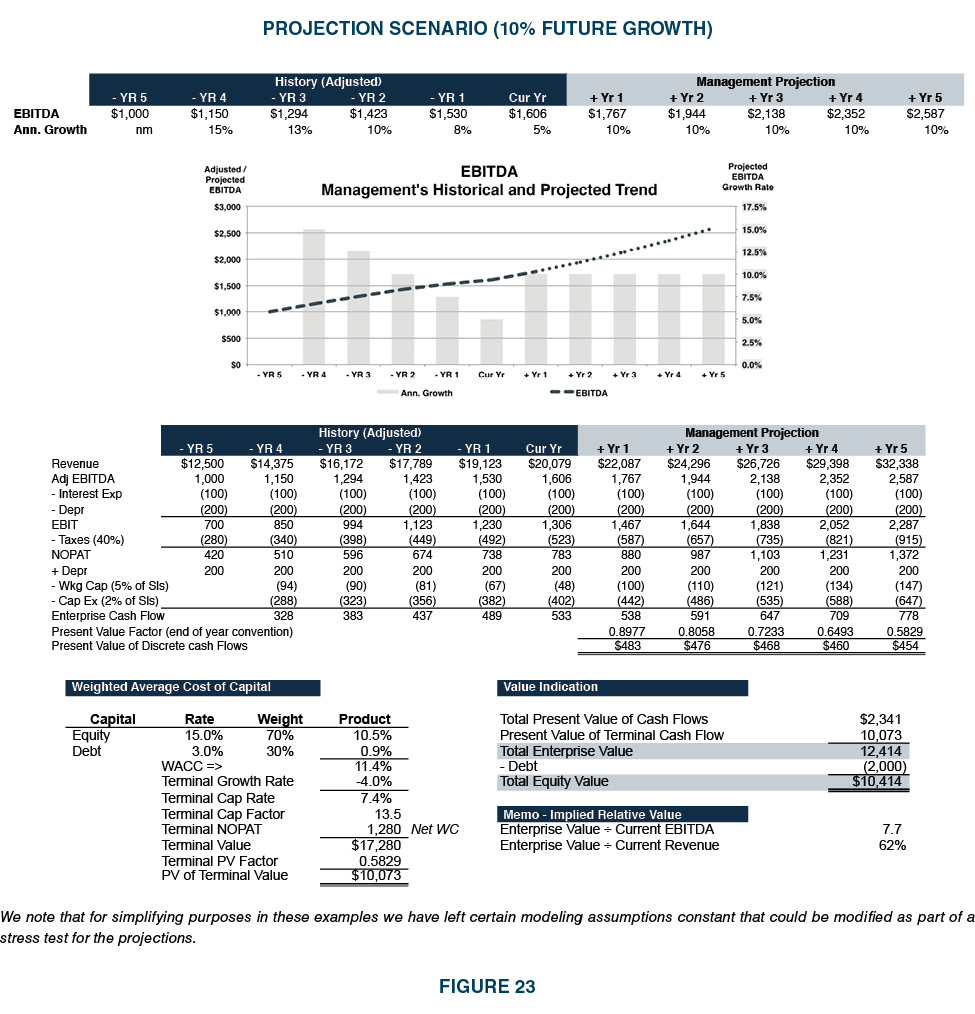
Figure 22 highlights the various projection scenarios one might reasonably develop as alternatives to the base management projection. Figure 23 depicts both a DCF and single-period capitalization developed from a base projection.
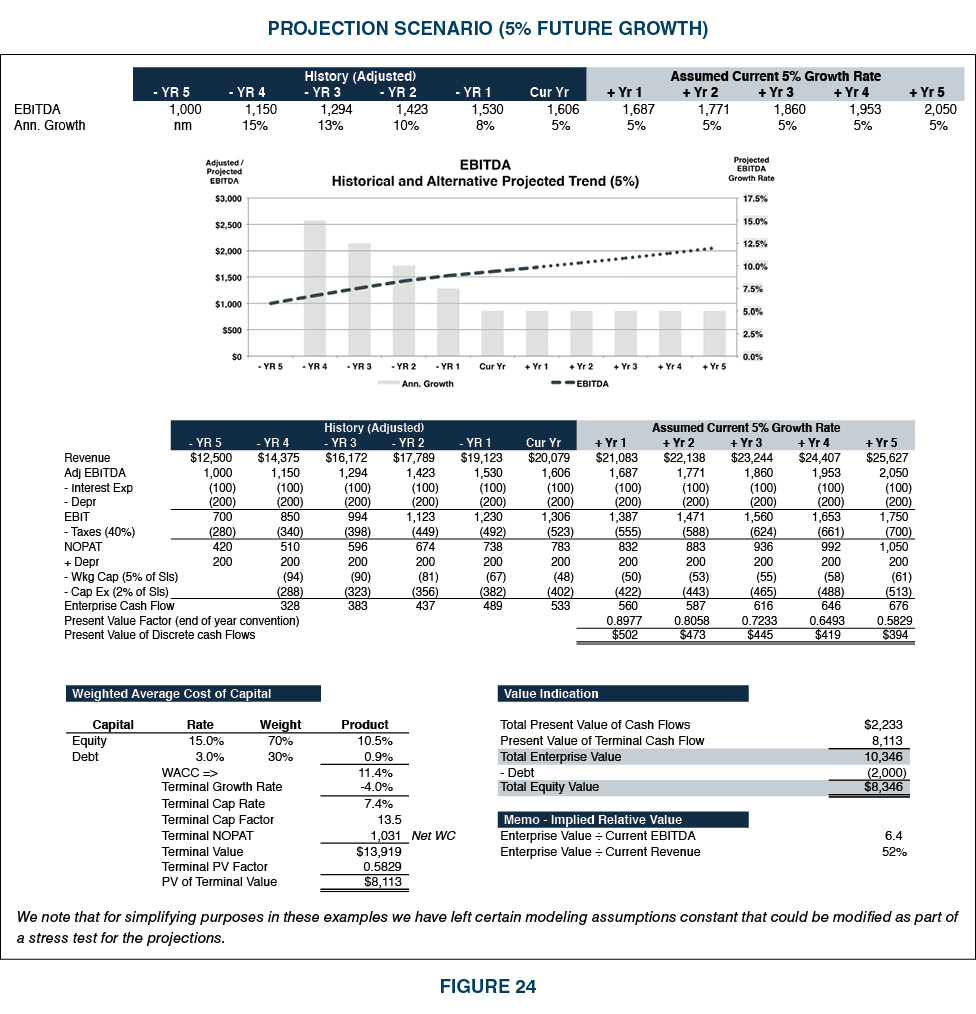
As can be observed in Figure 24, the valuation using a modified growth rate reduced the total equity valuation by 20%. If the appraiser and/or the trustee concur that this lower growth scenario is a more plausible outcome than management’s original projection, particularly in light of the trustee’s core concern for a long-term sustainable and serviceable ESOP benefit, then all things held constant in the base projection model, the use of an equity risk premium on the order of 2.0% applied to the equity discount rate of the original model (making it 17% versus the original 15%) would converge the value of the original projection with that of the alternative 5% growth scenario. Using this technique, the appraiser/trustee has not directly modified the projection, but the valuation is hedged for the horizon risk believed to be associated with management’s base numbers.
This is a simplified but powerful example of how the appraisal process can serve to effectively adjust the valuation outcome for the uncertainty of achieving a projection. Numerous other DCF treatments including discounting timing conventions, terminal growth rates, terminal value methods, capital structure for determining the WACC, working capital assumptions, and other tweaks can individually or collectively result in significantly different valuation outcomes using the same projection. These adjustments and modeling exercises can aid appraisers and trustees in determining reasonable and credible valuation outcomes. It goes without saying that these adjustments cannot simply be arbitrary. Rather, they must be reasonable and supportable in the context of the company’s capabilities and the marketplace for ESOP ownership interests in the company. With regard to valuations over time, changes in assumptions and modeling techniques should not be buried or obscured and should be clearly reconciled for the benefit of both the appraiser and the trustee.
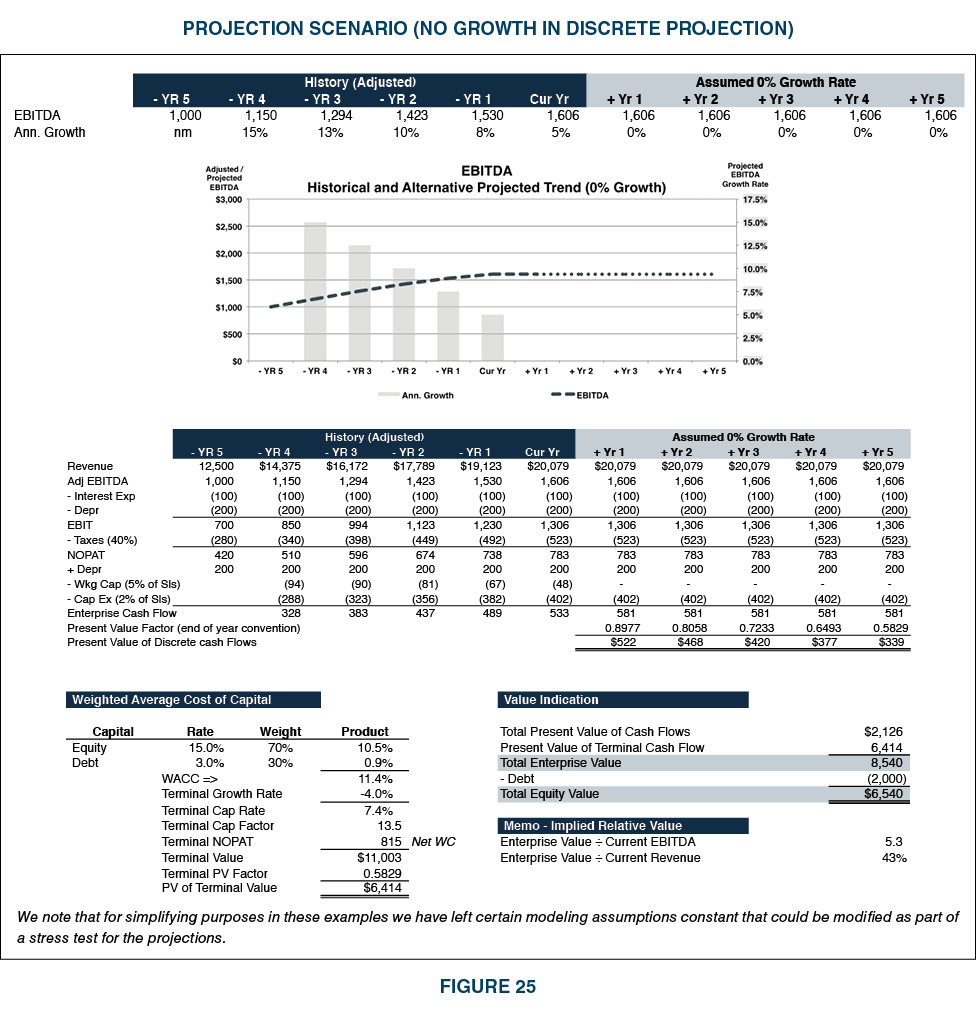
As can be observed in Figure 25, the valuation using the 0% growth scenario reduced the total equity valuation by 37% from the original growth projection. If the appraiser and/or the trustee concur that this alternative growth scenario is a more plausible outcome than management’s original projection, particularly in light of the trustee’s core concern for a long-term sustainable and serviceable ESOP benefit, then all things held constant in the base projection model, the use of an equity risk premium on the order of 4.0% applied to the equity rate (making it 19% versus the original 15%) would converge the value of the original projection with that of the alternative 0% (no) growth scenario. Using this technique, the appraiser/trustee has not directly modified the projection, but the valuation is hedged for the horizon risk believed to be associated with management’s base numbers.
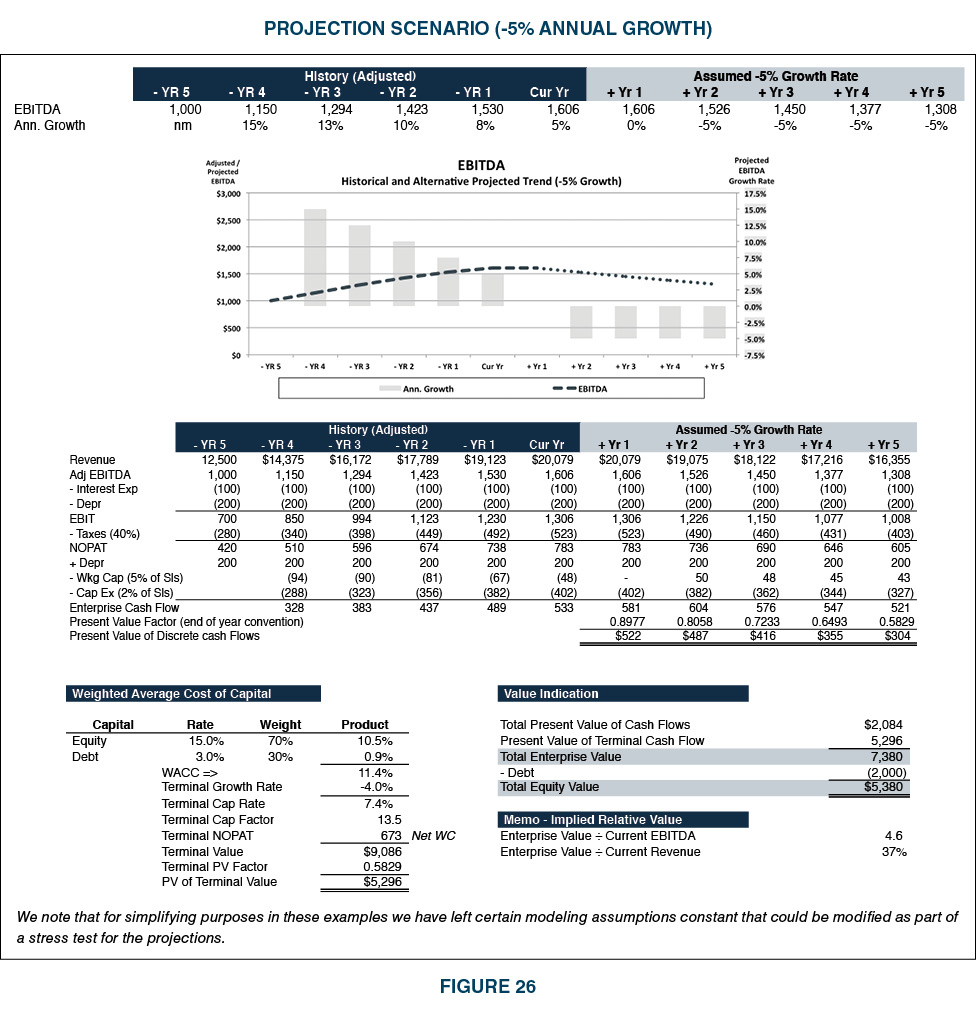
As can be observed in Figure 26, the valuation using a declining growth scenario reduced the total equity valuation by 48%. If the appraiser and/or the trustee concur that this alternative growth scenario is a more plausible outcome than management’s original projection, particularly in light of the trustee’s core concern for a long-term sustainable and serviceable ESOP benefit, then all things held constant in the base projection model, the use of an equity risk premium on the order of 6.0% applied to the equity rate (making it 21% versus the original 15%) would converge the value of the original projection with that of the alternative -5% annual growth scenario. Using this technique, the appraiser/trustee has not directly modified the projection, but the valuation is hedged for the horizon risk believed to be associated with management’s base numbers.
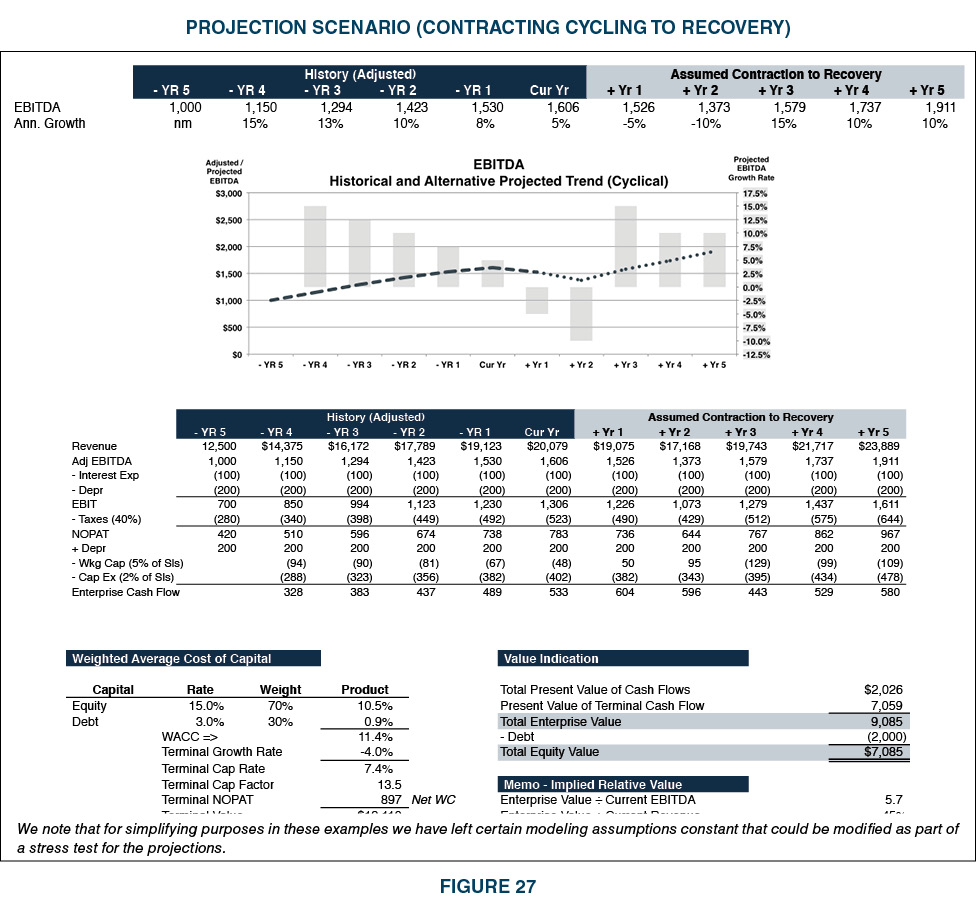

As can be observed in Figure 28, the valuation using a modified growth rate reduced the total equity valuation by 32%. If the appraiser and/or the trustee concur that this alternative growth scenario is a more plausible outcome than management’s original projection, particularly in light of the trustee’s core concern for a long-term sustainable and serviceable ESOP benefit, then all things held constant in the base projection model, the use of an equity risk premium on the order of 3.3% applied to the equity rate (making it 18.3% versus the original 15%) would converge the value of the original projection with that of the alternative cyclical growth scenario. Using this technique, the appraiser/trustee has not directly modified the projection, but the valuation is hedged for the horizon risk believed to be associated with management’s base numbers.
Figure 28 depicts the various growth rates scenarios studied for this example. This serves as an example of the type of sensitivity and stress testing the trustee/appraiser can employ to support the due diligence process and the documentation of the projections employed (and/or not employed) as called for under the DOL settlement protocols. As previously stated, alteration of numerous other modeling inputs could be studied in the same fashion as this example using growth rates and reconciling equity (horizon/projection) premiums. The various scenarios can be used to support concerns for downside risk concerning the valuation, the ability to service debt, and the ability to support ESOP repurchase obligation (all procedures and considerations called for under the settlement protocols). These same sensitivity processes can be used to assess the quality and relative value of the subject ESOP company to transaction data and/or guideline public company data employed and/or adjusted in the valuation.
As can be seen in Figure 28, modeling alternative growth scenarios can be a powerful tool in assessing the risk profile and alternative outcomes associated with a given set of projections. While this lengthy working example has examined downside scenarios associated with projection shortfalls, the same framework can be used to assess upside potential in cases where management projections appear conservative in light of past performance and/or external business drivers. It could be argued that the assessment of repurchase obligation should include the potential impact from positive budget variances, as undervaluation today could result in an underestimation of future repurchase liability, which could lead to under-informed and potentially adverse business decisions by the sponsor company.
UNITED STATES DISTRICT COURT | CENTRAL DISTRICT OF CALIFORNIA | Case No. ED-CV12-1648-R(DTBx)
THOMAS E. PEREZ Secretary of the United States Department of Labor (Plaintiff) V. GREATBANC TRUST COMPANY, et al. (Defendants)
This SETTLEMENT AGREEMENT (“Settlement Agreement”) is entered into by and between Thomas E. Perez, Secretary of the United States Department of Labor (“Secretary”), acting in his official capacity, by and through his duly authorized representatives, and GreatBanc Trust Company (“GreatBanc”), by and through its duly authorized representative (individually, a “party” and collectively, the “parties”), to settle all civil claims and issues between them.
WHEREAS, the Secretary’s predecessor, Hilda L. Solis, acting in her official capacity, pursuant to her authority under Title I of the Employee Retirement Income Security Act of 1974 (“ERISA”), 29 U.S.C. § 1001, et seq., as amended, filed this action in connection with the June 20, 2006 purchase of Sierra Aluminum Company (“Sierra”) stock by the Employee Stock Ownership Plan sponsored by Sierra (the “Sierra ESOP”), and Thomas E. Perez, current Secretary of the United States Department of Labor, in his official capacity, substituted for Hilda Solis and is now the plaintiff in this action;
WHEREAS, the Secretary and GreatBanc have negotiated this Settlement Agreement through their respective attorneys in a mediation process;
WHEREAS, the Secretary and GreatBanc have engaged in a constructive and collaborative effort to establish binding policies and procedures relating to GreatBanc’s fiduciary engagements and to its process of analyzing transactions involving purchases or sales by ERISA-covered employee stock ownership plans (“ESOPs”) of employer securities that are not publicly traded. Those policies and procedures, to which the parties have agreed, are set forth in Attachment A hereto, which is incorporated herein as an integral part of this Settlement Agreement (hereinafter collectively, “Settlement Agreement”);
WHEREAS, each party acknowledges that its representations are material factors in the other party’s decision to enter into this Settlement Agreement;
WHEREAS, the parties agree to settle on the terms and conditions hereafter set forth as a full and complete resolution of all of the civil claims and issues arising between them in this action without trial or adjudication of any issue of fact or law raised in the Secretary’s Complaint in this action and other claims and issues as set forth in this Settlement Agreement;[.]
[Terms and conditions delineated as items A through U omitted]
Attachment A Of The Settlement Agreement Agreement
Concerning Fiduciary Engagements And Process Requirements For Employer Stock Transactions
The Secretary of the United States Department of Labor (the “Secretary”) and GreatBanc Trust Company (“the Trustee”), by and through their attorneys, have agreed that the policies and procedures described below apply whenever the Trustee serves as a trustee or other fiduciary of any employee stock ownership plan subject to Title I of ERISA (“ESOP”) in connection with transactions in which the ESOP is purchasing or selling, is contemplating purchasing or selling, or receives an offer to purchase or sell, employer securities that are not publicly traded.
A. Selection and Use of Valuation Advisor – General. In all transactions involving the purchase or sale of employer securities that are not publicly traded, the Trustee will hire a qualified valuation advisor, and will do the following:
B. Selection of Valuation Advisor – Conflicts of Interest. The Trustee will not use a valuation advisor for a transaction that has previously performed work – including but not limited to a “preliminary valuation” – for or on behalf of the ESOP sponsor (as distinguished from the ESOP), any counter-party to the ESOP involved in the transaction, or any other entity that is structuring the transaction (such as an investment bank) for any party other than the ESOP or its trustee. The Trustee will not use a valuation advisor for a transaction that has a familial or corporate relationship (such as a parent-subsidiary relationship) to any of the aforementioned persons or entities. The Trustee will obtain written confirmation from the valuation advisor selected that none of the above-referenced relations exist.
C. Selection of Valuation Advisor – Process. In selecting a valuation advisor for a transaction involving the purchase or sale of employer securities, the Trustee will prepare a written analysis addressing the following topics:
If the Trustee selects a valuation advisor from a roster of valuation advisors that it has previously used, the Trustee need not undertake anew the analysis outlined above if the following conditions are satisfied: (a) the Trustee previously performed the analysis in connection with a prior engagement of the valuation advisor; (b) the previous analysis was completed within the 15 month period immediately preceding the valuation advisor’s selection for a specific transaction; (c) the Trustee documents in writing that it previously performed the analysis, the date(s) on which the Trustee performed the analysis, and the results of the analysis; and (d) the valuation advisor certifies that the information it previously provided pursuant to item (5) above is still accurate.
D. Oversight of Valuation Advisor – Required Analysis. In connection with any purchase or sale of employer securities that are not publicly traded, the Trustee will request that the valuation advisor document the following items in its valuation report,1 and if the valuation advisor does not so document properly, the Trustee will prepare supplemental documentation of the following items to the extent they were not documented by the valuation advisor:
E. Financial Statements.
F. Fiduciary Review Process – General. In connection with any transaction involving the purchase or sale of employer securities that are not publicly traded, the Trustee agrees to do the following:
G. Fiduciary Review Process – Documentation of Valuation Analysis. The Trustee will document in writing its analysis of any final valuation report relating to a transaction involving the purchase or sale of employer securities. The Trustee’s documentation will specifically address each of the following topics and will include the Trustee’s conclusions regarding the final valuation report’s treatment of each topic and explain in writing the bases for its conclusions:
H. Fiduciary Review Process – Reliance on Valuation Report.
I. Preservation of Documents. In connection with any transaction completed by the Trustee through its committee or otherwise, the Trustee will create and preserve, for at least six (6) years, notes and records that document in writing the following:
J. Fair Market Value. The Trustee will not cause an ESOP to purchase employer securities for more than their fair market value or sell employer securities for less than their fair market value. The DOL states that the principal amount of the debt financing the transaction, irrespective of the interest rate, cannot exceed the securities’ fair market value. Accordingly, the Trustee will not cause an ESOP to engage in a leveraged stock purchase transaction in which the principal amount of the debt financing the transaction exceeds the fair market value of the stock acquired with that debt, irrespective of the interest rate or other terms of the debt used to finance the transaction.
K. Consideration of Claw-Back. In evaluating proposed stock transactions, the Trustee will consider whether it is appropriate to request a claw-back arrangement or other purchase price adjustment(s) to protect the ESOP against the possibility of adverse consequences in the event of significant corporate events or changed circumstances. The Trustee will document in writing its consideration of the appropriateness of a claw-back or other purchase price adjustment(s).
L. Other Professionals. The Trustee may, consistent with its fiduciary responsibilities under ERISA, employ, or delegate fiduciary authority to, qualified professionals to aid the Trustee in the exercise of its powers, duties, and responsibilities as long as it is prudent to do so.
M. This Agreement is not intended to specify all of the Trustee’s obligations as an ERISA fiduciary with respect to the purchase or sale of employer stock under ERISA, and in no way supersedes any of the Trustee’s obligations under ERISA or its implementing regulations.