In contemplating August’s market activity, our thoughts drifted to Roman times. In 45 B.C., the Roman Senate honored Julius Caesar by placing his name on the month then known, somewhat drably, as Quintilis. Later, the Senate determined that Augustus Caesar deserved similar recognition, placing his name on the month after July. But this created an immediate issue in the pecking order of Roman rulers – up until then, months alternated between having 30 and 31 days. With July having 31 days, poor Augustus’ stature was diminished by placing his name on a month having only 30 days. To rectify this injustice, the Senate decreed that August also have 31 days, accomplished by borrowing a day from February and shifting other months such that September only had 30 days (to avoid having three consecutive 31-day months).
We provide this historical interlude to illustrate that, while July and August now are equivalent in terms of the number of days, the market environment in these two months during 2015 bore few similarities. In August, volatility returned, commodity prices sank, and expectations of Federal Reserve interest rate action in September diminished.
Most broad stock market indices declined between 6% and 7% in August, taking the indices generally to negative territory year-to-date in 2015. As indicated in Figure 1, except for the largest banks, publicly-traded banks generally outperformed the broader market, both year-to-date in 2015 and in August specifically.
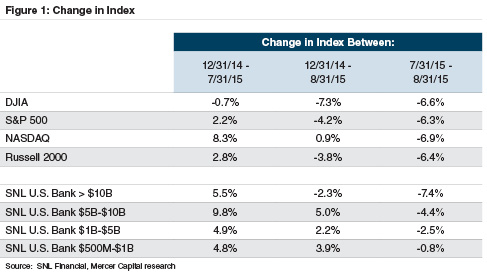
For the year, banks benefited from several factors. First, investors appear to expect that rising interest rates will, if not enhance banks’ earnings, at least prove to be a neutral factor. Other sectors of the market, though, may be less fortunate, as companies face higher interest payments or other adverse effects of higher interest rates. Second, banks generally reported steady growth in earnings per share, as assisted by a benign credit environment.
Within any index, though, the performance of individual companies may vary greatly. Seeking to isolate factors influencing the August market performance, we focused on publicly-traded banks with assets between $500 million and $5 billion. Given the market backdrop, these 212 banks performed relatively well in August, with a median share price depreciation of only 1.1% (see Figure 2). For the year, the median bank reported a 2.9% increase in its stock price.
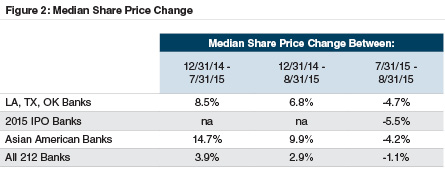
While linking company-specific factors to market performance during a volatile period is difficult, we identified three groups of banks that underperformed in August:
Several risks that influenced August’s volatility have not dissipated, including uncertainty surrounding China’s opaque (and potentially over-leveraged) economy and the effect of any Fed policy tightening. Analyst estimates for 2016 EPS often suggest favorable growth over 2015, and such estimates bear watching to the extent that the recent market volatility spills over into the real economy.

