This article first appeared as a whitepaper in a series of reports titled Appraisal Review Practice Aid for ESOP Trustees. To view or download the original report as a PDF, click here.
There is a protracted and clouded legacy of information and dogma surrounding the universe of discounts and premiums in business valuation. It seems logical enough that as elements of business valuation, the underlying quantification and development of discounts and premiums should be financial in basis, just as other valuation methods are founded on financial principles. Much of the original doctrine surrounding the determination of discounts and premiums was based on reference to varying default information sources, whose purveyors continue the ongoing compilation of transaction evidence (public company merger and acquisition activity, restricted stock transactions, pre-IPO studies, etc.). After begrudging bouts of evolution, there has been maturation toward more disciplined and methodical support for valuation discounts and premiums. Perhaps as the state of the profession concerning discounts and premiums has progressed, so, too, has the divide in skill and knowledge among valuation practitioners become wider. Certainly this seems to be the case regarding many users and reviewers of appraisal work (ostensibly the legal community, the DOL and the IRS).
There remains ample debate concerning numerous issues in the discount and premium domain. Unfortunately, in the quest for better clarification on the determination of discounts and premiums there has developed an arms’ race of sorts. Despite the emergence of compelling tools and perspectives, no method or approach appears to have the preponderance of support in the financial valuation community. Nowhere is this truer than with the marketability discount (also known as discount for lack of marketability or DLOM). Within the ESOP community much of the confusion over DLOMs is mitigated due to the presence of put options designed to ensure reasonable liquidity for ESOP participants. However, in the ESOP community a legacy of concern over control premiums has now become an acute issue as stakeholders and fiduciaries have increasing concerns regarding flawed valuations and prohibited transactions.
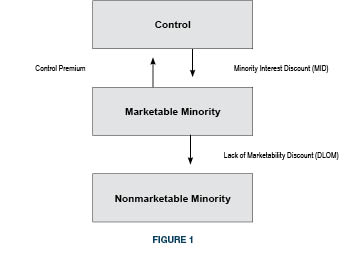
Regarding the concept of control premiums and minority interest discounts (also known as “lack of control discounts”), there is less conflict and more uniformity on how and when these discounts are used in a business appraisal. That is not to say that differences among appraisers don’t exist regarding certain issues. For purposes of establishing a platform to converse on valuation discounts and premiums, let us use the conventional levels of value framework to anchor the discussion. Figure 1 provides structure about where the traditional valuation discounts and premiums are applied in the continuum of value.
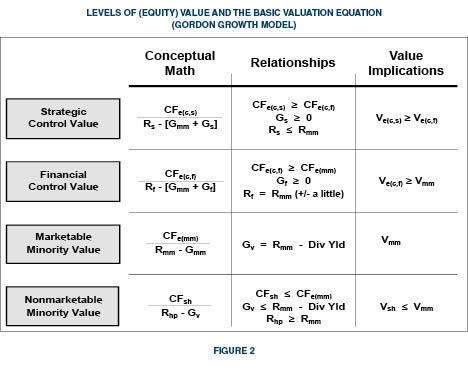
The integration of the basic income equation of value into the levels value chart results in the equations and relationships shown in Figure 2. It is here that we can begin to understand that valuation discounts and premiums are not devices in and of themselves. Each is the product (consequence) of the relationships among and between the underlying modeling elements that constitute financial valuation(cash flow, risk and growth). We note that the conceptual core of the mathematical relationships is generally centered on the freely traded world of the public stock markets, which is characterized as the “marketable minority” level of value (enjoying readily achievable liquidity in a regulated, timely, and efficient market). Although other levels of value can be directly observed in various markets, the marketable minority interest level of value characterizes the empirical world from which most valuation data and observations are made (i.e., Ibbotson).
The take away from the relationships depicted in Figure 2 is that risk is negatively correlated to value (the universal reality of the time value of money) and that cash flow and the growth rate in cash flow are positively correlated to value. According to the preceding relationships, a control premium only exists to the degree that control investors reasonably expect some combination of enhanced cash flows, lower risk, or superior growth in cash flow, all as a result of better financial and operational capacity (financial control). Taking the financial control relationships one step higher via specific synergies results in a strategic control premium (which is not considered within the continuum of fair market value and generally exceeds adequate consideration for ESOP transaction purposes).
Conversely, a marketability discount exists to the degree that investors anticipate subject returns (yield and capital appreciation) that are sub-optimal in comparison to the returns of a similar investment whose primary differentiating characteristic is that it is freely traded (also known as liquid). That is to say, minority investors (buyers and sellers) in closely held businesses that have investment-level considerations such as higher risks, lower yield, and/or lower value growth require some measure of compensation to compel a transaction in the subject interest. Otherwise, the investor would seek an alternative.
What is a control premium? The American Society of Appraisers (ASA) defines a control premium as an amount or a percentage by which the pro rata value of a controlling interest exceeds the pro rata value of a non-controlling interest in a business enterprise, to reflect the power of control. In practice, the control premium is generally expressed as a percentage of the marketable minority value.
Based on this definition, it might seem that no controlling interest valuation can be developed without an explicit quantification to increase a value that is initially developed using a marketable marketable-minority interest level of value. This might be true in for circumstances in which the control value is not the direct result of the underlying methods. The fact is that most controlling interest value appraisals are developed based on adjustments and methods that result directly in the controlling interest level of value. Therefore, no explicit control premium is required. Consequently, the appraiser cannot explicitly define the magnitude of the control premium in the appraisal.
In many cases, the appraiser may state that no control premium is added because all the features and benefits of control have been captured in the earnings adjustments and/or through other modeling assumptions in the underlying methods. We have seen numerous situations in which an appraiser was accused of failing to develop a control valuation because there is no explicit control premium applied to the correlated value or to the individual methods that are weighed in the correlation of value. Archaic though it may be in the context modern valuation practice, such accusations still exist even when the valuation features all the perfunctory control adjustments and treatments. For cases in which normalization and control adjustments were applied to cash flows and other elements, the additional application of a discrete control premium implies that there are further achievable control attributes. In such cases the control premium is likely quite small in comparison to typical published measures. If control adjustments are applied and a control premium is also applied, there is a potential overstatement in the valuation. This type of circumstance is a hot bed issue with the Department of Labor as such treatments could be the underpinning of a prohibited transaction. Appraisers and trustees are cautioned about the potential for double counting when applying an explicit control premium.
The primary published source for control premium measurements is Mergerstat Review,published annually by Mergerstat FactSet. Mergerstat Review reports control premiums from actual transactions based on differences between public market prices of minority interests in the stock of subsequently acquired companies prior to buyout announcements and actual buyout prices. It is worth noting that Mergerstat’s analysis indicates that higher premiums are paid for public companies than for private concerns because publicly traded companies tend to be larger, more sophisticated businesses with solid market shares and strong public identities. From a levels-of-value perspective, most of the transactions reported in Mergerstat Review are believed to contain elements of strategic value, which explains the relatively high level of control premiums cited therein. This strategic attribute of the data also makes it potentially troublesome when relied upon in ESOP appraisals.
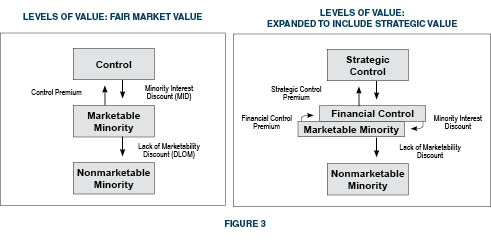
Noteworthy is the now widely accepted presumption that public stock pricing evidence is reflective of both the marketable marketable-minority and controlling financial interest levels of value. Referring to the expanded levels of value chart, minority interest discounts and financial control premiums are thought to be much lower in comparison to annually published data in Mergerstat Review. Thus, the two central boxes in the four-box vertical array of the expanded levels of value chart are essentially overlapping as in Figure 3.
The parity of value between financial control and marketable minority requires a few assumptions: normalized earnings adjustments are required, and these adjustments include some considerations that certain appraisers believe are not part of the minority interest equation (namely owners’ and executive compensation). We believe that return on labor and return on capital are reasonable to segregate in valuations based on all levels of value. However, there may be differences between financial control and marketable minority valuations based on enterprise capital structure. There may be some consideration for the lack of liquidity to both control and minority investors when adjusted income streams overstate the real economic cash flows available for distribution or other shareholder-level benefits (including cash flows necessary to sustain an ESOP). There may be some justifiable difference in value for situations in which the valuation subject’s capital structure appears more conservative than its peers. However, wanton manipulation of capital structures (for example, in the development of a weighted average cost of capital or WACC) in deriving the cost of capital is a frequent source of error in appraisals using a discounted future benefits (DFB) method. Such errors can lead to under- or over-valuation.
Most appraisals that employ a controlling interest level of value definition do not (or should not) display a discrete or explicit control premium. That is because the adjustment processes underlying most individual valuation methods provide for the full consideration of control and thus do not require or justify further adjustment in the form of an explicitly applied control premium. So, despite the lack-of-control form that many control appraisals have, there is ample structure within the methodologies to capture the substance of a control premium. The following perspective plays off the basic equation to business valuation as well as the levels of value chart that depicts the relationships between risk, growth, and cash flow as one moves up and down the levels of value conceptual framework.
What is a minority interest (lack of control) discount? The ASA defines a minority interest discount as the difference between the value of a subject interest that exercises control over the company and the value of that same interest lacking control (but enjoying marketability). In practice, the minority interest discount is expressed as a percentage of the controlling interest value. A minority interest is an ownership interest equal to or less than 50 percent of the voting interest in a business enterprise (or less than the percentage of ownership required to control the assets and/or the discretionary expense structure of a business).
As with the control premium, the minority interest discount is infrequently called upon in the valuation (as an explicit treatment) of most operating businesses because the majority of methodologies used to value nonmarketable minority interests results in an initial value at the marketable minority interest level of value. Accordingly, only a discount for marketability is required to derive the end nonmarketable minority valuation result.
Minority interest discount discounts are a more common feature in the valuation of certain types of investment holding entities such as limited partnerships. This is because such entities have highly diverse purposes versus the relatively narrow operating focus of most operating business models. As such, the assets owned by the entity are generally best appraised by a specialty appraiser or from direct observation of market evidence concerning the asset. That being the case, most such entities are valued using an asset-based approach, which inherently captures the controlling interest level of value for the underlying assets. This makes it necessary for the business valuation to be adjusted first for lack of control considerations and second for lack of marketability concerns. Additionally, in cases involving operating business that hold operating and/or non-operating real property assets, such assets may need to be appraised by an appropriate expert and adjusted with a minority interest discount when integrated into the minority interest enterprise value of an operating business.
Although minority interest considerations are captured in the majority of appraisals by reference to returns on marketable interest investments in the public marketplace, there are techniques for developing the discount. One such method involves mathematically imputing the discount based on an assumed control premium. Other methods involve observations of securities trading values in the context of the valuation of the issuer’s underlying assets, such as the case with closed closed-end funds and other securities in which underlying assets have an observable value that can be compared to the security’s trading price.
The following formula provides an expression of the percentage minority interest discount as a function of an assumed percentage control premium. Although the expression is useful in identifying the minority interest discount as a percentage of an assumed or developed measure of control value, it is rarely used in a direct sense in the valuation of minority interests.
![]()
In the valuation of minority interests in asset investment entities (limited partnerships et al.) that are invested in various classes of assets, many appraisers look to the observed discount to net asset value (NAV, the market value of a fund’s asset holdings less its liabilities) that closed-end funds (CEF) typically trade at as evidence of an applicable minority interest discount for a subject partnership or similar ownership interest. As a general rule, CEFs report their net asset values and the price-to-NAV relationship typically reflects a discount. Observed discounts to NAV reflect the consensus view of the marketplace toward minority investments in the underlying portfolios of securities. That is, the discounts are illustrative of the market’s discounting of fractional interests in assets, making them somewhat comparable to a minority interest in an entity that is heavily invested in other assets (such as marketable securities and other asset classes).
Discounts to net asset value for closed-end funds have been consistently observable for many years. The precise reasons for such discounts are subject to debate, but common attributes include the following factors:
Although closed-end funds may not be directly comparable to the subject interest in an appraisal, the discounts typically observed are evidence of the market’s discounting of portfolios of generally liquid securities, and, therefore, offers valid indirect evidence of minority interest discounts applicable to asset-holding entities and operating businesses.
The ASA defines a marketability discount as an amount or percentage deducted from the value of an ownership interest to reflect the relative absence of marketability. Augmenting the consideration of marketability is the concept of liquidity, which the ASA defines as the ability to readily convert an asset, business, business ownership interest, security, or intangible asset into cash without significant loss of principal. Lack of marketability and lack of liquidity overlap in many practical regards. However, lack of liquidity is often attached to a controlling interest, while marketability discounts are used to describe minority interests.
Despite the proliferation of marketability discount studies and models, most models fall into one of three primary categories. These categories are based on the underlying nature of the analysis or evidence from which each model emanates. They include market-based perspectives (commonly referred to as benchmark analysis), options-based models, and income-based (rate of return) models. Although it is not our place to define a given model as the model, we do recognize that some models (or perspectives) provide general guidance for the appraiser regardless of the specific model employed. The following is a list of the so-called Mandelbaum factors, which are derived from the Tax Court’s ruling in Mandelbaum v. Commissioner (T.C. Memo 1995-255, June 12, 1995). In essence, these factors serve a similar guidepost for the assessment of marketability, as does Revenue Ruling 59-60 for the valuation of closely held interests in general.
This list extends to considerations beyond the pure question of marketability. However, the ruling is instructive in its breadth. The Mandelbaum process is characterized by many appraisers as a qualitative or scoring procedure.
However, most of the parameters are mathematically represented by financial elements and assumptions under the income- and options-based models. Such parameters are also used, to the degree possible, in searching out market evidence from restricted stock transactions, which are documented in varying degrees by numerous studies over several decades.
Benchmarking analysis relies primarily on pre-IPO studies and restricted stock transactions. In essence, benchmarking calls for the use of market-based evidence to determine a lack of marketability discount. Some appraisers have pointed out the oxymoron of benchmarking (market transactions) analysis for use in determining marketability discounts.
On the same note, other appraisers cite the restricted stock studies for capturing market evidence that at its core demonstrates the diminution to value associated with illiquidity. Imputed evidence concerning the implied rates of return for restricted stock lends support for more specific analyses within certain marketability models.
Options-based models, most of which are derivations and evolutions of the Black Scholes Option Model, are based on assessing the cost to insure future liquidity in the subject interest. Rate return models are based on modeling the expected returns to the investors as a means for determining a valuation that results in an adequate rate of return given the investment attributes of the subject interest.
There is no one method that is acknowledged as superior to all others. Indeed, virtually every method employed in the valuation universe has been challenged or debated in the courts as well as by and among the professional ranks of appraisers.
Perhaps the best approach, stemming from a review of the IRS’s DLOM Job Aid, which was discovered and published a few years ago, is the use of multiple disciplines in a fashion consistent with the breadth of valuation approaches called for in business valuation (principally the income and market approaches).
Notwithstanding the previous perspectives on DLOMs and the methods and processes for developing them, most ESOP appraisals that involve a minority interest definition of value reflect a relatively minimal DLOM of 5-10%. This is due to the obligatory put option feature required for qualified retirement plans holding closely held employer stock.
The virtual guarantee of a market for the ESOP participants’ interests is believed to all but eliminate the DLOM. The consensus treatment from most appraisers is that a DLOM applies and is relatively small (say 5-10%) but not 0%.
Some appraisers use the DLOM as a proxy for concerns about future liquidity as it relates to the sponsor company’s ESOP repurchase obligation. If a business is floundering, has a significant bubble of participants requesting near-term liquidity, has pour cash flow, has limited financial resources or financing options, and/or any other underlying fundamental challenge, some appraisers will use a DLOM to reflect this concern.
DLOMs quantified in the correct fashion may indeed be a viable approach to capturing the cash flow needed to service repurchase obligations and the associated effect on the sustainable ESOP benefit (the stock value). However, many appraisers use a more direct and explicit approach to studying and treating the repurchase obligation by iterating the associated expense into the valuation modeling (generally using an income method).
The expense is determined through a repurchase obligation study which informs trustees, sponsors, and plan administrators what measure of cash flow will service the foreseeable needs of the plan. To the degree that the assumed ongoing retirement plan funding is insufficient to service the obligation, an additional expense may be applied or a single present-value adjustment may be quantified to adjust the total equity value of the business.
The application of a discount or premium to an initial indication of value is an often controversial and necessary input to the valuation process. Fortunately, appraisers are equipped with numerous income and market methodologies to derive reasonable estimates of the appropriate discount or premium for the subject interest.
As with the determination of the initial indication of value, it is ultimately up to the valuation analyst to choose the appropriate methodology based on the facts and circumstances of the subject interest.
None of the available methodologies are perfect, and all of them are subject to varying degrees of criticism from the courts and members of the appraisal community. Critics of the various market approaches often cite the lack of contemporaneous transaction data that are rarely comparable or applicable to the subject interest.
Arguments against the income methodologies often focus on the model’s inputs, particularly the holding period assumption, which is typically uncertain for most private equity investments.
The number of discount methodologies and their respective criticisms will, in all likelihood, continue to expand into the foreseeable future. It is ultimately up to the appraiser to consider the various options and determine the appropriate model or study applicable to the subject interest.
There are no hard-and-fast rules or universal truths that are applicable to all appraisals when it comes to the selection of an appropriate discount methodology. Appraiser judgment is ultimately the most critical input to any valuation, particularly in regard to the application of an appropriate discount methodology or control premium.
Admittedly, the number of discount methodologies and their corresponding criticisms can be a bit overwhelming to anyone unaccustomed to reviewing or writing business valuation reports.
At the end of the day, the most important thing to keep in mind is how reasonable the discount (or premium) is in light of the liquidity and/or ownership characteristics of the interest being appraised.
An appraisal may have carefully considered all the pertinent discount methodologies and their criticisms, but if the ultimate conclusion is not reasonable or appropriate for the subject interest, it will probably not hold up in court or communicate meaningful information for the end user of the report. Appraisers should investigate the reasonableness of their conclusions when preparing valuation reports and related analyses.