Weinberg et al. v. Commissioner
Reprinted from Mercer Capital’s E-Law Newsletter 00-03 & 2000-04, March 13, 2000.
It’s Not About the Marketability Discount
On February 15, 2000, the Weinberg case was filed in U.S. Tax Court. [Estate of Etta H. Weinberg, et al, v. Commissioner, T.C. Memo. 2000-51.]
Since we had just reported in this year’s first E-LAW that we were unaware of any published opinions in which the QMDM was discussed, I was rather excited to read the case. I received a copy on February 19th and pages 20 and 28 were flagged for my attention. I quickly turned to page 20 and read:
“Dr. Kursh [who was the IRS’ expert] then applied a marketability discount. In order to determine the amount of this discount, he used the Quantitative Marketability Discount Model (QMDM) that is described in a book written by Mr. Z. Christopher Mercer entitled Quantifying Marketability Discounts (1997).”
I then turned to page 28 where I read:
“. . . we did not find the QMDM helpful in this case.”
Wow! My first reactions were irritation, worry, and anxiety, not necessarily in that order. This was the first reported case to my knowledge in which the QMDM has been addressed and things didn’t look so good.
But, like every case, Weinberg is based on a particular set of facts and circumstances. We need to review the case, the treatments of the valuation issues by the two experts and the Court in order to place Judge Whalen’s comments about the QMDM into proper perspective.
Let me say that after reviewing the case, I believe the Court DID find the QMDM helpful, as is proven by the results of the case. In fact, Weinberg is not a case about the marketability discount but about the minority interest discoun.
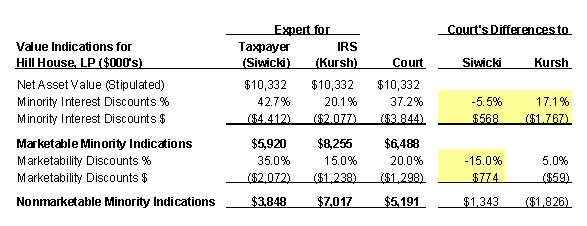
The conclusions of the experts and the Court are summarized in Table 1 so readers can see where we are headed at the outset.
The experts in the case were:
- Mr. Robert M. Siwicki, Howard, Lawson & Co., representing the taxpayer. He concluded that the fair market value of the subject interest was $971,838. Mr. Siwicki is an Accredited Senior Appraiser (ASA designation) with the American Society of Appraisers, and holds a master’s degree in finance from the Wharton School.
- Dr. Samuel J. Kursh, representing the Internal Revenue Service. He concluded that the fair market value of the subject interest was $1,770,103. Dr. Kursh is a Certified Business Appraiser (CBA designation) of the Institute of Business Appraisers and holds a doctorate in business administration from George Washington University.
This E-LAW is based on the facts as presented in the Court’s opinion. We supplemented our review of the opinion by obtaining a copy of Dr. Kursh’s valuation report and talking briefly with him about his report. We have not yet been able to obtain a copy of Mr. Siwicki’s report. We chose to take time for a complete analysis of the case rather than responding quickly. Thanks to all of our readers who have called to let us know about the case or to inquire about our response. Here it is.
The Basic Facts
Etta H. Weinberg, the decedent, died on December 15, 1992, the valuation date in this case. On the date of her death, the decedent possessed a general power of appointment over the principal of a marital deduction trust that had been created under her late husband’s will referred to as Trust A. Trust A owned a 25.235% interest in Hill House Limited Partnership (“Hill House” or “the FLP”). Hill House owned and operated an 11-story, single building apartment complex that contained 188 apartments, an office suite, an underground parking garage, and a swimming pool. The complex had been built in 1964. Occupancy exceeded 98% as of the valuation date. [Dr. Kursh visited the property in connection his appraisal. He commented that the location of the property resulted in extremely low vacancy rates. He further stated that the property was visually in excellent condition, and that, according to management, there were no significant deferred maintenance issues.]
The apartment had a mortgage with four remaining monthly installments of principal and interest of $18,406. [Other things remaining the same, the FLP’s annual cash flow was going to increase by $220,872 ($18,406 x 12 months) within four months.] The parties stipulated that the fair market value of the apartment complex was $10,050,000. [This was the average value of two real estate appraisals prepared in this matter ($9,600,000 and $10,500,000)]
The Hill House Limited Partnership Agreement provided the general partner “sole discretion to determine when distributions are made” and that “such distributions shall be made pro rata to the Partners in accordance with their respective Percentage Interests.” There was a restriction on transfer in the Agreement giving all the other partners a right of first refusal for any interests any partner hoped to sell on the same terms and conditions offered by a third party. And the agreement provided that the general partner had sole discretion to consent to or to deny the substitution of a limited partner, unless the purchaser of an interest was already a partner. Trust A’s 25.235% interest was the largest limited partnership interest. There were three interests of 14% to 15% each, three more interests on the order of 9%, and a final 3% interest in the FLP. The decedent’s son was the sole general partner with a 1% interest.
The financial statements summarized in the Court’s opinion provided the information found in Table 2 which is supplemented by relevant calculations.
During the period reviewed, Hill House experienced growth in net income and maintained a strong cash position while making substantial distributions of its earnings. Average distributions for the 1990-1992 period totaled $683,333, or 82% of net income.
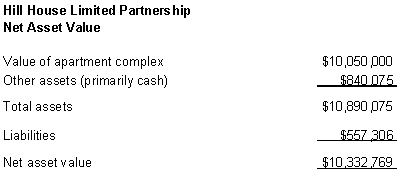
A market value balance sheet providing a stipulated net asset value is reproduced in Table 3.
The sole issue for the Court’s consideration was the fair market value of the subject 25.235% interest in Hill House Limited Partnership. While the Court summarized the valuations of the experts based on the subject interest, we will discuss the value of the partnership in its entirety in order to maintain visible relationships to net asset value and to distributions as we proceed.
The Court concluded that the fair market value of the subject interest was $1,309,651. Although there is a specific valuation rationale for the Court’s conclusion, we note that the conclusion is approximately a splitting of the difference between the two appraisals presented to the Court.
The Taxpayer’s Valuation
Mr. Siwicki’s valuation (on behalf of the taxpayer) is summarized in Table 4.
Mr. Siwicki used two methods in arriving at his conclusion, the capitalization of income method, and a “net asset value method.” In reality, we will see that he effectively used a single method. Beginning with Partnership Profiles, Inc.’s May/June 1992 publication (covering 1991 transactions), “The Perspective,” Siwicki narrowed his search from all 85 publicly registered partnerships to seven that invested in residential property, had little or no debt, and made cash distributions to limited partners. In the final analysis, he relied on a single company, IDS/Balcor Income Properties, as the basis for his capitalization rate of 11.0%, and discount to net asset value (NAV) of 51%.
Siwicki capitalized the three-year average distributions of $683,333 using a capitalization rate of 11.0% to reach an indication of value of $6.2 million. Note that Siwicki is capitalizing a measure of distributions expected to be available to the limited partners and not the cash flow of the enterprise.
He did not capitalize the higher level of 1992 distributions ($800,000), nor did he consider that potential annual distributions could soon exceed $1.0 million as result of the mortgage expected pay-off in four months. In other words, it appears that Siwicki capitalized far less cash flow than the cash flow that was currently being distributed or that might reasonably be expected to be distributed in the near future.
Siwicki then applied the discount to NAV from the single comparable of 51% to the net asset value of $10.3 million to reach a “net asset value” of $5.9 million. Note, however, that the discount of 51% to NAV for the comparable was created because the yield on its NAV was not sufficient to induce a buyer to come forth at a higher price. For example, assume that the dividend of IDS/Balcor Income Properties was $1.00 per unit. If that dollar was priced to yield 11.0%, it was priced at $9.09 per unit (i.e., $1.00 / 11%). Correspondingly, the $9.09 per unit price represented a 51% discount to IDS/Balcor’s NAV, so its NAV is $18.55 per unit (i.e., solving for X when $9.09 = (1 – .51X)).
There is no new information in the NAV calculation. It is simply a proxy for a capitalization of income, and not, strictly speaking, a net asset value method. The reason that his capitalized income figure yields a higher indicated value results from Hill House’s higher payout percentage relative to the selected comparable. [Dr. Kursh indicated that he tried to explain this issue during his testimony. Unfortunately, the Court either did not understand or did not agree with his explanation. The fact is, Kursh’s interpretation is correct.]
Siwicki used weights of 75% on his capitalization of income method and 25% on his net asset value method, yielding an indication of value prior to the application of his marketability discount of $5.9 million, or a 43% minority interest discount to net asset value of Hill House of $10.3 million. Note that the yield at this indication of value is 11.5% based on the 3-year average distributions, and 13.5% based on 1992 distributions, before the application of a marketability discount.
At this point, Siwicki “reviewed various market studies on illiquid securities” to arrive at a 35% marketability discount. In particular, he relied upon the 1971 SEC restricted stock study. After applying his 35% marketability discount, Siwicki concluded that the fair market value of the limited partnership was $3.9 million, or 37% of net asset value of $10.3 million (i.e., a 63% discount from NAV).. The value of the subject interest of 25.235% was therefore $972 thousand. The yields implied by his conclusion are 17.7% based on three-year average distributions and 20.8% based on 1992 distributions.
The Government’s Valuation
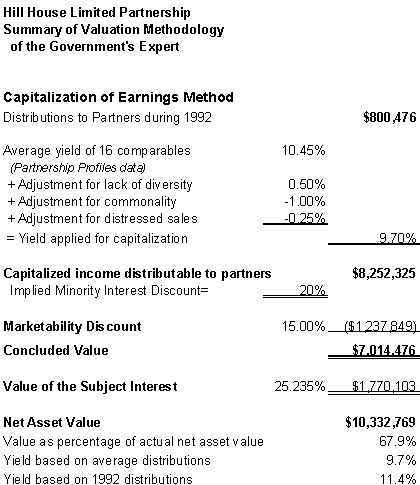
Dr. Kursh’s valuation is summarized in Table 5 and commented on below.
Dr. Kursh used only one method, a capitalization of income method, in valuing the subject interest. He used this method to determine an effective minority interest discount from NAV.
Beginning with the May/June 1993 issue of “The Perspective” published by Partnership Profiles, Inc. (covering 1992 transactions) Kursh selected partnerships that owned residential and/or commercial real estate. These partnerships also had low debt or leverage, had cash flows greater than their distributions and capital expenditures, and had assets that were valued by independent appraisers. Yields on the selected partnerships ranged from 9.3% to 11.6%, and Kursh selected a base rate of return of 10.45% (the median). He adjusted this yield for: a) the lack of diversity of the subject (+0.50%); b) commonality of interests (-1.00%, because the general partner was also a limited partner; and, c) distressed sales in the Partnership Profiles data base (-0.25%). His resulting yield applied for capitalization was 9.7%.
Kursh recognized that the mortgage would soon be paid off and that there would be a substantial increase in cash flow thereafter. He used distributions of $800,476 (after adjusting for his rounding) for 1992 as the “minimum level that a potential buyer would anticipate.” [His reasons for this assumption included the long history of paying dividends, the known increase in cash flow in four months, the excellent condition of the property and the fact that the general partner had substantial interests (direct and indirect) in the distributions to the limited partners.] His resulting marketable minority indication of value was $8.3 million, or a 20% minority interest discount to net asset value of $10.3 million.
Kursh used the QMDM to arrive at a marketability discount of 15%. Now some jaded readers are likely to think that he used a lower than “normal” marketability discount because his client was the IRS. In fact, Kursh used a lower than “normal” marketability discount because a low discount was warranted by the facts! And the Court agreed.
There are five key assumptions to the QMDM. The Court noted four of them used by Kursh.
The expected growth rate of value was estimated at 3% to 4%, based on expected inflation. Note that this is consistent with recent growth in earnings shown above. We will use 3.5% in this analysis. Kursh assumed that the expected growth rate in dividends would be in the same 3% to 4% range. We will use 3.5% in our analysis. [This assumption regarding the expected growth of distributions is clear from Kursh’s report, although not noted by the Court.]
His expected distribution yield was 10% ($800 thousand / $8.3 million, rounded).
He assumed a required holding period return of 16.4%. He used a build-up method beginning with Treasury yields and added a total of 9.2% for a combined large and small stock premium. To his resulting base equity discount rate of 14.4% he added a 1% premium for holding period uncertainty and another 1% premium for lack of diversification. He then bracketed this discount rate and assumed a relevant range of required returns of 16% to 18% in his analysis.
And Kursh assumed that the expected holding period would be between 10 and 15 years.
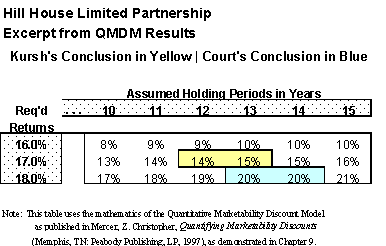
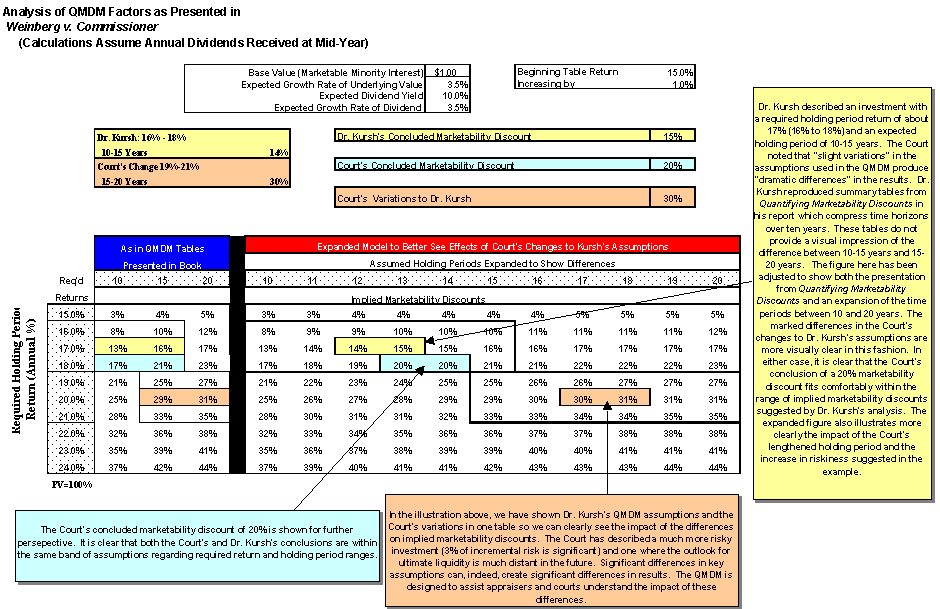
Kursh presented QMDM tables that, under his assumptions, yielded a marketability discount of 15%. His conclusion of 15% is highlighted for visual reference. The Court’s conclusion of 20% is also shown to be well within the range of judgment indicated by Dr. Kursh’s assumptions! (see Table 6)
A detailed QMDM analysis summarizing Dr. Kursh’s assumptions, and showing his conclusion regarding the marketability discount, that of the Court, and the investment indicated by the Court’s variation on Kursh’s assumptions is provided as Table 7.
Applying the 15% marketability discount to a capitalized income indication of $8.3 million yielded a value of $7.0 million for the FLP, and $1,770,103 for the subject interest. The yield at this conclusion is 9.7% based on 3-year average distributions, and 11.4% based on 1992 distributions.
[It should be clear by now that I believe that Dr. Kursh’s analysis is closer to cosmic truth than Mr. Siwicki’s. Consider another possibility. The limited partners of Hill House do not have to wait for an ultimate sale for substantial liquidity. The general partner could elect to re-mortgage the property and make a special distribution in the near future, which mortgage could be repaid by lowering or eliminating current partnership distributions. There are obviously tax implications to such a strategy, but it is illustrative of the flexibility that existed with Hill House.]
The Court’s Analysis
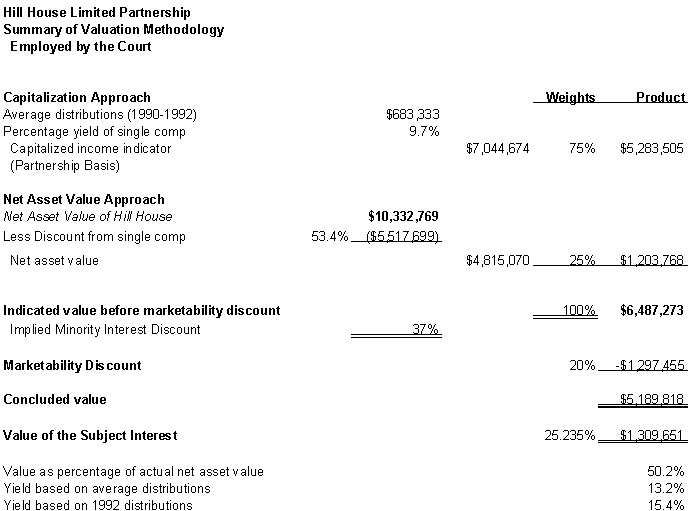
The Court took elements from each of the appraisers in arriving at a value, before marketability discount, of $6.5 million as can be seen in Table 8. Note that this represents an effective minority interest discount of 37%. We will put this aspect of the Court’s analysis into perspective below.
- From Siwicki, 3-year average distributions of $683,333. For some reason, the Court did not consider the higher level of distributions in 1992 or the prospects for even higher distributions upon pay-off of the mortgage in four months. [Note that this is one of the major swing elements in value differentials. $800,476 is 17% higher than $683,333. The former appears quite reasonable, and the selection of the latter was a very conservative assumption on the part of the Court.]
- From Kursh, an adjusted percentage yield for the income capitalization method of 9.7%. – Similar to Siwicki, the Court applied a 53.4% (versus 51%) discount to NAV in a “net asset value method” (following the Siwicki methodology).
- Again following Siwicki, the Court used weights of 75% for the income capitalization and 25% for the net asset value method. The conclusion of $6.5 million represented a 37% discount from NAV of $10.3 million.
- Regarding the marketability discount, Judge Whalen did not agree with either expert. He dismissed Siwicki’s reference to the standard restricted stock studies, indicating that he “failed adequately to take into account certain characteristics of the subject limited partnership interest that suggest a decrease in the marketability discount. These factors include consistent dividends, the nature of the underlying assets, and a low degree of financial leverage.” Judge Whalen concluded, without further explanation, that the marketability discount should be 20%. This result was much closer to Kursh’s 15% marketability discount than Siwicki’s 35% conclusion and clearly within a reasonable range of judgment.
The Court’s conclusion of fair market value of Hill House was $5.2 million, or 50% of NAV. The fair market value of the 25.235% subject interest was therefore $1,309,651. The implied yields based 3-year average distributions and 1992 distributions were 13.2% and 15.4%, respectively.
Partnership Profiles Data and the Minority Interest Discount
Mr. Siwicki and the Court (following Siwicki) used Partnership Profiles transaction data to determine a minority interest discount. In doing so, I believe they overstated the effective minority interest discount. Dr. Kursh could be criticized for making the same mistake but to a much lesser degree (because he did not combine his yield capitalization with a “net asset value method”). However, his use of the QMDM allowed him to derive a reasonable conclusion nonetheless.
We need some background regarding Partnership Profiles data to put these comments into perspective. They will assist in understanding the differences between Mr.Siwicki’s 43% minority interest discount, the Court’s 37% minority interest discount, and the 20% minority interest discount applied by Dr. Kursh.
It is generally recognized that, while there is a limited market for the publicly owned limited partnerships, the market is not considered to be overly active or efficient.
Publicly traded limited partnership interests are thinly traded in the secondary market compared to the activity of stocks in the primary markets, such as the New York Stock Exchange (NYSE). When an investor sells shares of a company traded on the NYSE, he or she can receive the cash proceeds in three days. However, it typically takes 60 to 180 days for an investor in publicly traded limited partnership units to complete the transaction and receive the cash proceeds primarily because of the required paperwork with the general partner. Even with this delay, a public limited partnership interest is generally more liquid than a private limited partnership interest, causing the private interest to normally be worth less than a comparable publicly traded interest. [Fishman, Pratt, et al, GUIDE TO BUSINESS VALUATIONS (Fort Worth: Practitioners Publishing Company, 1999), p. 14-18].
In a recent presentation by Charles Elliott, ASA, of Howard, Frazier, Barker and Elliott, several aspects of the secondary market for limited partnership interests were discussed. The paper was presented at the 1998 Annual Business Valuation Conference of the AICPA [Elliott, “An Outline of Valuation Considerations Related to Limited Partnerships,” which is available through SHANNON PRATT’S BUSINESS VALUATION UPDATE website (http://www.bvupdate.com). After subscriber login, click on Whitepapers and search for “Family Limited Partnerships, AICPA 1998 Conference”].
Elliott’s analysis of the secondary market is consistent with theimplications of the QMDM. We highlight certain sections and comment on their relationship to the QMDM factors noted above (these sections are found in Elliott’s paper under the “Valuation’sky hooks’/valuation reference points” heading).
4. Based upon input from the Secondary Market and from Partnership Profiles, Inc., the following conclusions are drawn regarding the basis upon which pricing of limited partnership units in the Secondary Market is determined.
4a. Cash distributions and therefore yield are most important; this is clearly the driver of pricing of partnerships in the Secondary Market. [Therefore, the QMDM’s focus on expected distribution yields and distribution growth.]
4d. Underlying cash flow coverage of yearly distributions made to partners. [This goes to the riskiness of the expected earnings stream and would be considered in the development of the required holding period return of the QMDM.]
4f. Whether or not the assets of the partnership are well diversified. [Again, the mix and diversification of a partnership relate to its riskiness as well as general attractiveness.]
4h3. The time period until liquidation. [A critical focus of the QMDM is in making a realistic estimate of the expected holding period until an opportunity for liquidity may arise. Note that we can almost never know with certainty what the expected holding period will be. However, it is important to make a reasonable estimate based on the facts and circumstances of each case. There is an implicit holding period assumption (or range of assumptions) in every concluded marketability discount. The QMDM asks the appraiser to make reasoned and reasonable judgments regarding this factor and to make those judgments (and the rationales therefore) explicit.]
4h4. The universe of interested buyers. [In the QMDM, we consider the return requirements of relevant universe of buyers of particular interests in the development of the required holding period return. If the universe of buyers is very limited, well-heeled, and sophisticated, the required returns can be substantial (and therefore, the derived marketability discounts may be substantial, depending on the other relevant factors).]
4h6. The presence of rights of first refusal. [Rights of first refusal limit marketability and add to the riskiness of investments in illiquid minority interests. In addition, they can increase the expected holding period for an investment. Both of these aspects are considered in the QMDM.]
We could examine all of Elliott’s observations and discuss each of them in the context of the QMDM. What Elliott is saying, however, is that the secondary market prices limited partnership interests on a rational basis that considers the economics and riskiness of ownership. That is what the QMDM attempts to do.
Now, Elliott goes on further to discuss the secondary market, indicating a flaw with Mr. Siwicki’s analysis regarding the marketability discount.
Because our valuation reference source is the Secondary market, it is inappropriate to utilize traditional lack of marketability discounts in the 30-50 percent range. The reason is that the Secondary market is a “thin market.” As a consequence, there is an element of illiquidity already expressed in the pricing of units in the Secondary Market.
Various sources in the Secondary Market have suggested that additional yield of about 200 basis points may be required than otherwise because of the impaired liquidity of the Secondary Market. This translates into a range of lack of marketability discounts of 15-25%, to be applied to the value of a non- controlling interest in a real estate [distributing] FLP.
Siwicki considered the “illiquidity already expressed” mentioned by Elliott in his capitalization of distributions. He then further discounted by weighting a price/NAV method. Finally, he discounted further by applying a “traditional lack of marketability discount” of 35%. The compounding of discounts resulted in a low value with a very high implied yield on expected distributions. This yield represented a premium to his 11% secondary market pricing base of about 1000 basis points, or far greater than Elliott’s suggestion. The Court achieved a more reasonable result by applying a lower than “traditional” marketability discount.
By using market returns from Partnership Profiles applied to the expected distributions of Hill House, Dr. Kursh developed a value indication reflecting approximately a 20% minority interest discount from NAV. His minority interest discount may be overstated somewhat due to the thinness of the secondary market. However, by basing his expected yield on this value, the QMDM mitigated any overstatement of the marketability discount. Unfortunately, these relationships are not necessarily intuitive and are somewhat difficult to explain. [The calculations referenced in the “Alternative Calculations” section below provide support for this observation.]
Basing Assumptions on “Hard Data”
The Court “did not find the QMDM helpful in this case” because certain assumptions made by Dr. Kursh were “not based on hard data.” So let’s look at Dr. Kursh’s QMDM assumptions and see where they came from [based on information reported in the decision and the Kursh report].
- The expected growth rate in value of 3% to 4% was consistent with recent historical growth in rental revenues and with expected inflation. That’s pretty good data on which to rely.
- The distribution yield of 10% was based on the most recent year’s distributions and his capitalized distribution result of $8.3 million as well as reference to market yields. While the Court used a recent average of distributions, Dr. Kursh’s assumption was clearly observable and based on factual information.
- His expected holding period was between 10 and 15 years. There is little information in the Court’s decision to support this; however, we note that the Court did not question this assumption. Assumptions about expected holding periods cannot be made based on hard data absent a contractual agreement for liquidity at a specific time and on a specific basis. Dr. Kursh was faced with making a decision based on available information. Note that the apartment building had been in the Weinberg family for 28 years as of the valuation date in 1992. Hill House was formed in 1980. Dr. Kursh knew that the general partner was in his late 50s or 60s. There was no evidence of plans to sell the apartment building. It was in excellent condition and providing excellent cash flow. In short, it appeared reasonable for him to have assumed a relatively long holding period and unreasonable to assume a short one.
- Finally, we come to Dr. Kursh’s assumption about the required holding period return. He used a 16.4% required return and then refers to a range of discounts from 16% to 18%. We outlined his build-up methodology above. His judgments in this derivation were consistent with his judgments when developing his cash flow capitalization rate (which the Court adopted). In short, his required holding period return appeared to be well-supported by market evidence and reasonable judgments.
Referring back to the discussion from Fishman above, shortly following the passage cited, Fishman indicates:
“Understanding how publicly traded limited partnership are priced is essential to determining the fair market value of FLP interests. The total expected return for publicly traded limited partnerships generally ranges from 16% to 22%.”
Examining Dr. Kursh’s assumptions in this light, we see he has assumed a total rate of return in the range of 19% (16% lower range return plus 3% inflation) to 22% (18% higher range of return plus 4% inflation). While we sometimes see total returns somewhat higher than this, Dr. Kursh’s results seem clearly within the range of known market data (and the same market data relied upon by the Court).
Based on our review of the case and Dr. Kursh’s report, it appears that Dr. Kursh used information that was factually based and within the range of reasonable comparisons with market data in his application of the QMDM. It is unfortunate, but the Court was apparently not convinced of the reasonableness of Dr. Kursh’s assumptions and their consistency with “hard data” that was in his report and otherwise readily available.
Alternative Calculations
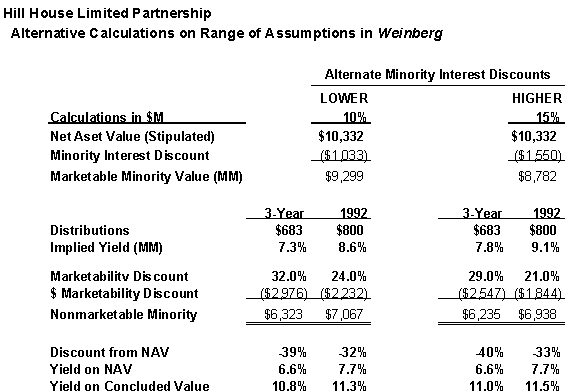
Dr. Kursh used an effective 20% minority interest discount, with Mr. Siwicki and the Court advancing even higher minority interest discounts of 43% and 37%, respectively. I’ve suggested that the higher minority interest discounts are too high. In fact, many appraisers reference studies of closed-end funds and other market data to suggest minority discounts on the order of 10% to 15%. We developed a series of alternative calculations using this lower range of assumptions to show how the QMDM interrelates with differing minority interest discounts to develop appropriate marketability discounts. These calculations are in the context of the assumptions used in the case regarding distributions (either that a 3-year average was appropriate or that the 1992 level was appropriate).
They are further made in the context of Dr. Kursh’s QMDM assumptions. While in an independent analysis, we might have made somewhat different assumptions, Kursh’s assumptions appear generally reasonable and supported by the facts and circumstances of the case. See Table 9.
Since the relevant distribution yield in the QMDM is the yield at the marketable minority level, we might have used somewhat different distribution yields than Dr. Kursh. [We suggest performing a more detailed distribution analysis to convert the yield to a C Corporation equivalent yield.] So the distribution yields vary based on the indicated distributions (3-year and 1992) and minority interest discounts (10% and 15%), relative to the higher minority interest discounts and lower marketable minority indications used by the appraisers in WEINBERG.
We can now make several observations regarding the alternative calculations.
- The calculations using minority interest discounts of 10% and 15% and expected distributions of $800,000 yield conclusions of $7.1 million and $6.9 million, respectively. These indications are virtually identical to Dr. Kursh’s conclusion of $7.0 million using a 20% minority interest discount. All three calculations are valuing the same set of expected cash flows to limited partners. The difference in the assumptions are reconciled by different concluded marketability discounts (15% for Kursh and 21% and 24% in the alternative calculations).
This is not surprising. Hypothetical and real investors pay a price for an investment in the hope of achieving a target expected return. They do not care what the minority interest or marketability discounts might be. These discounts are tools used by appraisers to simulate the thinking of investors. As mentioned previously, all three calculations value the same expected cash flows and should yield similar results. In this regard, the QMDM is a forgiving tool. Mis-estimates in the minority interest discount tend to be offset by yield adjustments relative to the concluded marketable minority indications (for high distribution entities in particular).
- The calculations that assume the 3-year average distribution yield indications of $6.2 million and $6.3 million for assumed minority interest discounts of 15% and 10%, respectively. These are higher than the Court’s conclusion of $5.2 million, and Siwicki’s conclusion of $3.9 million. [The lower level of expected distributions (relative to the 1992 level) requires higher marketability discounts (32% and 29%, respectively). In other words, given a level of net asset value, a lower level of expected distributions requires a lower price. This observation is also consistent with Partnership Profiles data which suggest that low or non-distributing partnerships are priced at higher discounts to NAV than higher yielding partnerships.]
Recall that I believe the Court, following Siwicki’s methodology, overstated the minority interest discount. Because the Court’s effective 37% minority interest discount includes significant elements of a marketability discount (see the Fishman and Elliott discussions above), the application of a 20% marketability discount (larger than Kursh’s calculated discount of 15%) overstates the effective marketability discount relative to the alternate calculations with similar assumptions (and yields a lower conclusion).
- To put some final perspective on this issue, the Court’s conclusion represents a 13.2% yield based on capitalized distributions and 15.4% on likely distributions at the 1992 level of $800,000. It also represents a 50% discount to net asset value for an attractive, established, high distributing limited partnership interest. From an investment viewpoint, many taxpayers with much less attractive partnerships would be ecstatic with this result. The WEINBERG estate should definitely be pleased with the result.
[Readers should not infer that I am faulting the Court’s conclusion. Judge Whalen relied on economic evidence that was presented by one expert (Siwicki). Dr. Kursh’s report did not address the logical problems and theoretical issues with the use of Partnership Profiles data raised above by way of rebuttal. He did attempt to explain the problem in Court. However, as is seen by this E-LAW, whose length exceeds that of the Court’s entire decision or Dr. Kursh’s report, there is room for confusion. I do hope this E-LAW will help clarify the issues. We encourage all readers to review the cited sections of Fishman, Pratt and to access Elliott’s analysis.]
Conclusion
I do believe that Dr. Kursh’s analysis using the QMDM was helpful to the Court. It kept a clear focus on the impact of distribution yield on value. It allowed the Court for the first time (at least in a published decision) to focus on all the critical QMDM factors. It also gave the Court a basis to reach a conclusion of fair market value that was far more reasonable than that advanced by the taxpayer’s expert. As should be clear from the analysis above, it appears that Dr. Kursh “won” the battle over the appropriate marketability discount. He “lost” the battle over the appropriate minority interest discount. It is unfortunate that the Court’s comments seem critical of the QMDM, because the Court’s conclusion is entirely consistent with its application by Dr. Kursh.
Two final notes. First, I approach case reviews with caution and considerable trepidation. As an appraiser and a writer, I know that I am subject to review and analysis by other appraisers and courts. I always try to treat the work of other appraisers with respect and hope to receive similar treatment.
Second, it is possible that a case review of mine could be interpreted as critical of a Court or a particular trier of fact.
Again, I approach each case review with the utmost respect for the Court. In valuation cases, the trier of fact has a difficult job. He or she must deal with complex valuation issues, often presented in multiple valuation reports of varying quality, listen to and make judgments about expert testimony and factual issues, as well as deal with other relevant aspects of each case – and the judge has to write a decision that will be reviewed by multiple parties. I hope all readers of these case reviews will consider them in the context they are offered – as constructive and, hopefully, objective analyses to offer valuation insights to our readers.
Reprinted from Mercer Capital’s E-Law Newsletter 2000-03 & 2000-04, March 13, 2000.
