ESOP Appraisal for a Cyclical Business
The Employee Stock Ownership (ESOP) appraisal utilizes the same tools and techniques of any fair market value appraisal assignment, but with an added emphasis on analyst expertise in understanding the market, the economy, and the underlying business model for the subject company. The ESOP appraisal has the added sensitivity of the Plan participants and trustees who don’t like to see the value of allocated shares reflect a decline on the annual plan account statements, especially if it’s at redemption time.
We all recognize that in the real world, stocks frequently do decline in value, and closely held ESOP shares should be no exception. However, the appraiser of ESOP shares is in a unique position to interpret market, industry, and company performance in the context of a fair market value appraisal. This analysis is even more important for a cyclical company, where sales and earnings declines are expected but seldom forecast. As appraisers, we frequently utilize the tool of average or weighted average earnings in context with a specific company risk premium and earnings growth rate to develop a capitalization rate, or multiple of ongoing earnings. For an annual ESOP appraisal update, the use of average or weighted average earnings can work against the reality of the situation, and it is here that the analyst must have a firm grasp on the underlying trajectory of earnings as the subject company
navigates through the down cycle, in anticipation of the expected, but unknown, upside.
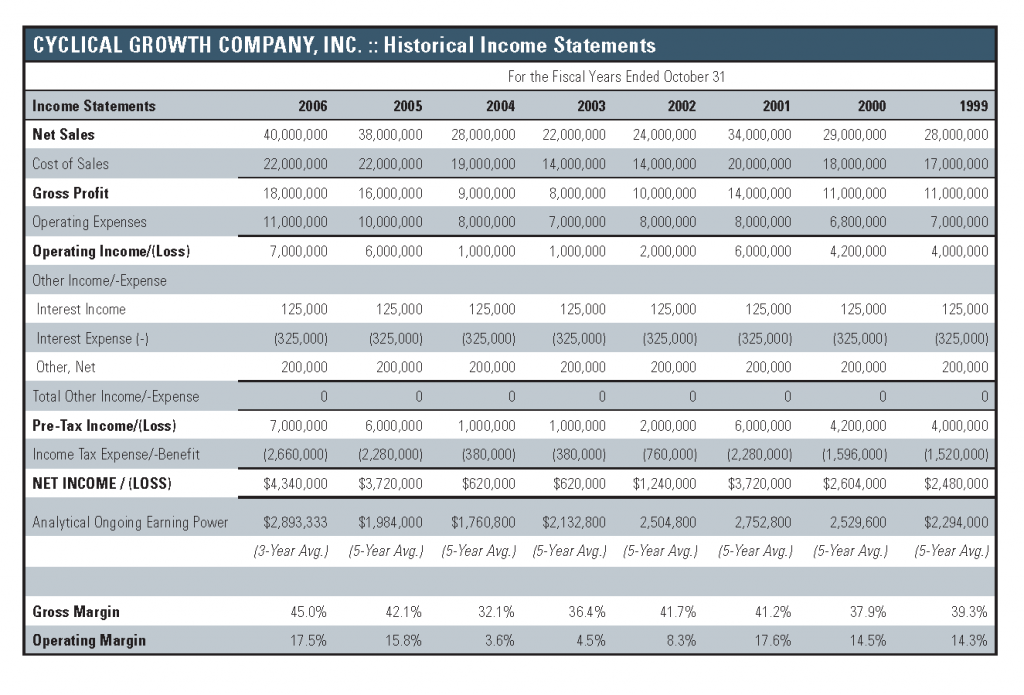
Consider the case of Cyclical Growth Company, Inc., (“CGC or the “Company”), a large manufacturer of industrial products, subject to normal business cycle fluctuations. The eight year summary of operations shown in Figure One reflects the peak of the last cycle and the recovery to date in 2006.
During the period 1999 – 2001, earnings are advancing but not at an accelerating rate, and appear in line with management’s expectation of a long term growth rate approximating 5%. With the benefit of hindsight, we know that 2001 was the peak of the cycle, we just don’t know that for the 2001 appraisal.
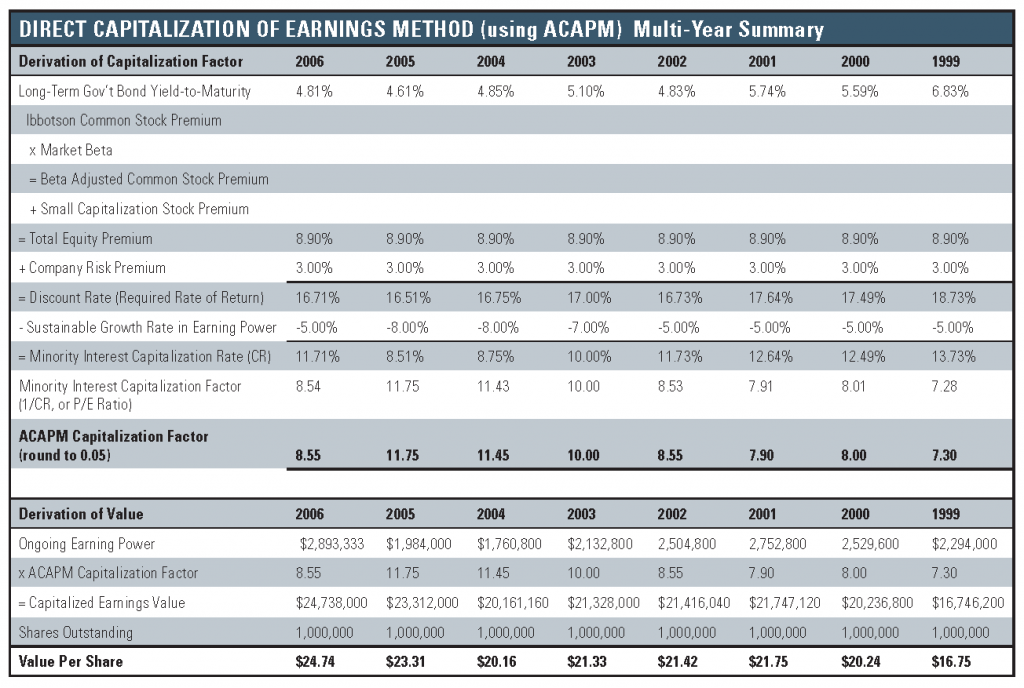
Accordingly, a reasonable derivation of the capitalization factor by means of the Adjusted Capital Asset Pricing Model during this time period may include using a 3% specific company risk premium and a 5% sustainable growth rate in earning power. As shown in Figure Two, this results in a multiple of earnings at 7.90x for 2001, applicable to ongoing earnings power.
When applied to the ongoing earning power of CGC, based on 5-year average earnings, a value of $21.75 per share is indicated. Again, this was the peak of the cycle, we just don’t know that yet.
By 2002, it is evident that this is the first year of the downturn. As shown in Figure One, earnings approximate one-third of prior levels and sales are down substantially. The Company is able to maintain about the same gross margin as in the prior year, but the cut in SG&A expenses is not enough to avoid an operating margin at about half of the peak (2001) year, although profitability is maintained. Specific company risk has not changed, although interest rates are now lower in the recession. Since the length and depth of the downturn are unknown, and the average earnings analysis has produced ongoing earnings of $2.5 million (versus reported earnings of $1.2 million), it may still be reasonable to expect a long term growth rate of earnings at 5%, resulting in only a modest decline in value compared to 2001.
By 2003, it is clear that the recession and decline in sales and earnings are for real. Reported earnings are now about half of 2002 and approximate about 16% of the peak (2001) year, although still profitable. The length and depth of the recession are still unknown, but recent history tells us that recessions are shorter than expansionary phases. The 5-year average earnings analysis still provides some moderation to ongoing earnings (now assuming a reasonable recovery). With the specific company risk premium unchanged, and given the underlying growth rate of earnings approximating 5%, it may now be feasible to assume that with earnings acceleration upon the recovery, the long term growth rate of earnings for the determination of a single-point capitalization rate may be 7%. This results in a higher multiple on lower earnings, which is exactly what the market would typically do if the Company were publicly traded.
By 2004, the sales decline has now ended, but profitability has not fully recovered, as the Company has maintained sales with lower margin products, and boosted SG&A expenses back to the 2002 – 2001 level. The operating margin at 3.6% is the lowest in the last six years, and earnings at $620,000 matches 2003’s performance, Management may have a feel for a prospective, but undefined recovery at this point, but we will not know that this is the nadir of the cycle until we can look back on it. Given the relatively low ongoing earnings based on the 5-year average earnings analysis, in context with a prospective, but undefined recovery, it may be reasonable to boost the growth rate of earnings to 8% for 2004, anticipating a recovery by 2005.
By 2006, the recovery is clearly in place, with sales and earnings greater than expected. The gross margin has improved to its highest level, exceeding the peak in 2002 – 2001. Operating expenses have increased too, with additional catch-up bonuses to employees who sought to maintain market share in the recession. The operating margin now approximates the peak in 2001. Earnings are at the highest level ever, at $4.3 million. With the Company clearly beyond the recession, it may be time to modify the average earnings analysis to a 3-year average, which picks up the two recovery years, but tempers that with the last diminutive year of the recession. From this recovery earnings level, the earnings growth rate as a component of the capitalization rate is no longer 8%, but can reasonably be expected to achieve the 5% projected by management.
During the economic cycle described, the Company has experienced significant changes in financial performance. While consistency is important in an ESOP appraisal, the analyst need not be crucified on the cross of consistency. Given the modest changes in interest rates, and a constant specific company risk premium, the key variables here involve the growth rate of earnings and the average earnings base (ongoing earnings) to which the capitalization multiple is applied. It is at this decisive analytical juncture that the seasoned analyst has an edge: experience counts. Experience with the variance of market cycles and the nature of equipment manufacturers during different phases of the economic cycle, in context with the legacy experience in the analysis of the Company and its management all comes together to provide an analytical perspective allowing the adjustment (and defense!) of key benchmarks in the multiple and the ongoing earnings to which it is applied. A summary of the capitalization of earnings approach since the peak in 2001 is shown in Figure Two.
In the case of Cyclical Growth Company, Inc., the analysis has reflected the reality of the marketplace at key junctures in the economic cycle. While the future is uncertain during the freefall part of the cycle, the averaging of earnings provides some moderation to the decline (assuming, of course, that earnings actually will recover). Moderating the growth rate at the proper time, based on experience, assigns a higher multiple to lower earnings, which is exactly what the public market does. Finally, with the recovery in place, a re-adjustment of the growth rate of earnings and the averaging process results in a reasonable assessment of the future at the valuation date. From the ESOP participant’s point of view, the per share value declined only modestly over three years, but not nearly as severely as the decline in earnings for those years, and the value upon recovery exceeds the prior peak in 2001.
If you need the experience of a seasoned analytical team to define and defend the appraisal of your ESOP, or for other business valuation resources, please give us a call at Mercer Capital to discuss your specific requirements in confidence.
Reprinted from Mercer Capital’s Transaction Advisor, Vol. 10, No. 2, September 2007.

