Video: Corporate Finance Basics for Directors and Shareholders
Below is the transcript of the above video, Corporate Finance Basics for Directors and Shareholders. In this video, Travis W. Harms, CFA, CPA/ABV, senior vice president of Mercer Capital, offers a short, yet thorough, overview of corporate finance fundamentals for closely held and family business directors and shareholders.

Hi, my name is Travis Harms, and I lead Mercer Capital’s Family Business Advisory practice. I welcome and thank you for taking a few minutes to listen to our discussion, “Corporate Finance Basics for Directors and Shareholders.”
Corporate finance does not need to be a mystery. In this short presentation, I will give you the tools and vocabulary to help you think about some of the most important long-term decisions facing your company.
To do this, we review the foundational concepts of finance, identify the three key questions of corporate finance, and then leverage those three questions to help think strategically about the future of your company.
Let’s start with the fundamentals of finance: return and risk.
Return measures the reward for making an investment. Investment returns come in two different forms: the first, distribution yield, is a measure of the annual distributions generated by an investment. The second, capital appreciation, measures the change in the value of an investment over time. Total return is the sum of these two components.
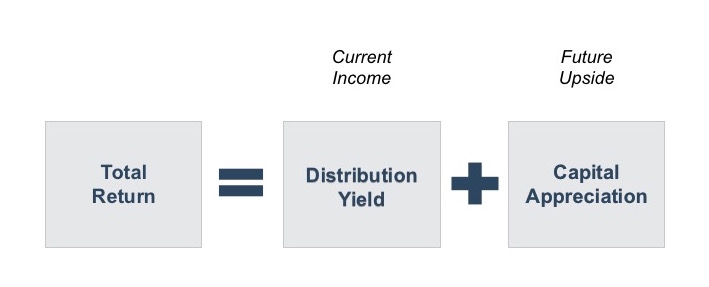
This is important because two investments may generate the same total return, although in very different forms. Some investments, like bonds, emphasize current income, while others, like venture capital, are all about capital appreciation. Many investments promise a mix of current income and future upside.
The most basic law of corporate finance is that return follows risk.
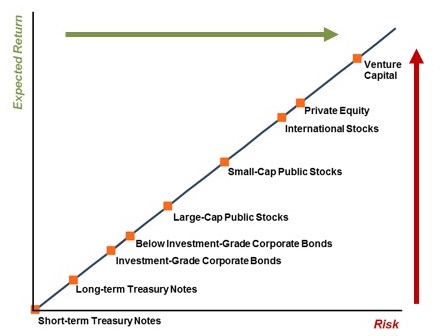
The above chart compares the expected return required by investors and the risk of different investments. Since investment markets are generally efficient, higher returns are available only by accepting greater risk.
But what is risk?
Simply put, risk is the fact that future investment outcomes are unknown. The wider the distribution of potential outcomes, the greater the risk.
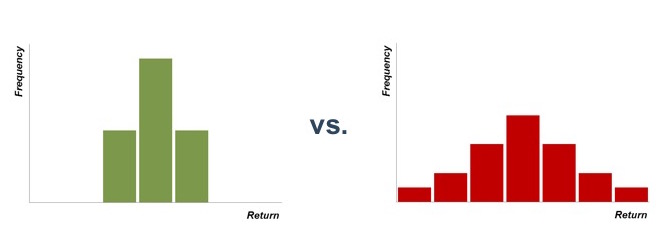
While both investments represented above are risky, the dispersion of outcomes for the investment on the right is wider than that on the left, so the investment on the right is riskier. Because it is riskier, it will have a higher expected return. Now, whether that higher return actually materializes is unknown when the investment is made – that’s what makes it risky.
For a particular company, the expected return is referred to as the company’s cost of capital. From a corporate finance perspective, the company stands between investors (who are potential providers of capital) and investment projects (which are potential uses of the capital provided by investors). The cost of capital is the price paid to attract capital from investors to fund investment projects.
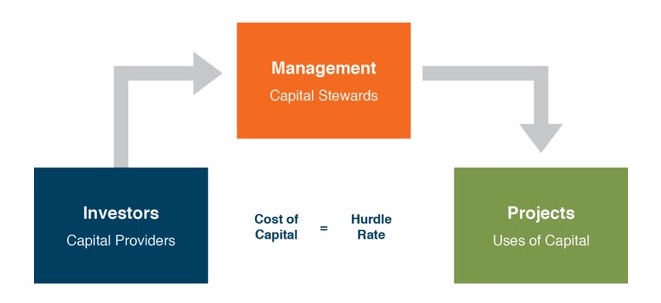
When evaluating potential investment projects, corporate managers use the cost of capital as the hurdle rate to measure the attractiveness of the project.
Next, we will move on to the three essential questions of corporate finance.
Corporate managers and directors should always be thinking about three fundamental corporate finance questions:
- First, what is the most efficient mix of capital? This the capital structure question – what is the mix of debt and equity capital that minimizes the company’s overall cost of capital?
- Second, what projects merit investment? This is the capital budgeting question – how does the company identify investment projects that will deliver returns in excess of the hurdle rate?
- And third, what mix of returns do shareholders desire? This is the distribution policy question – what is the appropriate mix of current income and future upside for the company’s investors?
Let’s start with the first question: what is the most efficient mix of capital?
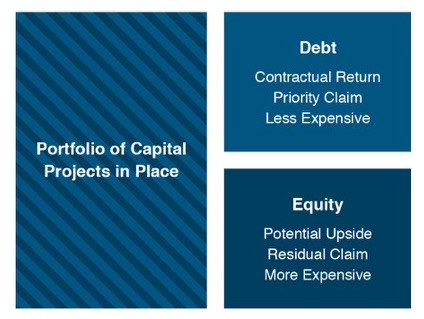
You can think of the company’s assets as a portfolio of individual capital projects – that is the left side of the balance sheet. The right side of the balance sheet tells us how the company has paid for those investments. The only two funding options are debt and equity. Because debt holders are promised a contractual return and have a priority claim on the assets and cash flows of the company, debt is less expensive than equity, which has only a residual claim on the company.
You can think of the company’s assets as a portfolio of individual capital projects – that is the left side of the balance sheet. The right side of the balance sheet tells us how the company has paid for those investments. The only two funding options are debt and equity. Because debt holders are promised a contractual return and have a priority claim on the assets and cash flows of the company, debt is less expensive than equity, which has only a residual claim on the company.
If debt is cheaper than equity, you might assume that a company could reduce its cost of capital by simply issuing more and more debt. That is not the case, however. As the company uses more debt, the risk of both the debt and the equity increase. And, as we said earlier, greater risk will cause both debt and equity investors to demand higher returns.
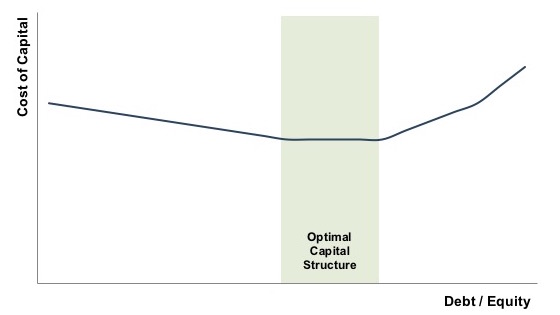
Eventually, because the cost of both components is increasing, the overall blended (or weighted average) cost of capital increases with increasing reliance on debt. The goal of capital structure analysis is to identify the optimal capital structure, or the mix of debt and equity that minimizes the company’s cost of capital.
Now let’s move on to the second question: what investment projects should the company devote capital to? At the strategic level, management’s job is to survey the landscape of potential investment projects, choosing those that are strategically compelling and financially favorable.
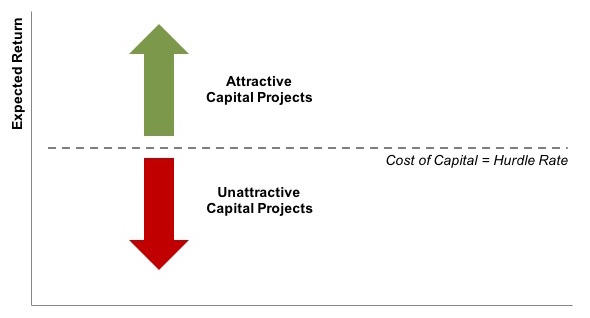
From a financial perspective, a potential investment project is attractive if the return from the expected cash flows meets or exceeds the hurdle rate, which is the cost of capital.
The appropriate pace of investment for a company is therefore related to the availability of attractive investment projects.
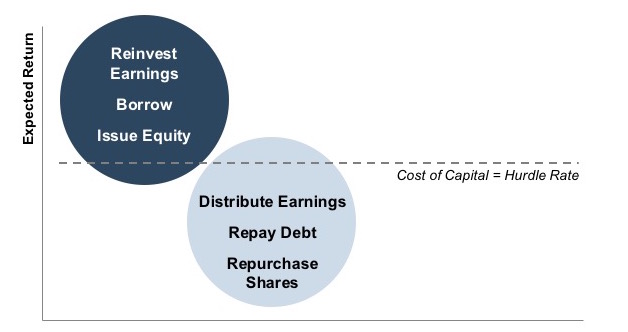
If attractive investment projects are abundant, the company should reinvest earnings into new projects, and, if yet more attractive projects are available, borrow money and/or issue new equity to fund the investment. If attractive investment projects are scarce, however, the company should return capital to investors through debt repayment, distribution of earnings, or share repurchase. We can now begin to see how the three questions are related to one another. Capital structure decisions are always made relative to the need for investment capital.
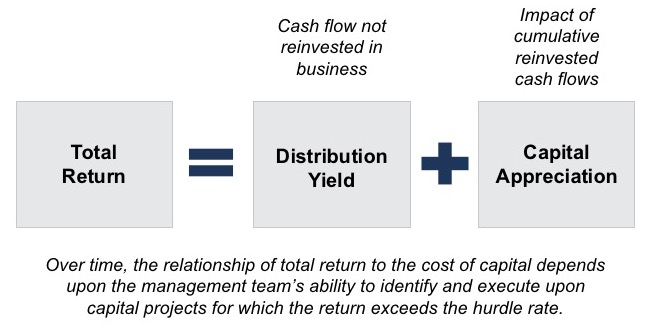
This inter-relationship is illustrated above within the context of the two components of total return we discussed earlier. Distribution yield provides a current return to shareholders from cash flow not reinvested in the business, while the cumulative impact of reinvested cash flows is manifest in the capital appreciation component of total return.
This leads us to the final corporate finance question, which relates to distribution policy: what mix of returns do shareholders desire?
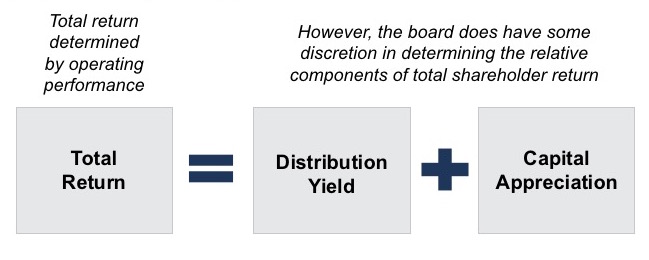
While the operating performance of the business ultimately determines total return, the board can tailor the components of that return to fit shareholder preferences better.
We’ve primarily been looking through the rearview mirror to assess what the company has done in the past; now it’s time to look through the windshield and think prospectively about capital structure, capital budgeting, and distribution policy going forward.
First, capital structure. In the long-run, the optimal capital structure will balance the cost of funds, flexibility, availability, and the risk preferences of the shareholders. Now, that last factor – shareholder preferences – should not be overlooked. Family businesses should not be managed for some abstract textbook shareholder, but rather for the actual family members that own the business.
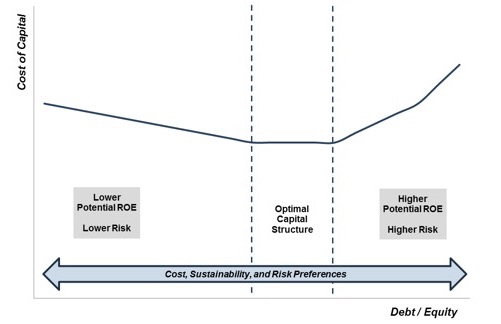
For example, while an under-leveraged capital structure reduces potential return on equity, it also reduces the risk of bankruptcy. Some shareholders may view this tradeoff favorably even if it can be demonstrated to be “sub-optimal” from a textbook standpoint.
Second, capital budgeting. The attractiveness of investment opportunities should be evaluated with reference to future – and not past – returns. Beyond the threshold question of whether such opportunities are in fact available, managers and directors should also consider financial and management constraints under which the company is operating and the desire of shareholders for diversification.
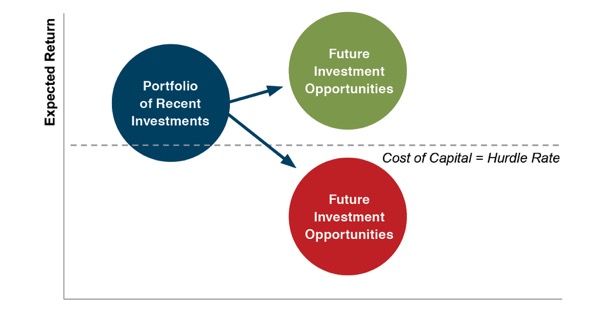
Since family business shareholders lack ready liquidity for their shares, they may have a greater desire to diversify their investment holdings away from the family business. In other words, they may favor foregoing some otherwise attractive investment opportunities in order to increase distributions that would help shareholders diversify.
Third, distribution policy. The appropriate form and amount of distributions should reflect shareholder preferences within the context of capital budgeting and capital structure decisions. Perhaps most importantly, a clearly communicated distribution policy enhances predictability for shareholders, and shareholders like predictability.
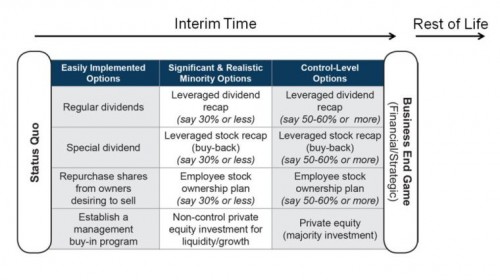
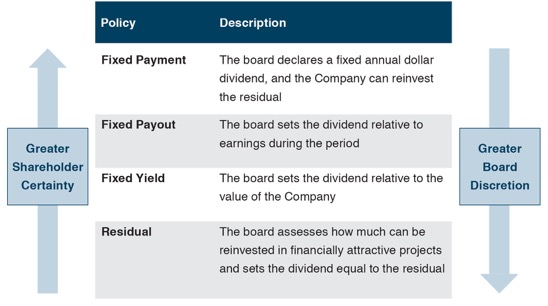 Family business shareholders should know which of the four basic options describes their company’s distribution policy.
Finally, to recap, each of the three questions relates to one another.
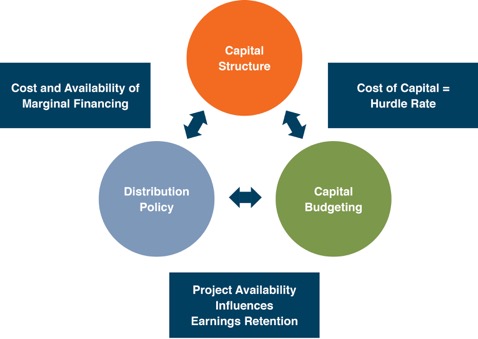
The company’s capital structure influences the cost of capital, which serves as the hurdle rate in capital budgeting decisions. The availability of attractive investment projects, in turn, determines whether earnings should be retained or distributed. Lastly, distribution policy affects, and is affected by, the cost and availability of marginal financing sources.
For a deeper dive into some of the topics we talked about, we have several whitepapers and other resources that you can download from our website.
The good news is that you do not have to have an advanced degree in finance to be an informed director or shareholder. With the concepts from this presentation, you can make relevant and meaningful contributions to your company’s strategic financial decisions. In fact, we suspect that a roomful of finance “experts” can actually be an obstacle to the sort of multi-disciplinary, collaborative decision-making that promotes the long-term health and sustainability of the company. Our family business advisory practice gives directors and shareholders a vocabulary and conceptual framework for thinking about and making strategic corporate finance decisions.
Again, my name is Travis Harms and I thank you for listening. If you’d like to continue the discussion further or have any questions about how we may help you, please give us a call.
Travis W. Harms, CFA, CPA/ABV
(901) 322-9760
Emerging Community Bank M&A Trends in 2017
As summer came to an end, the U.S. was treated with a historic event as the first total solar eclipse crossed the country since 1918. The timing of the event had social media and news outlets buzzing in a traditionally sleepy news month. For many, the event exceeded all expectations; for others, it was a dud that didn’t live up to the hype. My personal experience was a bit of both. The minutes of darkened skies were definitely memorable, but things returned to normal quickly as the sun shone brightly only minutes after.
Traditional M&A Trends
Community bank M&A trends also seem mixed. Rising regulatory burdens, weak margins from a historically low interest rate environment and heightened competition have crimped ROEs for years. Many pundits have predicted a rapid wave of consolidation and the demise of community banks in the years since the financial crisis. However, the pace of consolidation the last few years is consistent with the past three decades in which roughly 3-4% of the industry’s banks are absorbed through M&A yearly. The result is many fewer banks—5,787 at June 30 compared to about 15,000 in the mid-1980s when meaningful industry consolidation got underway.
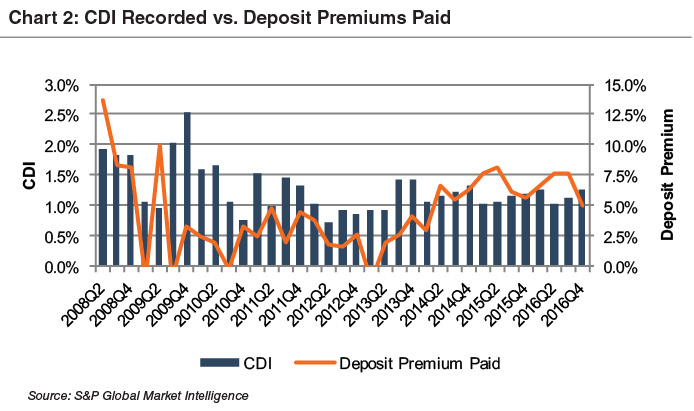
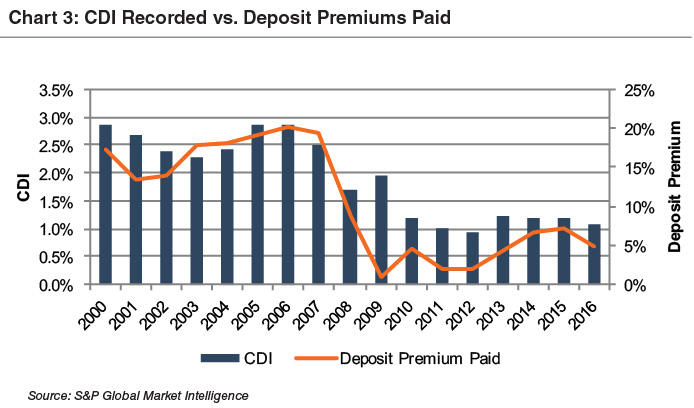
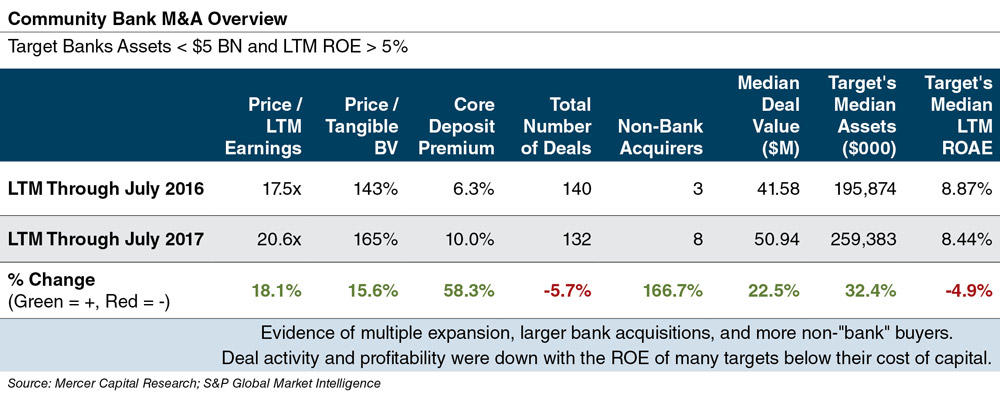
Somewhat surprisingly, the spike in bank stock prices following the November 2016 national elections did not cause M&A to accelerate. As would be expected, acquisition multiples increased in 2017 because publicly traded acquirers could “pay-up” with appreciated shares. As seen in the table on the next page, the median P/E and P/TBV multiples and the median core deposit premium increased for the latest twelve months (LTM) ended July 31, 2017 compared to the year ago LTM period. The ability of buyers—at least the publicly traded ones—to more easily meet sellers’ price expectations seemingly would lead more banks to sell. However, that has not happened as the pace of consolidation declined slightly to 132 transactions in the most recent LTM period compared to 140 in the year ago LTM time frame.
FinTech’s Impact on M&A
Another emerging M&A trend is the presence of non-traditional bank acquirers, which include private investor groups, non-bank specialty lenders, and credit unions. While a FinTech company has not yet announced an acquisition of a U.S. bank this year, several FinTechs have announced they are applying for a bank charter (SoFi, VaroMoney), and in the U.K., Tandem has agreed to acquire Harrods Bank.
So far, FinTech acquisitions of banks have been limited to a few acquisitions by online brokers and Green Dot Corporation’s acquisition of a bank in 2011. While FinTech companies have yet to emerge as active buyers, there have been some predictions that could change if regulatory hurdles can be navigated. Some FinTech companies are well-funded or have access to additional funding that could be tapped for a bank acquisition. In addition, an overlay of enhancing financial inclusion for the under-banked could mean bank transactions may not be as far-fetched as some may think.
Beyond serving as potential acquirers, FinTech continues to emerge as an important piece of the community banking puzzle of how to engage customers through digital channels as the costly branch banking model sees usage decline year-after-year. Many FinTechs are eager to partner with banks to scale their operations for greater profitability, thereby better positioning themselves for a successful exit down the road.
Consistent with this trend, we have also seen some acquirers (and analysts) comment on FinTech as a benefit of a transaction, as opposed to (or at least in addition to) the historical focus on geographic location, credit quality, asset size, and profitability. We will be watching to see if FinTech initiatives, whether internally developed or acquired, become a bigger driving force in bank M&A. If so, acquisitions of FinTech companies by traditional banks may increase (as discussed more fully in this article).
As these trends grow in importance, buyers and sellers will have to grapple with unique valuation and transaction issues that require each to fully understand the value of the seller and the buyer, assuming a portion of the consideration consists of the buyer’s shares. Whether that buyer includes a traditional bank whose stock is private or a non-bank buyer, such as a specialty lender or FinTech company, we have significant valuation and transaction expertise to help your bank understand the deal landscape and the strategic options available to it.
If we can be of assistance, give us a call to discuss your needs in confidence.
This article originally appeared in Mercer Capital’s Bank Watch, August 2017.
Fairness Opinions Do Not Address Regrets
Sometimes deals can go horribly wrong between the signing of a merger agreement and closing. Buyers can fail to obtain financing that seemed assured; sellers can see their financial position materially deteriorate; and a host of other “bad” things can occur. Most of these lapses will be covered in the merger agreement through reps and warranties, conditions to close, and if necessary, the nuclear trigger that can be pushed if negotiations do not produce a resolution: the material adverse event clause (MAEC). And MAEC = litigation.
Bank of America’s (BAC) 2008 acquisition of Countrywide Financial Corporation will probably be remembered as one of the worst transactions in U.S. history, given the losses and massive fines that were attributed to Countrywide. BAC management regretted the follow-on acquisition of Merrill Lynch so much that the government held CEO Ken Lewis’ feet to the fire when he threatened to trigger MAEC in late 2008 when large swaths of Merrill’s assets were subjected to draconian losses. BAC shareholders bore the losses and were diluted via vast amounts of common equity that were subsequently raised at very low prices.
Another less well-known situation from the early crisis years is the acquisition of Charlotte-based Frist Charter Corporation (FCTR) by Fifth Third Bancorp (FITB). The transaction was announced on August 16, 2007 and consummated on June 6, 2008. The deal called for FITB to pay $1.1 billion for FCTR, consisting 30% of cash and 70% FITB shares with the exchange ratio to be set based upon the five day closing price for FITB the day before the effective date. At the time of the announcement FITB expected to issue ~20 million common shares; however, 45 million shares were issued because FITB shares fell from the high $30s immediately before the merger agreement was signed to the high teens when it was consummated. (The shares would fall to a closing low of $1.03 per share on February 20, 2009; the shares closed at $25.93 per share on July 14, 2017.) The additional shares were material because FITB then had about 535 million shares outstanding. Eagerness to get a deal in the Carolinas may have caused FITB and its advisors to agree to a fixed price / floating exchange ratio structure without any downside protection.
A more recent example of a deal that may entail both buyer and seller regrets is Canadian Imperial Bank of Commerce’s (CIBC) now closed acquisition of Chicago-based Private Bancorp Inc. (PVTB). A more detailed account of the history of the transaction can be found here. The gist of the transaction is that PVTB entered into an agreement to be acquired by CIBC on June 29, 2016 for 0.3657 CIBC shares that trade in Toronto (C$) and New York (US$), and $18.80 per share of cash. At announcement the transaction was valued at $3.7 billion, or $46.20 per share. As U.S. bank stocks rapidly appreciated after the November 8 national elections, institutional investors began to express dismay because Canadian stocks did not advance. In early December, proxy firms recommended shareholders vote against the deal. A mid-December shareholder vote was then postponed.
CIBC subsequently upped the consideration two times. On March 31, 2017, it proposed to acquire PVTB for 0.4176 CIBC shares and $24.20 per share of cash. On May 4, CIBC further increased the cash consideration by $3.00 to $27.20 per share because its shares had trended lower since March as concerns intensified about the health of Canada’s housing market. On May 12, shareholders representing 66% of PVTB’s shares approved the acquisition.
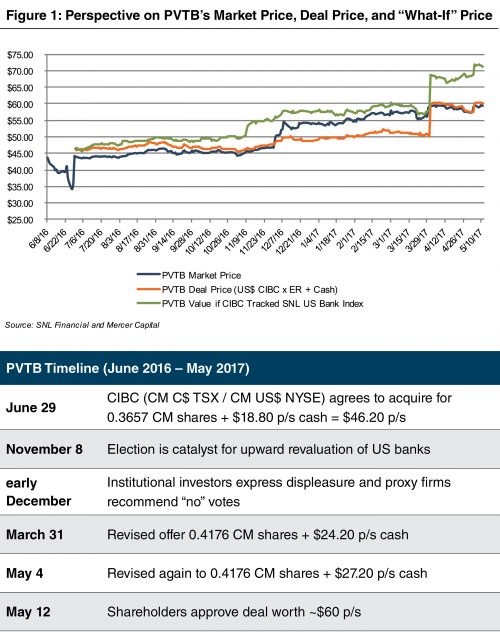
Figure 1 highlights the trouble with the deal from PVTB shareholders’ perspective. While the original deal entailed a modest premium, the performance of CIBC’s shares and the sizable cash consideration resulted in little change in the deal value based upon the original terms. On March 30 the deal equivalent price for PVTB was $50.10 per share, while the market price was $59.00 per share. The following day when PVTB upped the consideration the offer was valued at $60.11 per share; however, the revised offer would have been worth nearly $69 per share had CIBC’s shares tracked the SNL U.S. Bank Index since the agreement was announced on June 29. On May 11 immediately before the shareholder vote the additional $3.00 per share of cash offset the reduction in CIBC’s share price such that transaction was worth ~$60 per share, while the “yes-but” value was over $71 per share had CIBC’s shares tracked the U.S. index since late June.
Fairness opinions do not cover regret, but there are some interesting issues raised when evaluating fairness from a financial point of view of both PVTB and CIBC shareholders. (Note: Goldman Sachs & Co. and Sandler O’Neill & Partners provided fairness opinions to PVTB as of June 29 and March 30. The registration statement does not disclose if J.P. Morgan Securities provided a fairness opinion as the lead financial advisor to CIBC. The value of the transaction on March 30 when the offer was upped the second time was $4.9 billion compared to CIBC’s then market cap of US$34 billion.)
Fairness is a Relative Concept
Some transactions are not fair, some are reasonable, and others are very fair. The qualitative aspect of fairness is not expressed in the opinion itself, but the financial advisor conveys his or her view to management and a board that is considering a significant transaction. When the PVTB deal was announced on June 29, it equated to $46.35 per share, which represented premiums of 29% and 14% to the prior day close and 20-day average closing price. The price/tangible book value multiple was 220%, while the P/E based upon the then 2016 consensus estimate was 18.4x. As the world existed prior to November 8, the multiples appeared reasonable but not spectacular.
Fairness Does not Consider 20-20 Hindsight Vision
Fairness opinions are qualified based upon prevailing economic conditions; forecasts provided by management and the like and are issued as of a specific date. The opinion is not explicitly forward looking, while merger agreements today rarely require an affirmation of the initial opinion immediately prior to closing as a condition to close. That is understandable in the context that the parties cut a deal that was deemed fair to shareholders from a financial point of view when signed. In the case of PVTB, the future operating environment (allegedly) changed with the outcome of the national election. Banks were seen as the industry that would benefit from a combination of lower corporate tax rates, less regulation, faster economic growth, and higher rates as part of the “reflation trade.” A reasonable deal became not so reasonable if not regrettable when the post November 8 narrative excluded Canadian banks. Time will tell if PVTB’s earning power really will improve, or whether the move in bank stocks was purely speculative.
Subtle Issues Sometimes Matter
Although not a major factor in the underperformance of CIBC’s shares vis-à-vis U.S. banks, the Canadian dollar weakened from about C$1.30 when the merger was announced on June 29 to C$1.33 in early December when the shareholder meeting was postponed. When shareholders voted to approve the deal on May 12 the Canadian dollar had eased further to C$1.37. The weakness occurred after the merger agreement was signed and the initial fairness opinions were delivered on June 29. Sometimes seemingly small financial issues can matter in the broad fairness mosaic, but only with the clarity of hindsight.
Waiting for a Better Deal is not a Fairness Consideration
Although a board will consider the business case for a transaction and strategic alternatives, a fairness opinion does not address these issues. The original registration statement noted that Private was not formally shopped. The deal was negotiated with CIBC exclusively, which twice upped its initial offer before the merger agreement was signed in June. It was noted that the likely potential acquirers of PVTB were unable to transact for various reasons. The turn of events raises an interesting look-back question: should the board have waited for a better competitive situation to develop? We will never know; however, the board is given the benefit of the doubt because it made an informed decision given what was then known.
The Market Established a Fair Price
Institutional shareholders had implicitly rejected what became an unfair deal by early December when PVTB’s shares traded well above the deal price. The market combined with the “no” recommendation of three proxy firms forced PVTB to delay the special meeting. The increase in the consideration in late March pushed the deal price to a slight premium to PVTB’s market price. CIBC increased the cash consideration an additional $3.00 per share in early May to offset a decline in CIBC’s shares that had occurred since the consideration was increased in March. The market had in effect established its view of a fair price. While CIBC could have declined to up its offer yet again, it chose to offset the decline.
Relative Fairness from CIBC’s Perspective Fluctuated
What appeared to be a reasonable deal from CIBC’s perspective in June became exceptionally fair by early December, if the market is correct that the earning power of U.S. commercial banks will materially improve as a result of the November 8 election. CIBC’s financial advisors can easily change assumptions in Excel spreadsheets to justify a higher price based upon better future earnings than originally projected, but would doing so be “fair” to CIBC shareholders whether expressed euphemistically or formally in a written opinion? So far the evidence of higher earning power is indirect via the market placing a higher multiple on current bank earnings in expectation of much better earnings that will not be observable until 2018 or 2019. That as a stand-alone proposition is an interesting valuation attribute to consider as part of a fairness analysis both from PVTB’s and CIBC’s perspective.
Conclusion
Hindsight is easy; predicting the future is a fool’s errand. Fairness opinions do not opine where securities will trade in the future. Some PVTB shareholders may have regrets that CIBC was not a U.S. commercial bank whose shares would have
out-performed CIBC’s after November 8. CIBC shareholders may regret the PVTB acquisition even though U.S. expansion has been a top priority. The key, as always in any M&A transaction, will be execution over the next several years rather than the PowerPoint presentation. Higher rates, a faster growing U.S. economy and the like will help, too, if they occur.
We at Mercer Capital cannot predict the future, but we have over three decades of experience in helping boards assess transactions as financial advisors. Sometimes paths and fairness from a financial point of view seem clear; other times they do not. Please call if we can assist your company in evaluating a transaction.
This article originally appeared in Mercer Capital’s Bank Watch, July 2017.
Creating Value at Your Community Bank Through Developing a FinTech Framework
This discussion is adapted from Section III of the new book Creating Strategic Value Through Financial Technology by Jay D. Wilson, Jr., CFA, ASA, CBA.
I enjoyed some interesting discussions between bankers, FinTech executives, and consultants at the FinXTech event in NYC in late April. One dominant theme at the event was a growing desire of both banks and FinTech companies to find ways to work together. Whether through partnerships or potential investments and acquisitions, both banks and FinTech companies are coming to the conclusion that they need each other. Banks control the majority of customer relationships, have a stark funding advantage and know how to navigate the maze of regulations, while FinTechs represent a means to achieve low-cost scaling of new and traditional bank services. So one key question emerging from these discussions is: Who will survive and thrive in the digital age? As one recent Tearsheet article that I was quoted in asked: Should fintech startups buy banks? Or as another article discussed: Will banks be able to compete against an army of Fintech startups?
Build, Partner, or Acquire
Banks face a conundrum of whether they should build their own FinTech applications, partner, or acquire. FinTech companies face similar questions, though the questions are viewed through the prism of customer acquisition rather than applications. Non-control investments of FinTech companies by banks represent a hybrid strategy. Regulatory hurdles limit the ability of FinTech companies to make anything more than a modest investment in banks absent bypassing voting common stock for non-voting common and/or convertible preferred.
While these strategic decisions will vary from company to company, the stakes are incredibly high for all. We can help both sides navigate the decision process.
As I noted in my recently published book, community banks collectively remain the largest lenders to both small business and agricultural businesses, and individually, they are often the lifeblood for economic development within their local communities. Yet the number of community banks declines each year through M&A, while some risk loosened deposit relationships as children who no longer reside in a community where the bank is located inherit the financial assets of deceased parents. FinTech can loosen those bonds further, or it can be used to strengthen relationships while providing a means to deliver services at a lower cost.
Where to Start
In my view, it is increasingly important for bankers to develop a FinTech framework and be able to adequately assess potential returns from FinTech partnerships. Similar to other business endeavors, the difference between success and failure in the FinTech realm is often not found in the ideas themselves, but rather, in the execution.
Banks face a conundrum of whether they should build their own FinTech applications, partner, or acquire.
While a bank’s FinTech framework may evolve over time, it will be important to provide a strategic roadmap for the bank to optimize chances of success. Within this framework, there are a number of important steps:
- Determining which FinTech niche to pursue;
- Identifying potential FinTech companies/partners;
- Developing a business case for those potential partners and their solutions; and
- Executing the chosen strategy.
For a number of banks, the use of FinTech and other enhanced digital offerings represents a potential investment that uses capital but may be deemed to have more attractive returns than other traditional bank growth strategies. Community banks typically underperform their larger brethren (as measured by ROE and ROA) because fee income is lower and expenses are higher as measured by efficiency ratios. Both areas can be enhanced through deployment of a number of FinTech offerings/solutions.
The Importance of a Detailed IRR Analysis
The decision process for whether to build, partner, or acquire requires the bank to establish a rate of return threshold, which arguably may be higher than the institution’s base cost of capital given the risk that can be associated with FinTech investments. The range of returns for each strategy (build, partner, or acquire) for a targeted niche (such as payments or wealth management) provides a framework to help answer the question how to proceed just as is the case with the question of how to deploy capital for organic growth, acquisitions, and shareholder distributions. The same applies for FinTech companies, though often the decision is in the context of whether to accept dilutive equity capital.
A detailed analysis, including an IRR analysis, helps a bank determine the financial impact of each strategic decision and informs the optimal course.
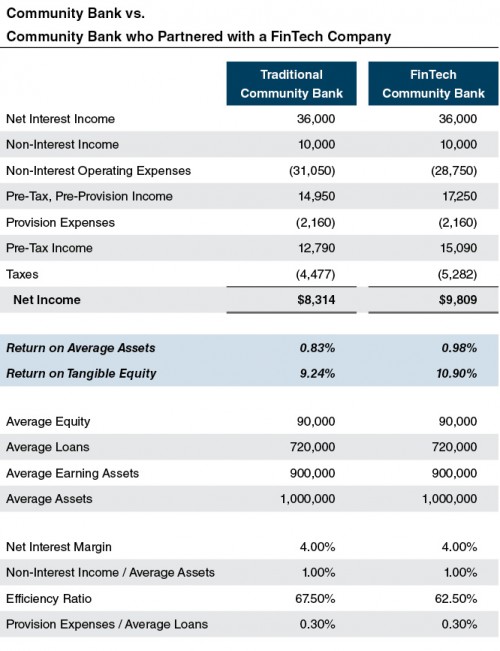
While each option presents a unique set of considerations and execution issues/risks, a detailed analysis, including an IRR analysis, helps a bank determine the financial impact of each strategic decision and informs the optimal course. A detailed analysis also allows the bank to compare its FinTech strategy to the bank’s more traditional growth strategies, strategic plan, and cost of capital. See the table to the right for an example of a traditional community bank compared to a bank who has partnered with a FinTech company.
Questions Regarding Partnering
Beyond the strategic decisions and return analyses, some additional questions remain for community banks that consider FinTech partners, including:
- Is the bank comfortable with the FinTech company’s risk profile?
- What will the regulatory reaction be?
- Who will maintain the primary relationship with the customer?
- Is the FinTech partnership consistent with the bank’s long-term strategic plan (a key topic noted in the OCC’s whitepaper on supporting innovation)?
Questions Regarding Acquiring
Should the community bank ultimately decide to invest in a FinTech partner a number of other key questions emerge, such as:
- What is the valuation of the FinTech company?
- How should the investment be structured?
- What preferences or terms should be included in the shares purchased from the FinTech company?
- Should the bank obtain board seats or some control over the direction of the FinTech Company’s operations?
How Mercer Capital Can Help
To help both banks and FinTech companies execute their optimal strategies and create maximum value for their shareholders, we have a number of solutions here at Mercer Capital. We have a book that provides greater detail on the history and outlook for the FinTech industry, as well as containing targeted information to help bankers answer some of the key questions discussed here.
Mercer Capital has a long history of working with banks. We are aware of the challenges facing community banks. With ROEs for the majority below 10% and their cost of capital, it has become increasingly difficult for many banks to deliver adequate returns to shareholders even though credit costs today, are low. Being both a great company that delivers benefits to your local community, as well as one that delivers strong returns to shareholders is a difficult challenge. Confronting the challenge requires a solid mix of the right strategy as well as the right team to execute that strategy.
No one understands community banks and FinTech as well as Mercer Capital.
Mercer Capital can help your bank craft a comprehensive value creation strategy that properly aligns your business, financial, and investor strategy. Given the growing importance of FinTech solutions to the banking sector, a sound value creation strategy needs to incorporate FinTech into it and Mercer Capital can help.
- We provide board/management retreats to educate you about the opportunities and challenges of FinTech for your institution.
- We can identify which FinTech niches may be most appropriate for your bank given your existing market opportunities.
- We can identify which FinTech companies may offer the greatest potential as partners for your bank.
- We can provide assistance with valuations should your bank elect to consider investments or acquisitions of FinTech companies.
No one understands community banks and FinTech as well as Mercer Capital. We are happy to help. Contact me to discuss your needs.
This article first appeared in Mercer Capital’s Bank Watch, June 2017.
Infographic: 5 Reasons to Conduct a Shareholder Survey
Of all the well-worn clichés that should be retired, “maximizing shareholder value” is surely toward the top of the list. Since private companies don’t have constant public market feedback, attempts to “maximize” shareholder “value” are destined to end in frustration. While private company managers are not able to gauge instantaneous market reaction to their performance, they do know who their shareholders are. Wouldn’t it be better to make corporate decisions based on the characteristics and preferences of actual flesh-and-blood shareholders than the assumed preferences of generic shareholders that exist only in textbooks? If so, there is no substitute for simply asking. Here’s a quick list of five good reasons for conducting a survey of your shareholders.
For more information about conducting a shareholder survey, check out the article “5 Reasons to Conduct a Shareholder Survey.”
To discuss how a shareholder survey or ongoing investor relations program might benefit your company, learn more about our Corporate Finance Consulting or give us a call.
Corporate Finance Basics for Directors and Shareholders
To craft an effective corporate strategy, management and directors must answer the three fundamental questions of corporate finance.
- The Capital Structure question: What is the most efficient mix of capital?
- The Capital Budgeting question: Which projects merit investment?
- The Dividend Policy question: What mix of returns do shareholders desire?
These questions should not be viewed as the special preserve of the finance team. To maintain a healthy governance culture, all directors and shareholders need to have a voice in how these long-term decisions are made. This presentation is an example of the topics that we cover in education sessions with directors and shareholders. The purpose of the presentation is to provide directors and shareholders with a conceptual framework and vocabulary to help contribute to answering the three fundamental questions.
5 Reasons to Conduct a Shareholder Survey
Of all the well-worn clichés that should be retired, “maximizing shareholder value” is surely toward the top of the list. Since private companies don’t have constant public market feedback, attempts to “maximize” shareholder “value” are destined to end in frustration. While private company managers are not able to gauge instantaneous market reaction to their performance, they do know who their shareholders are. Wouldn’t it be better to make corporate decisions based on the characteristics and preferences of actual flesh-and-blood shareholders than the assumed preferences of generic shareholders that exist only in textbooks? If so, there is no substitute for simply asking. Here’s a quick list of five good reasons for conducting a survey of your shareholders.
- A survey will help you learn about your shareholders. A well-crafted shareholder survey will go beyond mere demographic data (age and family relationships) to uncover what deeper characteristics owners share and what characteristics distinguish owners from one another. We recently completed a survey for a multi-generation family company, and not surprisingly, one of the findings was that the shareholder base included a number of distinct “clienteles” or groups of shareholders with common needs and risk preferences. What was surprising was that the clienteles were not defined by age or family tree branch, but rather by the degree to which (a) the shareholder’s household income was concentrated in distributions from company stock, and (b) the shareholder’s personal wealth was concentrated in company stock. The boundary lines for the resulting clienteles did not fall where management naturally assumed.
- A survey will help you gauge shareholder preferences. The results from a shareholder survey will help directors and managers move away from abstract objectives (like “maximizing shareholder value”) toward concrete objectives that actually take into account shareholder preferences. For example, what are shareholder preferences for near-term liquidity, current distributions, and capital appreciation? Identifying these preferences will enable directors and shareholders to craft a coherent strategy that addresses actual shareholder needs. Conducting a survey does not mean that the board is off-loading its fiduciary responsibility to make these decisions to the shareholders: a survey is not a vote. Rather, it is a systematic means for the board to solicit shareholder preferences as an essential component of deliberating over these decisions.
- A survey will help educate the shareholders about the strategic decisions facing the company. While a survey provides information about the shareholders to the company, it also inevitably provides information about the company to shareholders. In our experience, the survey is most effective if preceded by a brief education session that reviews the types of questions that will be asked in the survey. Shareholders do not need finance degrees to be able to understand the three basic decisions that every company faces: (1) how should we finance operations and growth investments (capital structure), (2) what investments should we be making (capital budgeting), and (3) what form should shareholder returns take (distribution policy). Educated shareholders can provide valuable input to directors and managers, and will prove to be more engaged in management’s long-term strategy.
- A survey will help establish a roadmap for communicating operating results to shareholders. Public companies are required by law to communicate operating results to the markets on a timely basis, and many public companies invest significant resources in the investor relations function because they recognize that it is critical that the markets understand not just the bare “what happened” of financial reporting, but the “why” of strategy. Oddly, for most private companies, there is no roadmap for communicating results, and investor relations is either ignored or consists of reluctantly answering potentially-loaded questions from disgruntled owners (who may, frankly, enjoy being a nuisance). A shareholder survey can be a great jumping-off point for a more structured process for proactively communicating operating results to shareholders. An informed shareholder base that understands not only “what happened” but also “why” is more likely to take the long-view in evaluating performance.
- A survey gives a voice to the “un-squeaky” wheels. A shareholder’s input should not be proportionate to the volume with which the input is given. While the squeaky wheel often gets the grease, it is prudent for directors and managers to solicit the feedback regarding the needs and preferences of quieter shareholders. Asking for input from all shareholders through a systematic survey process helps ensure that the directors and managers are receiving a balanced picture of the shareholder base. A confidential survey administered by an independent third party can increase the likelihood of receiving frank (and therefore valuable) responses.
An engaged and informed shareholder base is essential for the long-term health and success of any private company, and a periodic shareholder survey is a great tool for achieving that result. To discuss how a shareholder survey or ongoing investor relations program might benefit your company, give one of our senior professionals a call.
Is FinTech a Threat or an Opportunity?
Adapted from the new book Creating Strategic Value Through Financial Technology by Jay D. Wilson, Jr., CFA, ASA, CBA.
In order to understand how FinTech can help community banks create strategic value, let us take a closer look at the issues facing community banks and discuss how FinTech can help improve performance and valuation. This is significant, particularly in the U.S., as community banks compose an important part of the economy, constitute the majority of banks in the U.S. and are collectively the largest providers of certain loan types such as agricultural and small business lending.
Threats to Community Banks
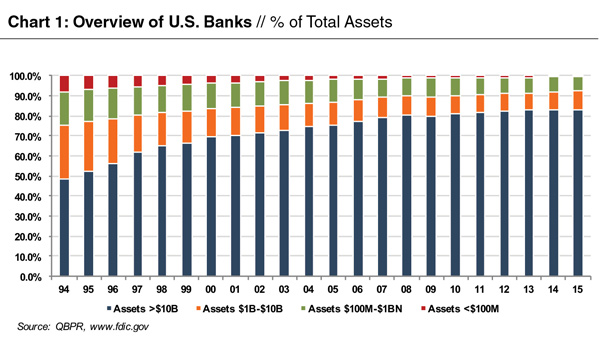
There are nearly 6,000 community banks with 51,000 locations in the U.S. (includes commercial banks, thrifts, and savings institutions). While community banks constitute the vast majority of banks (approximately 90% of U.S. banks have assets below $1 billion), the majority of banking industry assets are controlled by a small number of extremely large banks. These larger banks have acquired assets more quickly than community banks in the last few decades (as shown in Chart 1).
In addition to competition from larger banks and industry headwinds, community bankers are also attempting to assess and respond to the growing threat from the vast array of FinTech companies and startups taking aim at the banking sector. For perspective, a group of community bankers meeting with the FDIC in mid-2016 noted that FinTech poses the largest threat to community banks. One executive indicated that the payment systems “are the scariest” as consumers are already starting to use FinTech applications like Venmo and PayPal to send peer-to-peer payments. Another banker went on to note, “What’s particularly concerning about [the rise of FinTech] for us is the pace of change and the fact that it’s coming so quickly.”
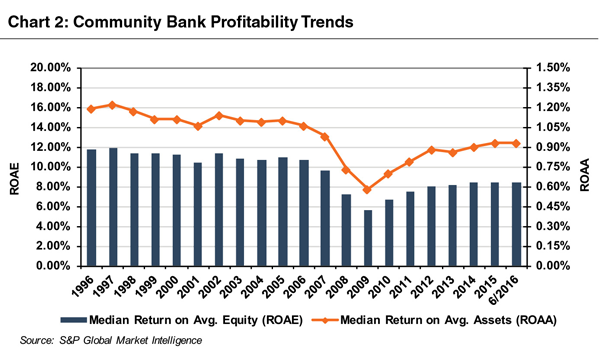
These significant competitive pressures combined with other industry headwinds such as higher regulatory and compliance costs and a historically low interest rate environment have hurt returns on equity (ROEs) for community banks (Chart 2).
Opportunities for Community Banks
While many bankers view FinTech as a significant threat, FinTech also has the potential to assist the community banking sector. FinTech offers the potential to improve the health of community banks by enhancing performance and improving profitability and ROEs back to historical levels.
One way to better understand how FinTech can assist community banks is to understand where the Big Banks are outperforming smaller banks. Big Banks (defined as those with assets greater than $5 billion) have outperformed community banks consistently for many years. In the 20-year period from 1996 to 2016, Big Banks reported a higher return on asset (ROA) than community banks in each period except for 2009 (the depths of the financial crisis). Interestingly though, the source of outperformance is not due to net interest margin, perhaps the most common performance metric that bankers often focus on. Community banks had consistently higher net interest margins than Big Banks in each year over that 20-year period (1996-2016). Rather, the outperformance of the Big Banks can be attributed to their generation of greater non-spread revenues (i.e., non-interest income) and lower non-interest expense (i.e., lower efficiency ratios).
FinTech and Non-Interest Income and Efficiency Ratios
While FinTech can benefit community banks in a number of areas, FinTech offers some specific solutions where community banks have historically underperformed: non-interest income and efficiency. To enhance non-interest income, community banks may consider a number of FinTech innovations in niches like payments, insurance, and wealth management. Since many community banks have minimal personnel and legacy systems in these areas, they may be more apt to try a new FinTech platform in these niches. For example, a partnership with a robo-advisor might be viewed more favorably by a community bank as it represents a new source of potential revenue, another service to offer their customers and it will not cannibalize their existing trust or wealth management staff since they have minimal existing wealth management personnel.
FinTech can also enhance efficiency ratios and reduce expenses for community banks. Branch networks are the largest cost of community banks and serving customers through digital banking costs significantly less than traditional in-branch services and interactions with customers. For example, branch networks make up approximately 47% of banks’ operating costs and 54% of that branch expenditure goes to staffing. Conversely, the cost of ATM and online-based transactions are less than 10% of the cost of paper-based branch transactions in which tellers are involved. In addition to the benefits from customers shifting to digital transactions, community banks can utilize FinTech to assist with lowering regulatory/compliance costs by leveraging “reg-tech” solutions.
To illustrate the potential financial impact of transitioning customers to digital transactions for community banks, let’s assume that a mobile transaction saves the bank approximately $3.85 per branch transaction. If we assume that FinTech Community Bank has 20,000 deposit accounts and each account shifts two transactions per month to mobile from in-person branch visits, the bank would save approximately $150 thousand per month and approximately $1.8 million annually. These enhanced earnings would serve to enhance efficiency and improve shareholder returns and the bank’s valuation.
Moving beyond non-interest income and efficiency ratios, FinTech also offers a number of other potential benefits for community banks. FinTech can be used to help community banks compete against Big Banks more effectively by minimizing the impact of scale as more customers carry their branch in their pocket. By leveraging FinTech solutions, smaller banks can more easily compete against a large bank’s footprint digitally via the web or a mobile device. FinTech also offers many community banks an opportunity to enhance loan portfolio diversification and regain some market share after years of losing ground in certain segments (such as consumer, mortgage, auto, and student).
FinTech can also provide an additional touch point to improve customer retention and preference. While data is limited, some studies have shown that customer loyalty (i.e., retention) is higher for those customers that use mobile offerings and digital banking (online and mobile) is increasingly preferred by customers. While digital is clearly growing among customer preference, data has also shown that digital-only customers can be less engaged, loyal, and profitable than those who interact with the bank through a combination of interactions across multiple channels (digital, branches, etc.). So community banks that rely more heavily on their branch networks should find it beneficial to add digital services to complement their traditional offerings in order to enhance customer retention and preference.
Change Is Inevitable, Growth Is Optional
As technological advances continue to penetrate the banking industry, community banks will need to leverage technology in order to more effectively market to and serve small businesses and consumers in an evolving environment. Community banks will likely increasingly rely on a model that makes widespread use of ATM’s, the Internet, mobile apps and algorithm driven decision making, enabling them to deliver their services to customers in a streamlined and efficient manner.
Conclusion
Our world is changing quickly. FinTech can represent an opportunity for community banks. Understanding how FinTech will impact your institution and your response is critical today. Many community banks are actively surveying the FinTech landscape and pursuing a strategy to improve their digital footprint and services through partnerships with FinTech companies. Our new book, Creating Strategic Value Through Financial Technology, can help those banks considering their FinTech strategy as it provides information on the FinTech landscape and provides an overview of a few prominent FinTech niches (payments, wealthtech, insurtech, and banktech), case studies of successful (and unsuccessful FinTech companies), as well as an overview of some key ways to value FinTech companies and assess value creation when structuring FinTech acquisitions, investments, and/or partnerships.
Whatever your strategy, understanding how FinTech fits in and adapting to the current environment is incumbent upon any institution that seeks to compete effectively and Mercer Capital will be glad to assist. We have successfully worked with both traditional financial incumbents (banks, insurance, wealth managers) as well as FinTech companies in a number of strategic planning and valuation projects over the years.
This article originally appeared in Mercer Capital’s Bank Watch, April 2017.
Buy-Sell Agreements for Investment Management Firms
Every closely held business needs a functional buy-sell agreement, but few need it more than investment management firms. Because RIAs are 1) often very valuable, 2) owned by unrelated parties, and 3) tie ownership returns to employee participation, having an effective ownership agreement is essential for the prosperity and sustainability of the firm. This session discussed the key characteristics and valuation implications of an RIA’s buy-sell agreement, with the purpose of keeping the firm’s ownership focused on mutual economic benefit and to avoid expensive disputes over value.
Matthew R. Crow, ASA, CFA, President, and Brooks K. Hamner, CFA, Vice President, presented at the RIA Institute’s 3rd Annual RIA Central Investment Forum on April 4, 2017.
Strategic Benefits of Stress Testing
“Every decade or so, dark clouds will fill the economic skies, and they will briefly rain gold. When downpours of that sort occur, it’s imperative that we rush outdoors carrying washtubs, not teaspoons. And that we will do.”
– Warren Buffett, Berkshire 2017 Annual Shareholder Letter
While the potential regulatory benefits are notable, stress testing should be viewed as more than just a regulatory check-the-box exercise. The process of stress testing can help bankers find silver (or gold in Warren’s case) linings during the next downturn.
What Stress Testing Can Do For Your Bank
As we have noted before, a bank stress test can be seen as analogous to stress tests performed by cardiologists to determine the health of a patient’s heart. Bank stress tests provide a variety of benefits that could serve to ultimately improve the health of the bank and avoid fatal consequences. Strategic benefits of a robust stress test are not confined merely to the results and structure of the test. A robust stress test can help bank management make better decisions in order to enhance performance during downturns. A bank that has a sound understanding of its potential risks in different market environments can improve its decision making, manage risk appropriately, and have a plan of action ready for when economic winds shift from tailwinds to headwinds.
By improving risk management and capital planning through more robust stress testing, management can enhance performance of the bank, improve valuation, and provide better returns to shareholders. For example, a stronger bank may determine that it has sufficient capital to withstand extremely stressed scenarios and thus can have a game plan for taking market share and pursuing acquisitions or buybacks during dips in the economic, valuation, and credit cycle. Alternatively, a weaker bank may determine that considering a sale or capital raise during a peak in the cycle is the optimal path forward. If the weaker bank elects to raise capital, a stress test will help to assess how much capital may be needed to survive and thrive during a severe economic environment. Beyond the strategic benefits, estimating loan losses embedded within a sound stress test can also provide a bank with a head start on the pending shift in loan loss reserve accounting from the current “incurred loss” model to the more forward-looking approach proposed in FASB’s CECL (Current Expected Credit Loss) model.
Top Down Stress Testing
In order to have a better understanding of the stress testing process, consider a hypothetical “top-down” portfolio-level stress test. While not prescriptive in regards to the particular stress testing methods, OCC Supervisory Guidance noted, “For most community banks, a simple, stressed loss-rate analysis based on call report categories may provide an acceptable foundation to determine if additional analysis is necessary.” The basic steps of a top-down stress test include determining the appropriate economic scenarios, segmenting the loan portfolio and estimating losses, estimating the impact of stress on earnings, and estimating the stress on capital.
While the first step of determining a stressed scenario to consider varies depending upon a variety of factors, one way to determine your bank’s stressed economic scenario could be to consider the supervisory scenarios announced by the Federal Reserve in February 2017. While the more global economic conditions detailed in the supervisory scenarios may not be applicable to community banks, certain detail related to domestic variables within the scenarios could be useful when determining the economic scenarios to model at your bank. The domestic variables include six measures of real economic activity and inflation, six measures of interest rates, and four measures of asset prices.
The 2017 severely adverse scenario includes a severe global recession, accompanied by heightened corporate financial stress (real GDP contraction, rising unemployment, and declining asset values). Some have characterized the 2017 “severe” scenario as less severe than the 2016 scenario (given a relatively higher disposable income growth forecast and a lack of negative short-term yields, which were included in the 2016 economic scenarios). However, CRE prices were forecast to decline more in the 2017 scenario, and those banks more focused on CRE or corporate lending may find the 2017 scenarios more negatively impact their capital and earnings forecasts.
For community banks facing more unique risks that are under greater regulatory scrutiny, such as those with significant concentrations in commercial real estate lending or a business model concentrated in particular niche segments, a top-down stress test can serve as a starting point to build their stress testing process. The current environment may be an opportune time for these banks to plan ahead.
While credit concerns in recent quarters have been minimal and provisions and non-performing asset levels have trended lower for the banking sector as a whole, certain loan segments have shown some signs that the credit pendulum may have reached its apex and reversed course by swinging back in the other direction. REITs were net sellers of property in 2016 for the first time since 2009, and a rising rate environment could pressure capitalization rates higher and underlying commercial real estate asset values lower. Furthermore, banks with longer duration fixed rate loans could face a combination of margin pressure and credit quality concerns as rates rise.
Conclusion
Regulatory guidance suggests a wide range of effective stress testing methods depending on the bank’s complexity and portfolio risk–ranging from “top-down” to “bottom-up” stress testing. The guidance also notes that stress testing can be applied at various levels of the organization including transactional level stress testing, portfolio level stress testing, enterprise-wide level stress testing, and reverse stress testing.
We acknowledge that community bank stress testing can be a complex exercise as it requires the bank to essentially perform the role of both doctor and patient. For example, the bank must administer the test, determine and analyze the outputs of its performance, and provide support for key assumptions/results. There is also a variety of potential stress testing methods and economic scenarios for a bank to consider when setting up their test. In addition, the qualitative, written support for the test and its results is often as important as the results themselves. For all of these reasons, it is important that bank management begin building their stress testing expertise sooner rather than later.
In order to assist community bankers with this complex and often time-consuming exercise, we offer several solutions, including preparing custom stress tests or reviewing ones prepared by banks internally, to make the process as efficient and valuable for the bank as possible.
To discuss your stress testing needs in confidence, please do not hesitate to contact us. For more information about stress testing, click here.
This article originally appeared in Mercer Capital’s Bank Watch, March 2017.
2016 and 2017: Buy the Rumor and Sell the News?
Last year was a volatile year for credit and equity markets that saw price moves that more typically play out over a couple of years. The year began with a broad-based sell-off in risk assets that got underway in late 2015 due to concerns about the impact of the then Fed intention to raise short-term rates up to four times, widening credit spreads, and a collapse in oil prices. Credit (i.e., leverage loans and high yield debt) and equities rebounded in March and through the second quarter after market participants concluded that media headlines about potentially sub $20 oil were ridiculous and that the Fed probably would not raise rates four times; or, stated differently—the U.S. economy was not headed for recession. Markets staged the second strong rally of the year immediately following the national elections on November 8th with the surprise election of Donald Trump as the next POTUS, and Republicans holding Congress.
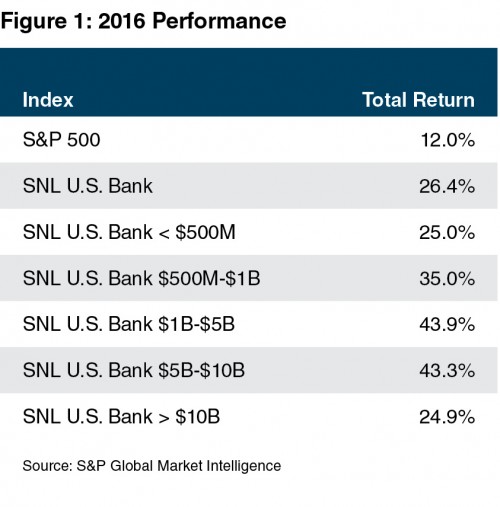
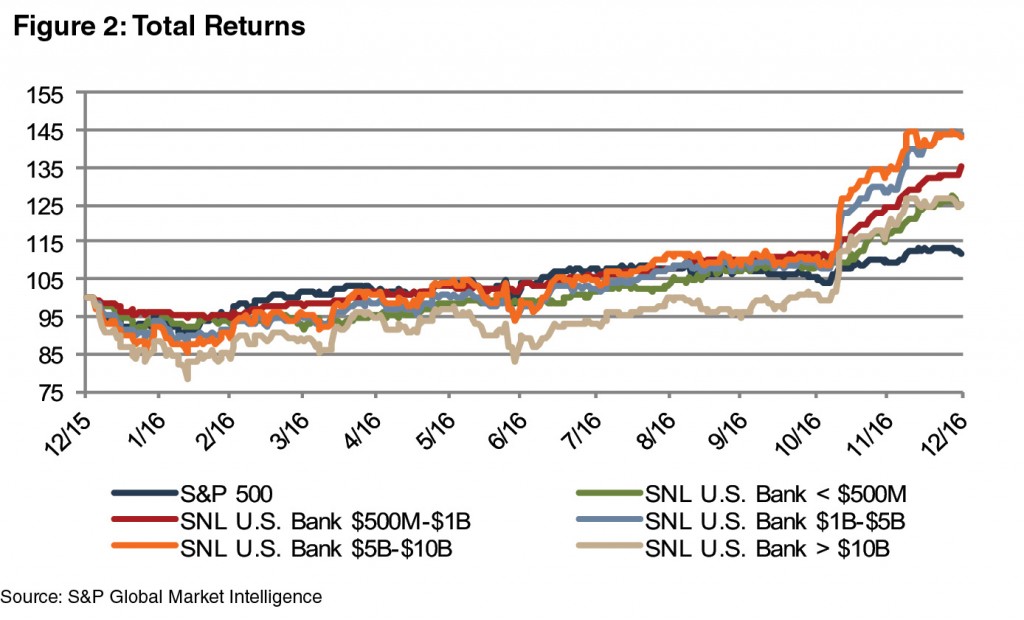
Not surprisingly, the heavily regulated financial sector outperformed the broader market, with bank stocks (as represented by the SNL U.S. Bank Index) gaining 23% versus 5% for the S&P from November 8th through the end of the year. Most of the return for the bank index was realized after the election given the full year total return of 26%. Banks in the $1 to $5 billion and $5 to $10 billion groups led the way in 2016 with total returns on the order of 44% for the year.
The magnitude of the rally in bank stocks was notable because the U.S. economy was not emerging from recession – when bank earnings are near a cyclical trough, poised to turn sharply higher as credit costs fall and loan demand improves.
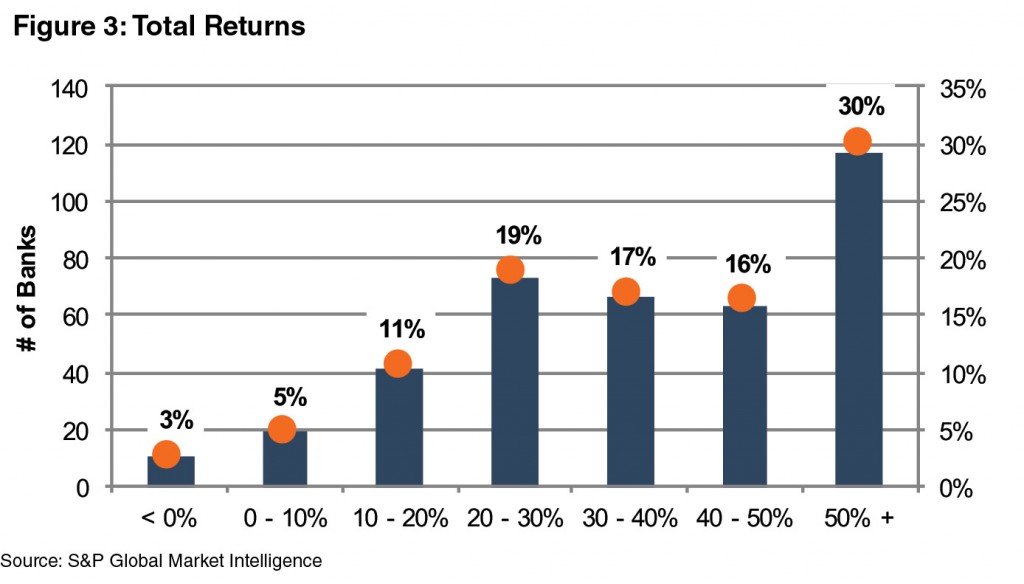
Last year was a great year for most bank stock investors. Bank returns averaged around 40% in 2016, with 30% of the U.S. banks analyzed (traded on the NASDAQ, NYSE, or NYSE Market exchanges for the full year) realizing total returns greater than 50%. The returns reflected three factors: earnings growth, dividends (or share repurchases that were accretive to EPS), and multiple expansion.
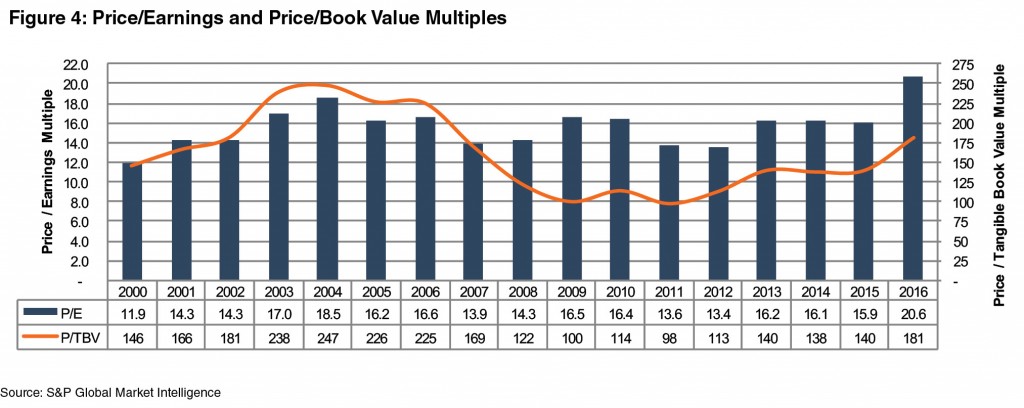
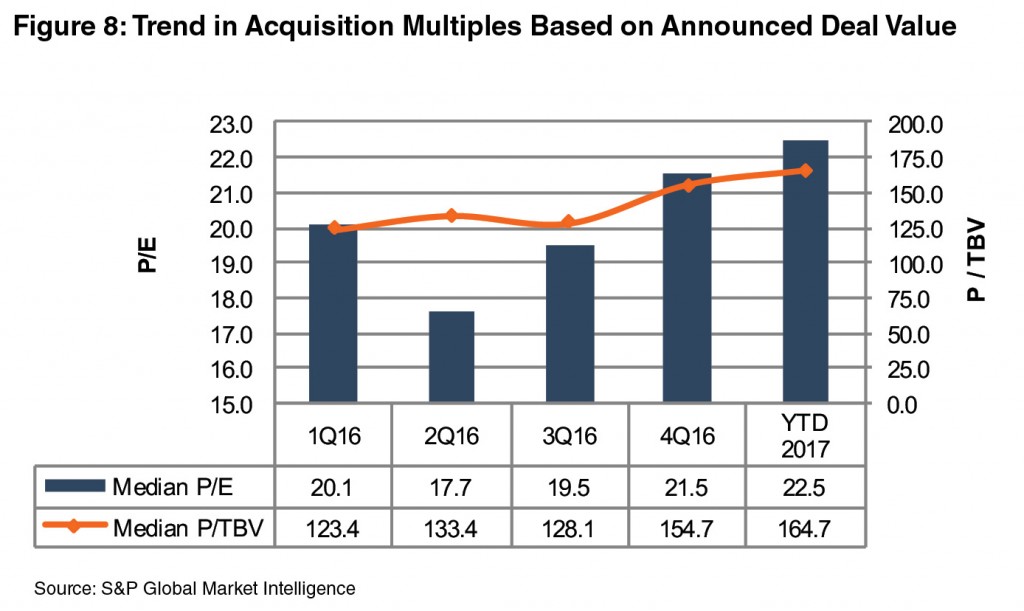
As shown in Figure 4, the median P/E for publicly-traded banks expanded about 30% to 20.6x trailing 12-month earnings at year-end from 15.9x at year-end 2015. Likewise, the median P/TBV multiple expanded to 181% from 140%. While bank stocks closed the year at the highest P/E level seen this century, P/TBV multiples remain below the pre-crisis peak given lower ROEs (ROTCEs), which in turn are attributable to higher capital and lower NIMs.
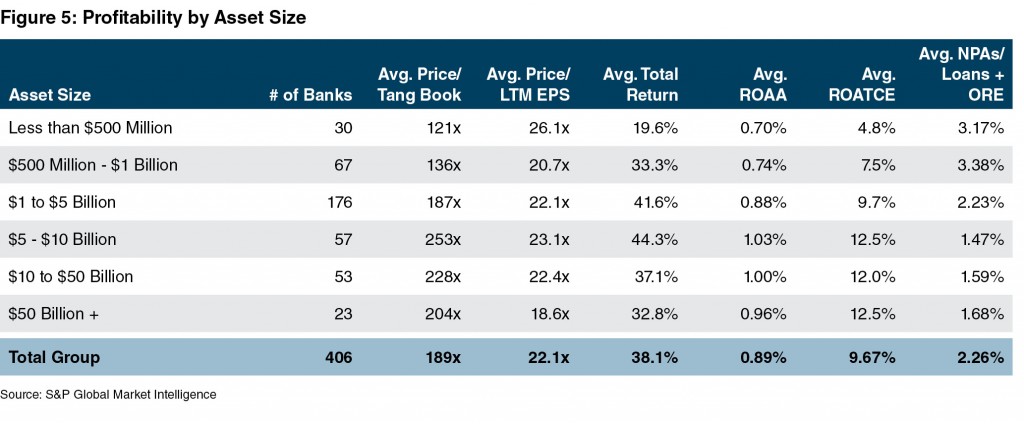
Figure 5 summarizes profitability by asset size. Banks with assets between $5 and $10 billion were the most profitable on an ROA basis and realized the highest total returns for the year. This group stands to benefit the most from regulatory reform if the Dodd-Frank $10 billion threshold (and $50 billion for SIFIs) is raised. In the most optimistic scenario, the market appears to be discounting that banks’ profitability will materially improve with lower tax rates, higher rates, and less regulation. The corollary to this is that the stocks are not as expensive as they appear because forward earnings will be higher provided credit costs remain modest. Based upon our review, most analysts have incorporated lower tax rates into their 2018 estimates, which accounts for much more modest P/Es based upon 2018 consensus estimates compared to 2017 consensus estimates.
2016 M&A Trends
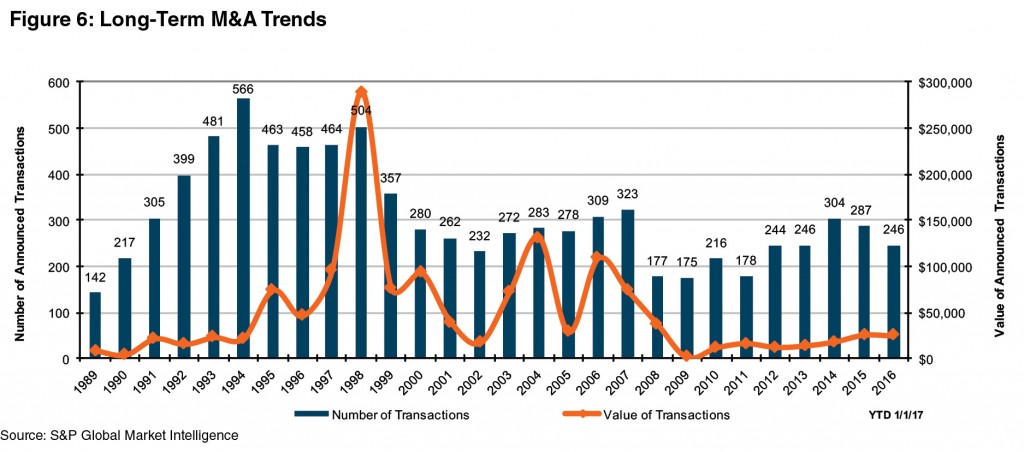
On the surface, 2016 M&A activity eased modestly from 2014 and 2015 levels based upon fewer transactions announced; however, when measured relative to the number of banks and thrifts at the beginning of the year, 2016 was consistent with the long-running trend of 2-4% of institutions being acquired each year. The 246 announced transactions represented 3.8% of the 6,122 chartered institutions at the beginning of the year compared to 4.5% for 2014 and 4.2% for 2015.
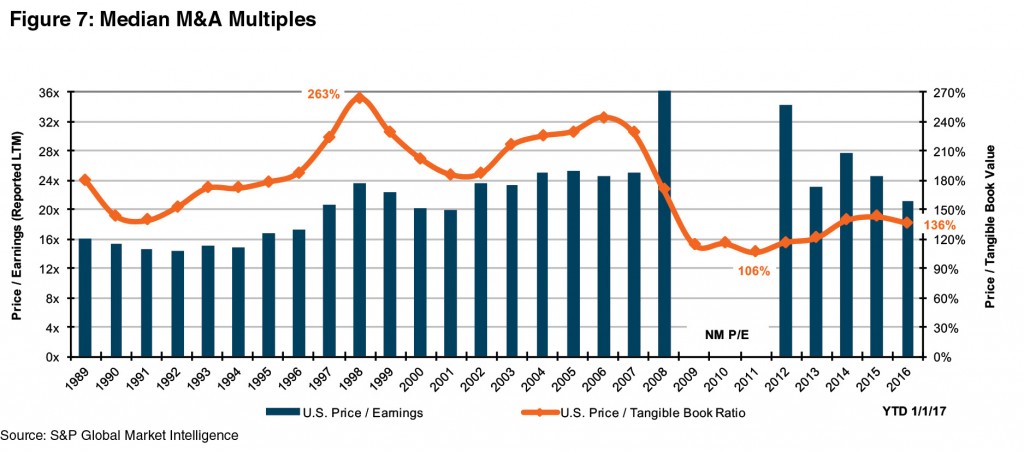
As for pricing, median multiples softened a little bit, but we do not read much into that. Last year, the median P/TBV multiple for transactions in which deal pricing was disclosed eased to 136% compared to 142% in 2015; the median P/E based upon trailing 12 month earnings as reported declined to 21.2x versus 24.4x in 2015.
Elevated public market multiples since the national election have set the stage for higher M&A multiples in 2017 as publicly-traded buyers can “pay” a higher price with elevated share prices (Figure 8). The impact of this was seen among some larger transactions announced after the national election compared to when LOIs were announced earlier in the Fall. Activity may not necessarily pick-up with higher nominal prices, however, if would be sellers decide to wait for higher earnings as a result of anticipated increases in rates and lower taxes and regulations. In effect, some may wait for even better values or decide not to sell because ROEs improve sufficiently to justify remaining independent. Time will tell.
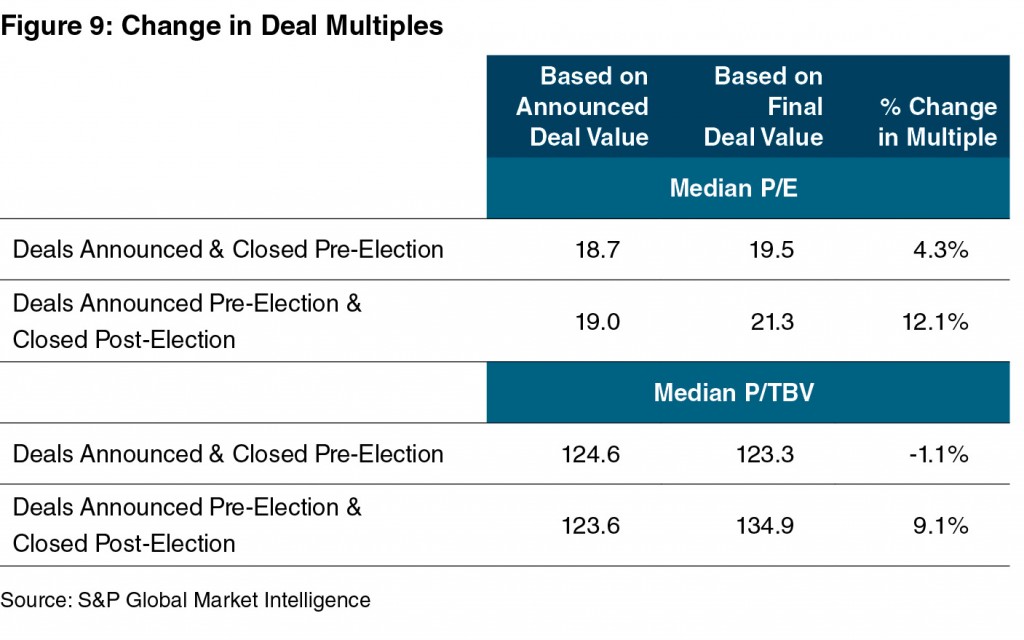
Figure 9 shows the change in deal multiples from announcement to closing and compares the change between deals announced and closed pre-election to those closed post-election. With the run-up in pricing, P/E and P/TBV multiples increased 12% and 9% from announcement to close compared to 4% and a decline of 1% pre-election.
2017 Outlook
No one knows what the future holds, although one can assess probabilities. An old market saw states “buy the rumor; sell the news” which means stocks move before the expected news comes to pass. As of the date of the drafting of this note (February 7), bank stocks are roughly flat in 2017. The stocks have priced in the likelihood of some roll-back in Dodd-Frank, higher short-term and long-term rates, lower tax rates, and a generally more favorable economic backdrop that supports loan growth and asset quality. The magnitude of these likely – but not preordained – outcomes and the timing are unknown. Following a big rally in 2016, returns for bank stocks may be muted in 2017 even if events in Washington and the Fed prove to be favorable for banks.
That said, higher stock prices and investor demand for reasonable yielding sub-debt from quality issuers implies the M&A market for banks should be solid. The one caveat is that there are fewer banks, so a healthy M&A market for banks could still entail fewer transactions than were recorded in 2016.
Mercer Capital is a national business valuation and financial advisory firm. Financial Institutions are the cornerstone of our practice. To discuss a valuation or transaction issue in confidence, feel free to contact us.
This article originally appeared in Mercer Capital’s Bank Watch, February 2017.
How to Create Strategic Value in the Current Environment
Against a backdrop of compressed net interest margins, enhanced competition from non-banks, rising regulatory and compliance costs and evolving consumer preferences regarding the delivery of financial services, many community banks find themselves at a significant inflection point where traditional growth strategies like building or acquiring an expansive, and often expensive, branch network are being reexamined.
In this session, we examined how banks can utilize a hybrid approach and co-opt, partner with or acquire FinTech companies, wealth management and trust operations and insurance brokerages. By pairing traditional banking services with other financial services and means of delivery, banks can obtain more touch points for customer relationships, enhance revenue and ultimately improve the bank’s valuation.
Andrew K. Gibbs, CFA, CPA/ABV, Senior Vice President, and Jay D. Wilson, CFA, ASA, CBA,Vice President, alongside Chris Nichols, Chief Strategy Officer at CenterState Banks, Inc. presented at Bank Director’s 2017 Acquire or Be Acquired Conference on January 30, 2017.
Creating Strategic Value Through Financial Technology
FinTech is not solely a threat to community banks—it’s an opportunity. Through successfully leveraging FinTech, community banks can level the playing field with larger banks and non-bank lenders, as they improve their profitability, performance, customer satisfaction, and value. Creating Strategic Value Through Financial Technology shows you how. The book contains 13 chapters broken into three sections:
- Section I introduces FinTech, examines its history and outlook, and also discusses key reasons that FinTech can have a significant positive impact on community banks in the U.S.
- Section II provides an overview of important trends and FinTech companies in prominent FinTech niches, such as bank technology, alternative (i.e., online) lending, payments (including blockchain technology), wealth management, and insurance. This section is helpful for community bankers interested in understanding more about particular FinTech niches.
- Section III presents a range of topics important to community bankers as they assess potential FinTech niches, partnerships, and acquisitions. Highlights include an examination of how to approach the build, buy, or partner decision when considering a FinTech niche or company; key return metrics to compare FinTech strategies to traditional strategies; and how community banks can value and structure potential partnerships, acquisitions, and investments in FinTech companies.
Creating Strategic Value through Financial Technology illustrates the potential benefits of FinTech to banks, both large and small, so that they can gain a better understanding of FinTech and how it can be leveraged to enhance profitability and create value for shareholders.
Order your copy today via Amazon, Barnes & Noble, Books-A-Million, or Wiley in hardcover or as an ebook.
EBITDA Single-Period Income Capitalization for Business Valuation
[Fall 2016] This article begins with a discussion of EBITDA, or earnings before interest, taxes, depreciation, and amortization. The focus on the EBITDA of private companies is almost ubiquitous among business appraisers, business owners, and other market participants. The article then addresses the relationship between depreciation (and
amortization) and EBIT, or earnings before interest and taxes, as one measure of relative capital intensity. This relationship, which is termed the EBITDA Depreciation Factor, is then used to convert debt-free pretax (i.e., EBIT) multiples into corresponding multiples of EBITDA. The article presents analysis that illustrates why, in valuation terms (i.e., expected risk, growth, and capital intensity), the so-called pervasive rules of thumb suggesting that many companies are worth 4.03to 6.03EBITDA, plus or minus, exhibit such stickiness. The article suggests a technique based on the adjusted capital
asset pricing model whereby business appraisers and market participants can independently develop EBITDA multiples under the income approach to valuation. Finally, the article presents private and public company market evidence regarding the EBITDA Depreciation Factor, which should facilitate further investigation and analysis.
[Reprinted from the American Society of Appraisers Business Valuation Review, Volume 35, Issue 3, Fall 2016]
Download the article in pdf format here.
Are Robo-Advisors on Any Banker’s Wish List?
Christmas appears to have come early for some bankers and their investors with the SNL Bank index up over 30% from the November 8, 2016 election to mid-December. While optimism abounds, one inconvenient truth remains for the time being: ROEs for the banking industry as a whole remain below pre-financial crisis levels despite credit costs that are below most historical standards. The factors challenging ROEs for the sector are numerous but include: compressed net interest margins from a historically low rate environment, enhanced competition from non-banks, a challenging regulatory and compliance environment, and evolving consumer preferences regarding the delivery of financial services.
These factors are particularly acute for most community banks that depend heavily on spread income and do not have the scale to absorb expense pressures as easily as their larger brethren. Further, many community banks are at a crossroad because their ROE consistently has fallen below the cost of capital, which in turn is forcing boards to consider strategic options like outright sales or potentially risky acquisition strategies to obtain scale.
In an ideal world, community banks could easily add fee businesses that are capital-light, such as wealth management and trust operations, to boost returns. By pairing traditional banking services with other financial services like wealth management, banks can obtain more touch points for customer relationships, enhance revenue, and potentially improve the bank’s valuation. While we have previously spoken about the potential benefits to community banks of acquiring or building out a traditional wealth management operation, we have not addressed emerging FinTech companies, like robo-advisors, that are focused on the wealth management space.
While there has been a race to partner and/or acquire robo-advisors by many of the larger asset managers and banks, there have also been some interesting partnerships with community banks. One such partnership struck is among Cambridge Savings Bank, a $3.5 billion bank located near Boston, and SigFig, a robo-advisor founded in 2007. While SigFig has relationships with UBS and Wells Fargo, its partnership with Cambridge Savings is notable because the two built a service called “ConnectInvest.“ When announced in the spring of 2016, the partnership was described as the “first automated investment service integrated and bundled directly into a retail bank’s product offerings in the U.S.” ConnectInvest, which is available to Cambridge’s customers digitally (mobile and website), “allows customers to easily open, fund, and manage an automated investment account tailored to their goals.” Cambridge’s customers are interested in the offering and have started using it. The goal is get up to 10% of its customer base using ConnectInvest.
With this example in mind, the remainder of this article offers an overview of the robo-advisory space for our community bank readers so that they may gain a better understanding of the key players and their service offerings and assess whether their bank could benefit from leveraging opportunities in this area.
An Overview of Robo-Advisors
Robo-advisors were noted by the CFA Institute as the FinTech innovation most likely to have the greatest impact on the financial services industry in the short-term (one year) and medium-term (five years). Robo-advisory has gained traction in the past several years as a niche within the FinTech industry by offering online wealth management tools powered by sophisticated algorithms that can help investors manage their portfolios at very low costs and with minimal need for human contact or advice. Technological advances that make the business model possible, coupled with a loss of consumer trust in the wealth management industry in the wake of the financial crisis, have created a favorable environment for robo-advisory startups to disrupt financial advisories, RIAs, and wealth managers. This growth is forcing traditional incumbents to confront the new entrants by adding the service via acquisition or partnership rather than dismiss it as a passing fad.
Robo-advisors have been successful for a number of reasons, though like many digital products low-cost, convenience, and transparency are common attributes.
- Low Cost. Automated, algorithm-driven decision-making greatly lowers the cost of financial advice and portfolio management.
- Accessible. As a result of the lowered cost of financial advice, advanced investment strategies are more accessible to a wider customer base.
- Personalized Strategies. Sophisticated algorithms and computer systems create personalized investment strategies that are highly tailored to the specific needs of individual investors.
- Transparent. Through online platforms and mobile apps, clients are able to view information about their portfolios and enjoy visibility in regard to the way their money is being managed.
- Convenient. Portfolio information and management becomes available on-demand through online platforms and mobile apps.
Consistent with the rise in consumer demand for robo-advisory, investor interest has grown steadily. While robo-advisory has not drawn the levels of investment seen in other niches (such as online lending platforms), venture capital funding of robo-advisories has skyrocketed from almost non-existent levels ten years ago to hundreds of millions of dollars invested annually the last few years. 2016 saw several notable rounds of investment into not only some of the industry’s largest and most mature players (including rounds of $100 million for Betterment and $75 million for Personal Capital), but also for innovative startups just getting off the ground (such as SigFig and Vestmark).
The table below provides an overview of the fee schedules, assets under management and account opening minimums for several of the larger robo-advisors. The robo-advisors are separated into three tiers. Tier I consists of early robo-advisory firms who have positioned themselves at the top of the industry. Tier II consists of more recent robo-advisory startups that are experiencing rapid growth and are ripe for partnership. Tier III consists of robo-advisory services of traditional players who have decided to build and run their own technology in-house.

As shown, account opening sizes and fee schedules are lower than many traditional wealth management firms. The strategic challenge for a number of the FinTech startups in Tiers I and II is generating enough AUM and scale to produce revenue sufficient to maintain the significantly lower fee schedules. This can be challenging since the cost to acquire a new customer can be significant and each of these startups has required significant venture capital funding to develop. For example, each of these companies has raised over $100 million of venture capital funding since inception.
Key Potential Effects of Robo-Advisory
We see five potential effects of robo-advisors entering the financial services landscape.
- Fee pressure. Robo-advisors may be a niche area for the time being, but the emergence and success of a technology-driven solution that challenges an age-old business (wealth management) epitomizes what has long been associated with internet (and digital) delivery of services: faster, better, and cheaper.
- The Democratization of Wealth Management. As a result of the low costs of robo-advisory services, new investors have been able to gain access to sophisticated investment strategies that, in the past, have only been available to high net worth, accredited investors.
- Holistic Financial Life Management. As more people have access to financial advice through robo-advisors, traditional financial advisors are being forced to move away from return-driven goals for clients and pivot towards offering a more complete picture of a client’s financial well-being as clients save for milestones such as retirement, a child’s education, and a new house. This phenomenon has increased the differentiation pressure on traditional financial advisors and RIAs, as robo-advisors can offer a holistic snapshot in a manner that is comprehensive and easy to understand
- Drivers of the Changing Role of the Traditional Financial Advisor. The potential shift away from return-driven goals could leave the role of the traditional financial advisor in limbo. This raises the question of what traditional wealth managers will look like going forward. One potential answer is traditional financial advisors will tackle more complex issues, such as tax and estate planning, and leave the more programmed decision-making to robo-advisors.
- Build, Buy, Partner, or Wait and See. As the role of the financial advisor changes, traditional incumbents like community banks are faced with determining what they want their relationship with robo-advisory to look like. In short, incumbents are left with four options: build their own robo-advisory in-house, buy a startup and adopt its technology, create a strategic partnership with a startup, or stay in a holding pattern in regard to robo-advisory and continue business as usual.
Robo-advisory is an exciting development for wealth managers and offers opportunities potentially for bankers to expand or develop their offerings in this area. Similar to any other growth strategy, the goal will ultimately be for the bank to enhance profitability and shareholder value by adding desired customer services.
For those bankers who may want to add a robo-advisor to their wish list, the key question of whether to build, buy, or partner is a challenging one. We will be speaking at the annual Acquire or Be Acquired (AOBA) conference in January on the topic of how to develop a framework to better assess this question. Additionally, for those who may go the investment route via a minority investment or outright acquisition, we offer some perspective on how to value and structure investments in FinTech companies like robo-advisors. Given the vast array of FinTech companies emerging in different areas of financial services, it will be important for bankers to develop a framework for both assessing potential opportunities and focusing in on those that provide the greatest potential to enhance profitability and shareholder value. We will post our slide deck from our AOBA session and make it accessible to BankWatch readers in the first quarter of 2017, so stay tuned.
Additionally, we have a new book coming in the spring of 2017 – Creating Strategic Value Through Financial Technology. In this book, we illustrate the potential benefits of FinTech to banks, both large and small, so that they can gain a better understanding of FinTech and how it can create value for their shareholders and enhance the health and profitability of their institutions.
As always, please do not hesitate to contact us if we can help in any way.
This article originally appeared in Mercer Capital’s Bank Watch, January 2017.
Use the Interim Time Between Now and the Future Sale of a Business to Wisely Prepare
Is business ownership a binary thing? Do we either own our businesses or not? The binary notion leads business owners to think either in terms of either the status quo or of an eventual sale of the business.
The truth is that between the two bookends of status quo and an eventual third-party sale are many possibilities for creating shareholder liquidity and diversification and facilitating both ownership and management transitions. We call this time “interim time.” The literal translation of “interim” from the original Latin means, “the time between.” Interim time, then, is the time between now, or the current status quo of a business, and an ultimate sale of that business. Let’s look at the bookends:
- Status Quo. First, let’s talk about the either. The status quo may be an excellent strategy. If sales and earnings are rising, existing owners can benefit from the growth and expected appreciation in value and maintain control of the business. However, the status quo, in many instances, does not provide liquidity and diversification opportunities for owners and places all execution risk on them. A decision to maintain the status quo for your business may not do much to advance necessary ownership and management transitions, as well. A decision to maintain the status quo should be based on conscious decision making and not on procrastination. And the status quo has an insidious side to it – unless you and the other owners do something, you will stay in the status quo for a long, long time; therefore, you have to question the status quo on an ongoing basis.
- Ultimate Third-Party Sale. Now, let’s talk about the or. If your business is continuing in a status quo mode, chances are you are not preparing it for an eventual sale. After all, it will happen someday, but not in the foreseeable future. Chances are also that you and the other owners may not be preparing yourselves for an eventual sale. And if you are maintaining a status quo status, you may not be able to influence the timing of an eventual sale. The ideal time to sell a business is when the markets are hot, when financing is readily available, when your business is tracking upward and has a good outlook, and when the owners are ready. In reality, what you can hope to achieve in a sale of your business is the best pricing available in the market at the time of the sale. If you remain in the status quo, you may not get to choose the timing of the eventual sale.If it seems like we are painting an eventual third party sale as an unfavorable outcome, we are not. It can result in an unfavorable outcome, however, if your business is not ready for sale at the given time and if you and your other owners are not ready, personally, for that eventual sale.
What to Do in the Interim Time
Managing illiquid, private wealth in private businesses is far more than running the businesses themselves. We all have to manage our businesses. Managing the wealth in our businesses requires a much more active role for business owners and often a different level of attention on the business itself.
The status quo and an eventual third-party sale are, indeed, bookends. Consider the table.
If we are managing the wealth in our closely held and family businesses, we will be focused on creating liquidity opportunities over time and on achieving reasonable returns from our companies on a risk-adjusted basis. We will be using our companies as vehicles to generate liquid wealth and diversification opportunities over time.
The table shows the bookends of status quo and third-party sale options. In between are a number of options that owners of successful private companies can use to manage the wealth tied up in them and to create ongoing opportunities for liquidity and diversification.
At the far right, after the sale of a business, its owners must, in many cases, be prepared for the rest of their lives. So it is important to run a business in such a way that its owners develop liquidity and diversification to create options for the rest of their lives.
The table is certainly not all inclusive, but it does include some easily implementable options like establishing a dividend/distribution policy or making occasional share repurchases as owners need some liquidity or, for example, when an owner leaves the company. This purchase might be pursuant to the terms of a buy-sell agreement.
If your company has significant excess assets, it is probably a good idea to clean up your balance sheet and declare a special dividend. And it may be appropriate to have one or more key managers acquire small stakes in the company to facilitate alignment and future management transitions.
I call these options “easily implementable,” but they won’t happen unless someone does something.
The next category of options in the table above are termed “significant and realistic minority options.” They include relatively small leveraged dividend recapitalizations or share repurchases. The options also might include the creation of a 30% or less ESOP in appropriate circumstances. These transactions certainly won’t happen without someone doing something. They will likely require the assistance of outside expertise, and there will be certain transaction costs. Transaction costs should be considered in the context of investments.
The third category after the status quo is called “control level options.” For some successful private companies, it may be appropriate to engage in substantial transactions to create liquidity opportunities and to retain ownership in expected future growth and appreciation. Options here include:
- Leveraged share repurchases
- Leveraged dividend recapitalizations
- Employee Stock Ownership Plans
The final category is the bookend of third-party sale transactions. It should now be clear that there are options other than selling a business today, or simply maintaining the status quo, for managing the illiquid wealth in your private company.
Benefits of Focusing on Interim Time
The shareholder benefits of employing one or more of the above strategies over time include the following:
- Acceleration of cash returns, liquidity opportunities, and opportunities for diversification and creating liquidity independent of your company
- Ability for your owners to diversify their portfolios
- Optimization of your company’s capital structure with reasonable leverage
- Enhanced return on equity with reasonable leverage
- Enhanced earnings per share for some options
- Planned changes in ownership structure with shareholder redemptions, with remaining owners achieving pickups in their relative ownership of the company
- Enhanced performance and reduced business risk with focus on the business
Employing one or more of the above The One Percent Solution strategies is tantamount to using modern investment theory concepts and basic corporate finance tools in the management of illiquid private company wealth.
For more information or to discuss a valuation and transaction issue in confidence, please do not hesitate to contact us.
Core Deposit Intangible Asset Values Remain Low
We ran an updated article in the October 2017 issue of Mercer Capital’s Bank Watch newsletter.
Other than goodwill, core deposit intangible assets are the most commonly recorded intangible assets in bank acquisitions, representing the benefit of having a low-cost, stable funding source. However, CDI values have decreased since the financial crisis, as deposits have less worth, so to speak, in a very low rate environment than in a “normal” environment that existed before the crisis. Using data compiled by S&P Global Market Intelligence, we analyzed trends in CDI assets recorded in whole bank acquisitions completed from 2008 through November 1, 2016. We compared CDIs recorded as a percentage of core deposits acquired to 5-year FHLB rates over the same period.
Since the start of the financial crisis, CDIs recorded in acquisitions have fallen from 1.5%-2.0% to stabilizing at approximately 1.0%-1.25% in the 2014-2016 period. As interest rates declined in the years following the crisis, the cheaper cost of alternative funds has made banks’ core deposit bases less valuable as a stable, cheap source of funding. Low rates also led to less attractive alternative investments for consumers, which has resulted in rising deposit balances and less competition for funds. In short, low rates have made funds easier and cheaper to access, reducing the value of core deposit intangible assets.
Despite the FOMC’s decision to begin a gradual increase in interest rates in late 2015, the cost of alternative funds such as FHLBs has not increased meaningfully since then. While the narrative around the economy and rates has shifted since the November 8th presidential election, it is unclear whether rates will increase more than the gradual pace the Fed has targeted since late 2015.
When interest rates were higher pre-crisis, both CDI levels and deposit premiums paid in acquisitions were higher than the levels observed in today’s environment. If rates do move meaningfully higher over the next few years, then deposit premiums should too (as would net interest margins).
Since the start of the financial crisis, improved deal values have resulted in some increase in deposit premiums paid in the past several years. However, the declining trend in CDI values has persisted even as deposit premiums have begun to tick back up.
For our analysis of industry trends in CDI values, we defined core deposits as total deposits, less accounts with balances over $100,000. In analyzing core deposit intangible assets for individual acquisitions, however, a more detailed analysis of the deposit base would consider the relative stability of various account types. In general, CDs tend to be more rate sensitive and less stable. Even in cases where a CD base is considered a stable customer base, given their relatively higher cost compared to non-time deposits, CDs often do not contribute to the core deposit intangible asset recorded. Furthermore, account types such as brokered or Qwickrate accounts and certain public funds that may be subject to a competitive bidding process are generally excluded from core deposits when determining the value of a CDI.
For more information about Mercer Capital’s core deposit services, feel free to contact us.
Valuation Implications of the Proposed Changes to Section 2704
In these handouts from a webinar presented September 26, 2016, Chris Mercer examined the proposed changes to regulations under IRS Code Section 2704 from a business valuation perspective.
The express goal of the Proposed Changes is to eliminate, or virtually so, valuation discounts in family partnerships (and operating companies, as well). The instruments of change are a loosened definition of control (to broaden the number of families having control), almost total family attribution of control for every transfer, and a hypothetical put right to the partners in family partnership to facilitate the elimination or reduction of valuation discounts in fair market value determinations.
A review from business and valuation perspectives finds that the Proposed Changes, if adopted as published, will affect, but not eliminate valuation discounts.
The webinar covered the following:
- The concept of control
- “Applicable restrictions”
- “Disregarded restrictions”
- The put right
- Fair market value?
- Hypothetical appraisals
- An example from the Proposed Changes
To view the recording of this webinar, click here.
For more information about the Proposed Changes, see our whitepaper on the topic.
Valuation Implications of the Proposed Changes to Section 2704 Webinar
In this webinar presented September 26, 2016, Chris Mercer examined the proposed changes to regulations under IRS Code Section 2704 from a business valuation perspective.
The express goal of the Proposed Changes is to eliminate, or virtually so, valuation discounts in family partnerships (and operating companies, as well). The instruments of change are a loosened definition of control (to broaden the number of families having control), almost total family attribution of control for every transfer, and a hypothetical put right to the partners in family partnership to facilitate the elimination or reduction of valuation discounts in fair market value determinations.
A review from business and valuation perspectives finds that the Proposed Changes, if adopted as published, will affect, but not eliminate valuation discounts.
The webinar covered the following:
- The concept of control
- “Applicable restrictions”
- “Disregarded restrictions”
- The put right
- Fair market value?
- Hypothetical appraisals
- An example from the Proposed Changes
For more information about the Proposed Changes, see our whitepaper on the topic.
Session Archive
5 Trends to Watch in the Medical Device Industry in 2016
Medical Device Overview
The medical device manufacturing industry produces equipment designed to diagnose and treat patients within global healthcare systems. Medical devices range from simple tongue depressors and bandages, to complex programmable pacemakers and sophisticated imaging systems. Major product categories include surgical implants and instruments, medical supplies, electro-medical equipment, in-vitro diagnostic equipment and reagents, irradiation apparatuses, and dental goods.
The following outlines five structural factors and trends that influence demand and supply of medical devices and related procedures.
1. Demographics
The aging population, driven by declining fertility rates and increasing life expectancy, represents a major demand driver for medical devices. The U.S. elderly population (persons 65 and above) totaled 48 million in 2015 (15% of the population). The U.S. Census Bureau estimates that the elderly will roughly double by 2060 to 98 million, representing 24% of the total U.S. population.
The elderly account for nearly one third of total healthcare consumption. Personal healthcare spending for the 65 and above population segment was $19,000 per person in 2012, five times the spending per child ($3,600) and almost triple the spending per working-age person ($6,600).
According to United Nations projections, the global elderly population will rise from 608 million (8.3% of world population) in 2015 to 1.8 billion (18.1% of world population) in 2060. Europe’s elderly are projected to reach 28% of the population by 2060, making it the world’s oldest region. While Latin America and Asia are currently relatively young, these regions are expected to experience drastic transformations over the next several decades, with the over 65 population segments expected to expand from 8% in 2015 to more than 23% of the total population by 2060.
2. Healthcare Spending and the Legislative Landscape in the U.S.
Demographic shifts underlie the expected growth in total U.S. healthcare expenditure from $3.2 trillion in 2015 to $5.6 trillion in 2025. Healthcare spending as a percentage of GDP is also expected to expand from 17% in 2015 to over 20% by 2025.
Since inception, Medicare has accounted for an increasing proportion of total U.S. healthcare expenditures. Medicare currently provides healthcare benefits for an estimated 57 million elderly and disabled Americans, constituting approximately 15% of the federal budget in 2015. Medicare represents the largest portion of total healthcare costs, constituting 20% of total health spending in 2014. Medicare also accounts for 26% of hospital spending, 29% of retail prescription drugs sales, and 23% of physician services.
Owing to the growing influence of Medicare in aggregate healthcare consumption, legislative developments can have a potentially outsized effect on the demand and pricing for medical products and services. Net outlays to the four parts of Medicare totaled $540 billion in 2015, and spending is expected to reach $709 billion by 2020. Between 2000 and 2010, growth in Medicare spending per capita was comparable or lower than private health insurance spending.
The Patient Protection and Affordable Care Act (“ACA”) of 2010 incorporated changes that are expected to constrain annual growth in Medicare spending over the next several decades by curtailing increases in Medicare payments to healthcare providers, and establishing several new policies and programs designed to reduce costs. On a per person basis, Medicare spending is projected to grow at 4.3% annually from 2015 and 2025, compared to 5.7% average annualized growth realized from 2000 to 2014.
As part of ACA legislation, a 2.3% excise tax was imposed on certain medical devices for sales by manufacturers, producers, or importers. The 2.3% levy was expected to net nearly $30 billion over a decade into the early 2020s. The tax became effective on December 31, 2012, but met resistance from industry participants and policy makers. In July of 2015, the U.S. House of Representatives voted to repeal the medical device tax. In late 2015, Congress passed legislation promulgating a two-year moratorium on the tax beginning January 2016.
3. Third-Party Coverage and Reimbursement
The primary customers of medical device companies are physicians (and/or product approval committees at their hospitals), who select the appropriate equipment for consumers (the patients). In most developed economies, the consumers themselves are one (or more) step removed from interactions with manufacturers, and therefore pricing of medical devices. Device manufacturers typically receive payments from insurers, who usually reimburse healthcare providers for routine procedures (rather than for specific components like the devices used). Accordingly, medical device purchasing decisions tend to be largely disconnected from price.
Third-party payors (both private and government programs) are keen to reevaluate their payment policies to constrain rising healthcare costs. Several elements of the ACA are expected to limit reimbursement growth for hospitals, which form the largest market for medical devices. Lower reimbursement growth will likely persuade hospitals to scrutinize medical purchases by adopting i) higher standards to evaluate the benefits of new procedures and devices, and ii) a more disciplined price bargaining stance.
The transition of the healthcare delivery paradigm from fee-for-service (FFS) to value models is expected to lead to fewer hospital admissions and procedures, given the focus on cost-cutting and efficiency. In 2015, the Department of Health and Human Services (HHS) announced goals to have 85% and 90% of all Medicare payments tied to quality or value by 2016 and 2018, respectively, and 30% and 50% of total Medicare payments tied to alternative payment models by the end of 2016 and 2018, respectively. In March 2016, the HHS estimated 30% of Medicare payments were tied to alternative, value-based models, nearly one year ahead of schedule. Ultimately, lower reimbursement rates and reduced procedure volume will likely limit pricing gains for medical devices and equipment.
The medical device industry faces similar reimbursement issues globally. A number of countries have instituted price ceilings on certain medical procedures, which could deflate the reimbursement rates of third-party payors, forcing down industry product prices. Whether third-party payors consider certain devices medically reasonable or necessary for operations presents a hurdle that device makers and manufacturers must overcome in bringing their devices to market.
4. Competitive Factors and Regulatory Regime
Historically, much of the growth for medical technology companies has been predicated on continual product innovations that make devices easier for doctors to use and improve health outcomes for the patients. Successful product development usually requires significant R&D outlays and a measure of luck. However, viable new devices can elevate average selling prices, market penetration, and market share.
Government regulations curb competition in two ways to foster an environment where firms may realize an acceptable level of returns on their R&D investments. First, firms that are first to the market with a new product can benefit from patents and intellectual property protection giving them a competitive advantage for a finite period. Second, regulations govern medical device design and development, preclinical and clinical testing, premarket clearance or approval, registration and listing, manufacturing, labeling, storage, advertising and promotions, sales and distribution, export and import, and post market surveillance.
Regulatory Overview in the U.S.
In the U.S., the FDA generally oversees the implementation of the second set of regulations. Some relatively simple devices deemed to pose low risk are exempt from the FDA’s clearance requirement and can be marketed in the U.S. without prior authorization. For the remaining devices, commercial distribution requires marketing authorization from the FDA, which comes in primarily two flavors.
- The premarket notification (“510(k) clearance”) process requires the manufacturer to demonstrate that a device is “substantially equivalent” to an existing device that is legally marketed in the U.S. The 510(k) clearance process may occasionally require clinical data, and generally takes between 90 days and one year for completion.
- The premarket approval (“PMA”) process is more stringent, time-consuming and expensive. A PMA application must be supported by valid scientific evidence, which typically entails collection of extensive technical, preclinical, clinical and manufacturing data. Once the PMA is submitted and found to be complete, the FDA begins an in-depth re- view, which is required by statute to take no longer than 180 days. However, the process typically takes significantly longer, and may require several years to complete.
Pursuant to the Medical Device User Fee Modernization Act (MDUFA), the FDA collects user fees for the review of devices for marketing clearance or approval, as well as establishment registration. The current iteration of the act, MDUFA III, was enacted in 2012 and expected to collect approximately $400 million in user fees over five years. The FDA and the medical device industry have reached a broad agreement on the outlines of the next iteration. The FDA is expected to collect nearly $1 billion in user fees over five years pursuant to MDUFA IV, which would go into effect in in October 2017.
Regulatory Overview Outside the U.S.
The European Union (EU), along with countries such as Japan, Canada, and Australia all operate strict regulatory regimes similar to that of the U.S. FDA, and international consensus is moving towards more stringent regulations. Stricter regulations for new devices may slow release dates and may negatively affect companies within the industry.
Medical device manufacturers face a single regulatory body across the EU, the Company’s second largest end market behind the U.S. In order for a medical device to be allowed on the market, it must meet the requirements set by the EU Medical Devices Directive. Devices must receive a Conformité Européenne (CE) Mark certificate before they are allowed to be sold on the market. This CE marking verifies that a device meets all regulatory requirements for the EU, and that they meet EU safety standards. A set of different directives apply to different types of devices, and the device must be compliant with the directive that purviews it.
5. Emerging Global Markets
Emerging economies are claiming a growing share of global healthcare consumption, including medical devices and related procedures, owing to relative economic prosperity, growing medical awareness, and increasing (and increasingly aging) populations. As global health expenditure continues to increase, sales to countries outside the U.S. represent a potential avenue for growth for domestic medical device companies. According to the World Bank, all regions (except Sub-Saharan Africa) have seen an increase in healthcare spending as a percentage of total output over the last two decades.
Global medical devices sales are estimated to increase 6.4% annually from 2016 to 2020, reaching nearly $440 billion according to the International Trade Administration. While the Americas are projected to remain the world’s largest medical device market, the Asia and Pacific and Western Europe markets are expected to expand at a quicker pace over the next several years.
Summary
Demographic shifts underlie the long-term market opportunity for medical device manufacturers. While efforts to control costs on the part of the government insurer in the U.S. may limit future pricing growth for incumbent products, a growing global market provides domestic device manufacturers with an opportunity to broaden and diversify their geographic revenue base. Developing new products and procedures is risky and usually more resource intensive compared to some other growth sectors of the economy. However, barriers to entry in the form of existing regulations provide a measure of relief from competition, especially for newly developed products.
An Overview of the Medical Device Industry
This presentation presents a broad outline of the medical device industry, which is characterized by:
- Continual technological advancement.
- High profitability.
- Sustained growth.
Typically, a device begins life as discovery of a new material or novel technology that addresses a gap in treatment or facilitates a better approach to patient care. Successful development of a device occurs along three dimensions, i) efforts to demonstrate the product causes no harm and improves patients outcomes culminate in regulatory approval or clearance, ii) insurers accept value by acceding to reimburse product and related procedures, and iii) purchasers and consumers adopt at a sufficient enough commercial scale. The tri-fold development requirements represent a significant barrier to new entrants. As with other technologies, however, devices tend to have finite life-spans as patents expire, and newer products further improve upon incumbent solutions.
Pricing tends to be divorced from the purchasing decisions as buyers’ (physicians’) decisions do not depend (primarily) on price, consumers (patients) largely purchase insurance coverage and do not directly pay for the device, are payers (insurers) are a step removed from the prescription and delivery of care services.
As with many other healthcare sub-segments, demographic shifts and global economic trends underlie sustained growth expected in the market for medical devices.
Characteristics of a Good Buy-Sell Agreement
The creation of buy-sell agreements involves a certain amount of future-thinking. The parties must think about what could, might, or will happen and write an agreement that will work for all sides in the event an agreement is triggered at some unknown time in the future. This article addresses the important characteristics of buy-sell agreements that are important for business owners and for attorneys advising them.
What Do Buy-Sell Agreements Do?
Buy-sell agreements are entered into between corporations and their shareholders to protect companies against disruptive, harmful, or nonproductive owners (including divorced spouses, competitors, disgruntled former employees and the like). They also provide protections for shareholders who may, for any number of reasons, depart the company. The estates of deceased owners need protection, as do shareholders who have been terminated, with or without cause.
It is important that buy-sell agreements be entered into while the interests of the parties (the corporation and the shareholders) are aligned, or at least not sufficiently misaligned, that they cannot discuss the business and valuation aspects of their buy-sell agreements. To the extent possible, attorneys should encourage parties to enter into buy-sell agreements or to review their agreements and update them if they are out of date or circumstances have changed.
What is known for certain is that once a trigger event has occurred, the interests of the parties (i.e., the buyer(s) and the seller(s)) diverge and agreement over the pricing and terms of necessary transactions can become difficult or impossible to achieve.
Characteristics of a Good Buy-Sell Agreement
From valuation and other business perspectives, buy-sell agreements generally incorporate several important aspects defining their operation. The list of characteristics of successful buy-sell agreements below is taken from my book, Buy-Sell Agreements for Closely Held and Family Business Owners.
Require agreement at a point in time (before trigger events or other dissension) among shareholders of a company and/or between shareholders and the company.
It may seem obvious, but if there is no agreement between the shareholders and the company, then there is no buy-sell agreement. Such agreements must be evidenced by a writing of the agreement and by the signatures of all parties who will be subject to the agreement. Agreement is not always easy to obtain. Shareholders have different backgrounds, financial positions, personal outlooks, and involvement with a business, so agreement is not automatic. However, it is important that attorneys continue to work with clients to encourage agreement and that business owners remain committed to reaching agreement and signing their buy-sell agreements.
The point in time at which agreement is reached is the date of the signing of each particular buy-sell agreement.
Relate to transactions that may or will occur at future points in time between the shareholders, or between the shareholders and the corporation.
When the shareholders of a new venture come together to discuss a buy-sell agreement, it is foreseeable that many things can happen that will trigger the operation of a buy-sell agreement. Owners may quit, one may be fired, another may retire, one could die, still another could become divorced, and another could become bankrupt — to name a few.
The owners can discuss these future potential trigger events and which ones they want to include specifically in their buy-sell agreements. It is important that all owners think seriously about these issues because, at the time a buy-sell agreement is being drafted, no one knows what might happen to him or to her or to any of the other owners. In other words, no one knows who will be a buyer and who will be a seller.
When the owners of an existing enterprise come together to review their buy-sell agreement, they may know that some of the above-mentioned events have already happened in the lives of their fellow owners. They will know if the buy-sell agreement operated satisfactorily, or was triggered at all.
For all owners of all enterprises, discussions about buy-sell agreements reflect a form of future thinking, which is sometimes (perhaps always) difficult. As Yogi Berra famously said: “The future’s hard to predict. It hasn’t happened yet.”
Choices have to be made regarding buy-sell agreements. Ignoring the importance of these documents because it is difficult to future think about them is one choice. Based on over thirty years of working with businesses and business owners, ignoring the issue is not a good choice.
Define the conditions that will cause the buy-sell provisions to be triggered. Most often, business owners think of death as the most likely trigger event for buy-sell agreements. It is actually the least frequent trigger event for most companies.
Trigger events have to be defined specifically. Death is fairly obvious. However, firings can be with or without cause, and agreements may need to specify what happens in each circumstance. The parties to an agreement must future think a bit to anticipate what could happen and document the agreement appropriately. If this sounds like work, it is.
Determine the price at which the identified future transactions will occur (as in price per share, per unit, or per member interest). Because of the diverging interests of parties following trigger events, this is one of the hardest parts of establishing effective buy-sell agreements. This is why many appraisers and other advisers to closely held businesses recommend appraisal with a pre-determined appraiser as a generally preferable pricing mechanism for substantial business enterprises.
There are buy-sell agreements with fixed prices. Unfortunately, these agreements are seldom updated and are ticking time bombs. For a poster child example of what can happen with fixed price agreements, read here.
Other buy-sell agreements contain formula pricing provisions. Unfortunately, we haven’t seen a formula yet that can reasonably value any company over time with changing conditions at the company, within its industry and markets, in the local, regional or national economies, and in all market conditions and interest rate environments.
Then, there are what we call valuation process agreements, which provide for a valuation process to determine the price. Many agreements have an embedded multiple appraiser process which will not be exercised until the occurrence of a trigger event. These agreements, too, are fraught with potential pitfalls.
We assert that the best pricing mechanism for most buy-sell agreements of successful closely held and family businesses is a single appraiser process where the appraiser is selected by the parties at the outset and provides an appraisal to determine an agreement’s initial pricing. The appraiser is then asked to provide reappraisals each year (or every other year at most) to reset the price for the buy-sell agreement.
Determine the terms under which the price will be paid.
Many buy-sell agreements call for the price determined under their terms to be paid by the issuance of a promissory note by the company. Quite often, the price determined by appraisal will be the fair market value of the interest. However, many notes defined in buy-sell agreements are not worth par, or their face amounts, so recipients end up getting less than fair market value for their interests.
A promissory note might be worth less than par if it has a below market interest rate for notes of comparable risk. Often, there is no security for promissory notes issued in connection with buy-sell agreements, and no protection against future financings that are subordinated, leaving the promissory note less protected.
Provide for funding so the contemplated transactions can occur on terms and conditions satisfactory to selling owners and the corporation (or other purchasing owners). This element is important and often overlooked.
Life insurance is often considered as a funding mechanism for buy-sell agreements. One big problem is that the only time that life insurance is received is when an insured owner dies. However, death is the least likely trigger event for most companies. Firings, retirings, divorcings, disabilities, and other things happen with far greater frequency.
Funding may come from a promissory note as discussed above. It can also come from outside financing if the company is able to obtain such financing. Sinking funds have their own issues, because a selling shareholder was present while any sinking fund was accumulated, and would likely desire to share in its value.
Satisfy the business requirements of the parties. While buy-sell agreements have much in common, each business situation is different, and unique parties are involved. In the end, legal counsel must draft buy-sell agreements to address the business issues that are important to the parties. Clearly, establishing and agreeing on the key business issues and having them reflected in the agreement can be difficult. If the owners do not reach agreement on key business issues, no attorney can draft a reasonable document for the parties.
All of the potential trigger events discussed above are business issues (and personal issues) for business owners. Other business issues could include the maintenance of relative ownership between groups of shareholders, the admission of additional shareholders, and other issues that may or not relate directly to potential future trigger events. Some family businesses add clauses in the event of a shareholder’s divorce to preclude the shares from being granted to a divorcing spouse who is not of direct lineal descent of the family.
Provide support for estate tax planning for the shareholders, whether in family companies or in non-family situations.
One client of many years has a buy-sell agreement and the family has engaged in significant gift and estate tax planning. Several years ago, the gift tax returns of the owners of a client company were audited. Agreement could not be reached with the Internal Revenue Service, and the matter proceeded on a path towards Tax Court. One of the key issues in dispute was whether the buy-sell agreement met the requirements of IRS Code Section 2703 (b). After much discussion and preparation for trial, agreement was reached that the buy-sell agreement withstood the exceptions (subparagraph (b)) to the general rule of Code Section 2703:
(b) Exceptions
Subsection (a) shall not apply to any option, agreement, right, or restriction which meets each of the following requirements:
(1) It is a bona fide business arrangement.
(2) It is not a device to transfer such property to members of the decedent’s family for less than full and adequate consideration in money or money’s worth.
(3) Its terms are comparable to similar arrangements entered into by persons in an arms’ length transaction.
As part of the preparations for trial, I was asked to render a supplemental report on behalf of Mercer Capital to assist the court in analyzing the relevant shareholder agreements from business and valuation perspectives. Fortunately, the case settled on the eve of trial with agreement that the relevant agreement satisfied the requirements, and with settlement at the conclusions of fair market value issued by Mercer Capital for the relevant years. The issues raised by the relationship of buy-sell agreements and estate planning are important.
Satisfy legal requirements relating to the operation of the agreements. Buy-sell agreements must be drafted such that they are legally binding on the parties to them. In addition, agreements must be drafted to comply with laws and/or regulations that may be applicable to their operation. Business owners must rely on legal counsel regarding such matters.
Business owners must agree on the business and valuation issues relevant to their buy-sell agreements. However, those agreements must be memorialized by competent legal counsel, who should be involved in the discussions to begin with, together with estate planning counsel, other financial advisers and a qualified business appraiser.
Conclusion
Buy-sell agreements are business and legal documents that are created in the context of business, valuation and legal requirements. We need to engage in future thinking in order that our agreements will withstand not only the tests of time, but also potential challenges from the Internal Revenue Service.
An Investor’s View of Major League Sports Franchises: Outsized Returns or a Risky Play?
This following article was originally published by The Texas Lawbook.
It has been often discussed, particularly in recent years, that the value of privately held professional sports franchises is a newsworthy item. Analysts, investors, and fans alike have an interest in observing team owners buy and sell teams and watch the prices at which they trade. However, are team owners doing as well as some may portray? How about their investments as compared to their investing peers in the stock markets.
We attempt to answer these questions based on some known data sources and return analytics over time. The answers are interesting but not entirely clear.
There are two components to an investor’s rate of return: (i) interim returns in the form of cash flows or dividends, and (ii) price appreciation. Many commentators and writers have noted that some major league sports franchises have incurred operating losses in past years. For example, at one point it appeared that the MLB franchises on average had operating losses as players’ salaries increased faster than revenues. This was a big factor underlying the NFL and NHL lockouts in 2011 and 2012. There is a silver lining, however, and that appears to be the price appreciation realized from the increased values of these major league franchises.
We traced over time the estimated appreciation (by league) of the values of sports teams, according to Forbes magazine. We also tracked the returns over the same time frames of several familiar equity market indices. The table below summarizes our findings.
We tracked this data going all the way back to 1991. We then sorted the returns over different decades – the 1990s, the 2000s, and our current decade. We aggregated it for the 25 total years of data.1
We observe that equity markets outperformed league appreciation in the 1990s, but the leagues caught up in the 2000s and 2010s. The biggest reason for the significant increase in the 2000s and the 2010s (among others) is television contracts – specifically, increases in national TV contracts for the NFL and NBA and regional and local contracts for MLB and NHL (and to a lesser degree the NBA as well).
Consider a few examples:
- The NFL had its national TV contract increase dramatically in the last several renewals, most significantly, the most recent one. The 2014 season was the first year of the NFL’s nine-year deal with Fox, CBS, and NBC. The networks will pay about $3.1 billion in rights fees every season or 63% more than the previous TV deal.
- The NBA, which signed a nine-year deal with ESPN and Turner Broadcasting and other networks, had total fees worth $24 billion in 2014. This skyrocketed to $3.6 billion a year, up from about $930 million in the contracts reached in 2007. In addition, NBA teams have benefited from increased local TV rights that have usually doubled or even tripled in annual rights fees in the last 5 years.
- For MLB and NHL teams, the majority of the TV revenue comes from local TV contracts. These contracts have also appreciated substantially in the last five years increasing 3 to 5 times in comparison to the contracts signed 5 to 7 years ago.
This increased TV revenue has been the primary driver of the very strong price appreciation in the 2000s and particularly in last five years (2011-2016).
In the last five years (2011-2016), the MLB team values have increased on average 19.8% compounded according to Forbes. The NBA Forbes value estimates increased by 27.6% for the same period. The NFL increased 17.4% and the NHL 21.3%. This short 5-year period has seen the highest percentage increase in the last 25 years. The compounded increases are 10% to 13% for the four major sports leagues over a 25-year period (1991-2016). In comparison, the DOW increased 7.4% compounded, the NASDQ 10.1% the S&P 500 7.0% and the Russell 2000 8.2%.
Therefore, solely from an appreciation point of view, an investment in a major league sports franchise appears to have been a very good return in the last 25 years, especially in the last five years. Of course, these returns vary by team and nothing is guaranteed. It is also notable that some teams have incurred operating losses that will offset a significant amount of the total return. This can impact investments in the form of debt or even capital calls from investors. This gets even more complicated when considering the value of minority interests in teams whereby the ability to monetize their returns is more uncertain. In fact, minority interests typically trade (however infrequently) at lower value levels than what the pro-rata value of a franchise would otherwise be worth. Therefore, appreciation returns that appear positive can come with drawbacks as well. Critical analysis is important to investors to help them determine if their returns are worth the risks.
Mercer Capital has arguably the most expertise in sports valuation and related stadium advisory in the country. For more information, contact one of our professionals.
End Note
1 We would note that Forbes does not have access to many team financials as teams are closely held (with the notable exception of the Green Bay Packers).Forbes relies on limited data and educated estimates of actual revenues and profits in order to make their estimated values.This is a limiting factor to properly value a single franchise at a single point in time.That said, as part of Forbes’ analysis they have interview access to a number of team owners to test the reasonableness of their valuations and key assumptions.In addition, their estimated values are adjusted year-to-year to account for actual sale prices of teams that sell.This is helpful when observing estimated aggregate values over a long period of time.
Three Reasons to Consider a Valuation of Your FinTech Company
“Nowadays people know the price of everything and the value of nothing.”
– Oscar Wilde, The Picture of Dorian Gray
The above quote seems especially apt in the FinTech industry because the implied values of high-profile, private FinTech companies are often mistakenly reported by the media based on the share price paid by investors in a recently completed funding round. The problem with applying the pricing of the most recent raise to all shares is that the media rarely knows about investor preferences attributable to each funding. As a result, the value of the company is most likely overstated. Capital structures and shareholder preferences matter. Pari passu is not a given although it is often implicitly implied in media reports.
Consider the following example. Investors in a late-stage funding invest $100 million in return for 100,000 convertible preferred shares that represent 10% of the company’s post-raise fully diluted shares. The investors also get certain economic, control rights and other preferences with their preferred shares that earlier investors did not obtain. The headline notes that a new FinTech Unicorn has arrived because the implied value is $1 billion based upon the $100 million investment for the 10% interest; however, this simple calculation typically will overstate the Company’s value because the majority of the shares do not have the same rights and preferences as those purchased in the most recent financing round.
Valuing companies with limited if any operating history that involves a new technology is inherently difficult. The challenge increases when the subject has a complex capital structure. Nevertheless, valuations—whether reasonable or unreasonable—have very real economic consequences for investors, employees and other stakeholders, especially when new capital is injected into the equation. We are biased, but we believe private FinTech companies will be well served over the long-run to obtain periodic valuations from independent third parties. Reasons to do so include the following.
1. To Measure Value Creation Over Time
One of the best performance scorecard metrics to measure is value creation over extended time periods. For public companies, it is a simple process. Measure a company’s total return (percentage change in share price plus the return from reinvested dividends) and compare it to other benchmark measures such as the broader market, industry, and/or peers. For example, a publicly traded payments company whose shareholders have achieved a one-year total return of 10.0% can note on their scorecard that their performance has outpaced the returns from the S&P 500 and Mercer Capital’s FinTech Payments Index, which rose 4.0% and 4.6%, respectively, in the twelve months ended June 30, 2016.
For private companies, annual or more frequent valuations have to be obtained to create a realistic scorecard. Rules-of-thumb exist in every industry, but they are at best approximations and often haphazard guesses that do not take into account the key value drivers of earning power (or cash flow generation), growth, and risk. Some privately held financial services companies like banks may be able to proxy value creation without annual valuations by tracking growth in book value, ROE, and dividend payments, but even for homogenous entities such as banks these metrics say nothing about an institution’s risk profile. FinTech companies with little homogeneity among business models are poorly suited to measure value based upon rules-of-thumbs that are applied to revenues or even EBITDA. Every company is unique, and markets in which companies are valued are not static.
Also, there may be a tendency to overlook balance sheets beyond cash because FinTech balance sheets typically do not “drive” earning power as intangible assets, such as customer databases, intellectual property, patents, and the like, are not recorded unless there has been an acquisition. While understandable, ignoring the balance sheet can be a mistake because sometimes there are aspects to it that will impact value.
Additionally, dividends (the other element of shareholder return) and dividend paying capacity should be an important value consideration, even though FinTech companies often do not or cannot pay dividends in order to reinvest internally generated capital to fund future growth. Another benefit of the valuation process might be insight that suggests the board should shift to distributions from reinvestment because incremental returns are too low to justify.
It is advisable for private FinTech companies to measure value creation by having annual or more frequent valuations performed by an outside third-party. For example, consider Table 1 for Private FinTech Company that tracks returns to shareholders based upon changes in the appraised value of the shares and dividends paid over a three-year period. While the hypothetical 45% total return outwardly appears attractive, there is no context. Comparisons with publicly traded FinTech companies, broad industry indexes and realized returns following an acquisition for public and private companies will provide further relevance to the scorecard (Chart 1).
2. For Planning Purposes
Projections for an early-stage FinTech company are a given. In theory so too are rising valuations as important milestones, such as targeted market penetration, users, revenues, and EBITDA, are met. Unless the company does not require significant capital and/or internal capital generation is sufficient, the projections should incorporate additional capital raises and expected dilution based upon implicit valuations. On a go forward basis periodic valuations can be overlaid with the initial and any refreshed forecasts to measure how the company is progressing in terms of value creation relative to plan and to alternatives (e.g., a strategy pivot to a collaborative partnership from disruptor). The key is to measure and compare in order to have a contextual perspective to facilitate decision making.
3. For Employee Ownership Plans
FinTech companies usually attract talent by offering stock ownership so that employees share in the upside should the company’s valuation improve over time. Plus, stock-based compensation lessens a company’s cash needs all else equal. Complex capital structures with private equity investors that have preferences vis-a-vie employees create another potential valuation wrinkle. Returns to the two groups usually will differ. Well documented, periodic valuations are critical. There have been examples where employees have lost money by paying taxes based upon valuations higher than the company realized in a sale. While downside exposure to a company’s faltering performance and/or market conditions is the risk that comes with the potential upside of equity ownership, it is important to have a formalized valuation process to demonstrate compliance with tax and financial reporting regulations. Certainly, scrutiny from auditors, the SEC, and/or the IRS are likely at some point, but very real tax issues also can result from poorly structured or administered equity compensation plans for employees.
Conclusion
If you are interested in discussing the valuation needs for your FinTech company, please contact us. Depending upon how it is defined FinTech is a relatively new industry “vertical.” Mercer Capital has been providing valuation and transaction advisory services to a wide swath of financial services companies for over 30 years that runs the gamut from banks to FinTech. Financials are our largest practice vertical. We have a deep bench and would be delighted to assist.
This article originally appeared in the Second Quarter 2016 issue of Mercer Capital’s Value Focus: FinTech newsletter.
Learn More
