Buy-Sell Agreements for Closely Held and Family Business Owners
SPECIAL OFFER
For a limited time, Buy-Sell Agreements for Closely Held and Family Business Owners is specially priced at $25.
Quantity Discounts
- 1 – 4 books | $25.00 per
- 5 – 24 books | $20.00 per
- 25 – 49 books | $19.00 per
- 50 – 99 books | $18.00 per
- 100 – 199 books | $16.00 per
- 200 – 499 books | $15.00 per
- 500 – 999 books | $12.50 per
- 1,000+ books | $10.00 per
Buy-sell agreements are among the most common yet least understood business agreements and many are destined to fail to operate like the owners expect. Many, in fact, are ticking time bombs, just waiting for a trigger event to explode. If you are a business owner or are an adviser to business owners, this book is designed for you, providing a road map for business owners to develop or improve their buy-sell agreement.
Testimonials
This is the business owner’s self-defense manual. Reading it could be the most cost-effective hour or two you’ve ever invested. Don’t dare sign a buy-sell agreement until you’ve read and pondered the questions posed in this book. Your life(‘s work) may depend on it!
Stephan R. Leimberg
CEO and Publisher, Leimberg Information Services, Inc. (LISI)
The Buy-Sell Agreement Review Checklist
The Buy-Sell Agreement Review Checklist is the 2012 update to the “Audit Checklist.” It is a streamlined review tool that addresses the many obvious, yet overlooked, valuation issues related to buy-sell agreements.
It is also an ideal companion to the book, Buy-Sell Agreements for Closely Held and Family Business Owners: How to Know Your Agreement Will Work Without Triggering It
Recent Trends in the Fair Value of Community Bank Loan Portfolios
Although successful bank acquisitions largely hinge on deal execution and realizing expense synergies, properly assessing and pricing credit represents a primary deal risk. Additionally, the acquirer’s pro forma capital ratios are always important, but even more so in a heightened regulatory environment and merger approval process. Against this backdrop, merger-related accounting issues for bank acquirers have become increasingly important in recent years and the most significant fair value mark typically relates to the determination of the fair value of the loan portfolio.
Fair value is guided by ASC 820 and defines value as the price received/paid by market participants in orderly transactions. It is a process that involves a number of assumptions about market conditions, loan portfolio segment cash flows inclusive of assumptions related to expected credit losses, appropriate discount rates, and the like. To properly evaluate a target’s loan portfolio, the portfolio should be evaluated on its own merits, but markets do provide perspective on where the cycle is and how this compares to historical levels.
We reviewed fair values of recently announced community bank deals to determine if any trends emerged. As detailed in Figure 1, the fair value mark (i.e., the discount based on the estimated fair value compared to the reported gross loan balance) in recent deals appears to increase as the level of problem assets increases. However, the range remains quite wide and rarely hits the trendline, which could partially reflect the unique nature of isolated community bank loan portfolios. Overall, the median fair value mark observed was 3.30% while the median level of adjusted non-performing loans (as a percentage of loans) was 2.22%.
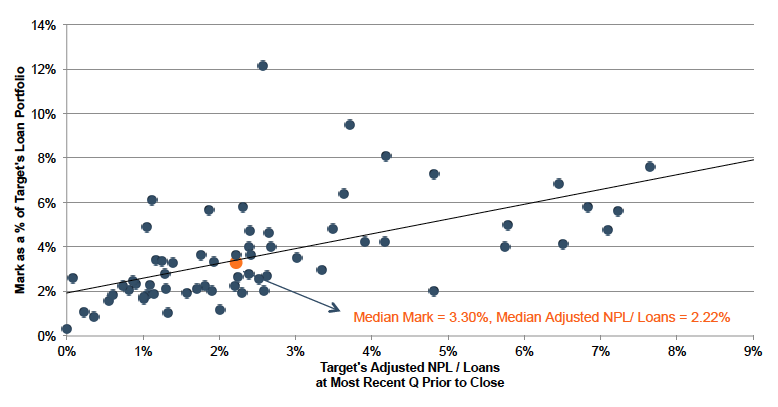
Sources: Mercer Capital research, company SEC filings, company investor presentations
The recent fair value marks were generally below those reported in deals during (2008-2010) and immediately after the financial crisis (2010-2012). This trend reflects a number of factors including:
- Stable to improving macro-economic trends. While contracting during the financial crisis, real GDP growth was relatively stable in 2013 and 2014 at approximately 2.20%. Real disposable income also increased 1.70% in 2014 after remaining relatively flat in 2013. Additionally, employment considerations have continued to improve in recent periods with the unemployment rate down to 5.7% in January of 2015 compared to 7.9% and 6.6% in January of 2013 and 2014, respectively.
- Higher real estate collateral values. While the 20-city S&P/Case-Shiller Home Price Index remains about 15% below its peak in mid-2006, it has increased about 25% since year-end 2011. Additionally, economic data from the Federal Reserve of St. Louis indicated that commercial real estate prices have been increasing year-over-year since year-end 2010 and were up 7.3% over the 12 months ended September 30, 2014.
- Reduced levels of noncurrent loans. As detailed in Figure 2, credit migration continued to be positive and levels have declined to almost pre-financial crisis levels (third quarter 2014 levels approximated early 2008 levels).
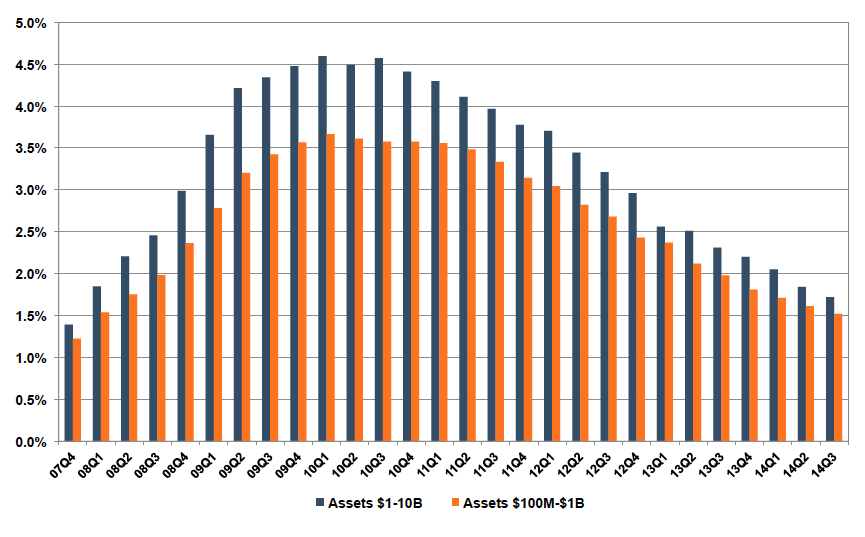
Source: FDIC
- Reduced Credit Spreads. Credit spreads provide perspective on a number of factors, including where the credit cycle has been and where it is headed, as well as potential portfolio issues at a target when there are no apparent issues. While credit spreads did increase in mid-2014, they have generally declined since the financial crisis as economic conditions as well as investor sentiment have improved. For example, BB credit spreads have declined from 5.0% in January of 2012 to 3.5% in January of 2015. All else equal, reduced credit spreads serve to lower the discount rate applied to the expected cash flows for a target’s loan portfolio, thereby increasing the fair value of the loan portfolio.
Mercer Capital has provided a number of valuations for potential acquirers to assist with ascertaining the fair value of acquired loan portfolio. In addition to loan portfolio valuation services, we also provide acquirers with valuations of other financial assets and liabilities acquired in a bank transaction, including depositor intangible assets, time deposits, and trust preferred securities. Feel free to give us a call or email to discuss any valuation issues in confidence as you plan for a potential acquisition.
Reprinted from Bank Watch February 2015.
Noncompete Agreements for Section 280G Compliance
Golden parachute payments have long been a controversial topic. These payments, typically occurring when a public company undergoes a change-in-control, can result in huge windfalls for senior executives and in some cases draw the ire of political activists and shareholder advisory groups. Golden parachute payments can also lead to significant tax consequences for both the company and the individual. Strategies to mitigate these tax risks include careful design of compensation agreements and consideration of noncompete agreements to reduce the likelihood of additional excise taxes.
When planning for and structuring an acquisition, companies and their advisors should be aware of potential tax consequences associated with the golden parachute rules of Sections 280G and 4999 of the Internal Revenue Code. A change-in-control (CIC) can trigger the application of IRC Section 280G, which applies specifically to executive compensation agreements. Proper tax planning can help companies comply with Section 280G and avoid significant tax penalties.
Golden parachute payments usually consist of items like cash severance payments, accelerated equity-based compensation, pension benefits, special bonuses, or other types of payments made in the nature of compensation. In a CIC, these payments are often made to the CEO and other named executive officers (NEOs) based on agreements negotiated and structured well before the transaction event. In a single-trigger structure, only a CIC is required to activate the award and trigger accelerated vesting on equity-based compensation. In this case, the executive’s employment need not be terminated for a payment to be made. In a double-trigger structure, both a CIC and termination of the executive’s employment are necessary to trigger a payout.
Adverse tax consequences may apply if the total amount of parachute payments to an individual exceeds three times (3x) that individual’s “Base Amount.” The Base Amount is generally calculated as the individual’s average annual W2 compensation over the preceding five years.
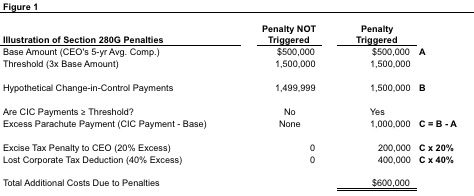
As shown in Figure 1 below, if the (3x) threshold is met or crossed, the excess of the CIC Payments over the Base Amount is referred to as the Excess Parachute Payment. The individual is then liable for a 20% excise tax on the Excess Parachute Payment, and the employer loses the ability to deduct the Excess Parachute Payment for federal income tax purposes.
Several options exist to help mitigate the impact of the Section 280G penalties. One option is to design (or revise) executive compensation agreements to include “best after-tax” provisions, in which the CIC payments are reduced to just below the threshold only if the executive is better off on an after-tax basis. Another strategy that can lessen or mitigate the impact of golden parachute taxes is to consider the value of noncompete provisions that relate to services rendered after a CIC. If the amount paid to an executive for abiding by certain noncompete covenants is determined to be reasonable, then the amount paid in exchange for these services can reduce the total parachute payment.
According to Section 1.280G-1 of the Code, the parachute payment “does not include any payment (or portion thereof) which the taxpayer establishes by clear and convincing evidence is reasonable compensation for personal services to be rendered by the disqualified individual on or after the date of the change in ownership or control.” Further, the Code goes on to state that “the performance of services includes holding oneself out as available to perform services and refraining from performing services (such as under a covenant not to compete or similar arrangement).”
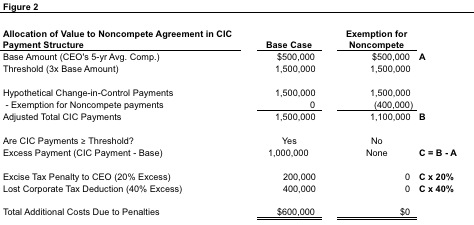
Figure 2 below illustrates the impact of a noncompete agreement exemption on the calculation of Section 280G excise taxes.
How can the value of a noncompete agreement be reasonably and defensibly calculated? Revenue Ruling 77-403 states the following:
“In determining whether the covenant [not to compete] has any demonstrable value, the facts and circumstances in the particular case must be considered. The relevant factors include: (1) whether in the absence of the covenant the covenantor would desire to compete with the covenantee; (2) the ability of the covenantor to compete effectively with the covenantee in the activity in question; and (3) the feasibility, in view of the activity and market in question, of effective competition by the covenantor within the time and area specified in the covenant.”
A common method to value noncompete agreements is the “with or without” method. Fundamentally, a noncompete agreement is only as valuable as the stream of cash flows the firm protects “with” an agreement compared to “without” one. Cash flow models can be used to assess the impact of competition on the firm based on the desire, ability, and feasibility of the executive to compete. Valuation professionals should consider factors such as revenue reductions, increases in expenses and competition, and the impact of employee solicitation and recruitment.
Mercer Capital provides independent valuation opinions to assist public companies with IRC Section 280G compliance. Our opinions are well-reasoned and well-documented, and have been accepted by the largest U.S. accounting firms and various regulatory bodies, including the SEC and the IRS.
Unlocking Private Company Wealth
With the current up-tick in the economy and the demographic realities of baby boomer business owner transitions, estate planners have a client base that may be seeking to monetize their investment in their closely held businesses. Many business owners immediately assume that means an outright sale. However, there are other liquidity options to consider.
This session, presented at the recent 2015 Heckerling Institute on Estate Planning, covered various liquidity options including dividend policy, partial sales to insiders, employee stock ownership plans, private equity investors, as well as third party sales.
Getting It Right: Loan Valuation and Credit Marks in Today’s M&A Market
Although investors and perhaps bankers are not as focused on credit as was the case several years ago, properly assessing credit risk and determining appropriate credit marks remains the key arbiter in determining whether a deal is destined to struggle or meet/exceed expectations. This session looked at the evolution of loan portfolio valuations as part of due diligence and M&A pricing since the financial crisis. Davis and Gibbs provided insight into some of the nuances around the evaluation process and what to look for in terms of potential potholes regarding potential acquisitions.
Presented January 26, 2015 at Bank Director’s 2015 Acquire or Be Acquired Conference.
CFPB Sets the Stage for the Federalization of Auto Credit
Jeff K. Davis, CFA, Managing Director of Mercer Capital’s Financial Institutions Group, is a regular editorial contributor to SNL Financial. This contribution was originally published October 6, 2014, at SNL Financial. It is reprinted here with permission.
The Consumer Financial Protection Bureau on Sept. 17 proposed to oversee nonbank auto finance companies, noting that the action was undertaken after it uncovered auto lending discrimination at the banks it supervises. The CFPB release also noted that auto loans are the third largest category of consumer debt after mortgages and student loans. I do not have the background to comment on the CFPB’s statistical analysis of auto lending practices to discern the presence of discrimination, though I am sure there are pockets as exist in any society.
Leave it to Washington to pass legislation and then write thousands of pages of regulations to “reform” and more tightly regulate and “safeguard” an industry when a simple five page document that requires depositories to operate with 15% to 25% more common equity capital would have sufficed. Maybe safety is a distant secondary concern to agendas? Whether well intentioned or an agent of an agenda, the CFPB is funded by the Federal Reserve and is thereby outside direct oversight of Congress via appropriations. It seems to me that the CFPB has a really long policy-making leash that probably will get much longer in time.
What was striking to me about the release is what appears to be the creeping and maybe soon to be rapid federalization of another credit product. You should not doubt that tighter regulation of auto finance will lead to less availability, which in turn will lead to demands for government support via subsidies or maybe direct government underwriting in time. What began as an effort to provide liquidity to the mortgage market in the 1930s through various programs morphed into a market that came to be dominated by the government-sponsored enterprises and which ended in tears when the bust came in 2008.
The federal government increasingly dominates the rapidly growing student loan market. The student loan market seems to be a ticking time bomb given the explosion in lending. If there is no detonation like that which occurred in the mortgage market, economic growth probably will be limited as imprudent borrowers spend years servicing debt that cannot be discharged in bankruptcy. Look for a federal bailout when the political conditions are right.
So what do we make of the CFPB’s auto credit actions that will bring the likes of Toyota Motor Credit under its purview? One is that it is becoming increasingly clear — at least to me — that Dodd-Frank is going to be as important for finance as the authorization of the Federal Reserve in 1913 and banking legislation adopted in the 1930s that led to deposit insurance and Glass-Steagall, among other things.
In the case of the Fed and FDIC, both pieces of legislation had their roots in a desire to stem the age old nemesis of bank runs. The Fed was to be a lender of last resort to banks — a function it performed exceedingly well in 2008 and 2009. The FDIC was intended to provide assurance to consumers and small businesses that their deposits, up to a limit, were safe. The FDIC has performed this core function well, though I think it is a fair question as to how good it and other regulators are at regulating lending decisions. Regardless, nothing is free; the cost, depending upon your point of view, has been mission creep for these institutions. Today, both arguably are instruments of government that direct credit to achieve government policies through various lending mandates and economic objectives such as full employment.
Another take I have on the CFPB’s action is that auto lending is the latest credit function that probably will be indirectly taken over by the government. Historically, credit was extended by bankers following the “C” motto for lending that involved evaluation of character, capacity (to pay), capital, collateral and (market) conditions. Government is increasingly interjected into the credit process as “guarantor” provided that some benchmark is met. The conversion of the old General Motors Acceptance Corp. into a bank holding company that today is Ally Financial Inc. is a case in point. Deposit insurance was extended to historically one of the largest captive auto finance companies.
Under the guise of fair lending and anti-discrimination initiatives, the CFPB is going to regulate a vast area of finance that is not directly controlled by banks. Financing of captives traditionally has relied heavily upon the securitization market, plus some combination of bank loans, unsecured bond offerings and support from the parent company. If the subprime auto market has a spectacular blow-off in the next downturn, maybe there will be a push by some in Washington to form a GSE to back auto loans? And it does not take too much imagination, at least by me, to see how the CFPB could further expand its oversight to other sectors. General Electric’s decision to spin-out most of its retail operations via Synchrony Financial looks to be really well-timed beyond management desire to shrink the size of General Electric Capital Corp.
The CFPB’s actions have implications for investors too, though Dodd-Frank is more important than the CFPB’s land grab. At a very base level, the utility model for an increasingly large swath of finance has been set. Investors will always be able to time their entry and exit to make great money or lose a fortune in a highly regulated industry, but all else equal the sector should trade at lower multiples than what used to be the case. ROE is lower, and earnings growth will be slower. Citigroup CEO Mike Corbat was recently quoted saying as much, but that the sector may see less volatility in his view. Maybe, but many banks seem to find themselves at the precipice every generation or so. And who is to say that the extortion payments Washington has extracted from the banks for the mortgage fiasco that it helped create will not be demanded from consumer lenders after a nasty recession at some point in the future?
Reprinted from Bank Watch, October 2014.
Return of the Large and Super Regional Buyers?
It is sort of like the pre-crisis days, but not really. Bank acquisition activity involving non-assisted transactions has been gradually building since the financial crisis. The only notable interruption occurred in the second half of 2011 when the downgrade of the U.S. by S&P (but not Moody’s or Fitch) and a funding crisis among many European banks caused markets to fall sharply.
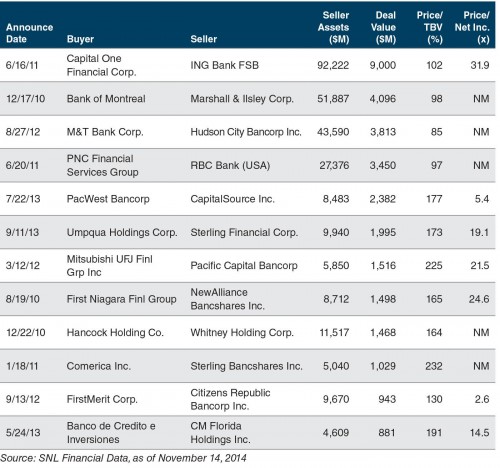
As of November 14, 260 bank and thrift acquisitions had been announced this year according to SNL Financial, which compares to 246 deals for all of 2013. Pricing continues to gradually improve too. The year-to-date average P/TBV is 135% compared to 120% in 2013 and 116% in 2012. In a sense, a declining median P/E points to higher valuations because sellers as a group are posting better profitability than several years ago. The median P/E ratio this year is about 28x compared to 23x in 2013 and 34x in 2012. Figures 1 and 2 highlight some of these comparisons for deals both in 2014 and from 2009-2013. Although it will be a subject for a later post in Bank Watch, we believe most buyers are paying roughly 10-13x the buyer’s normalized earnings with after-tax cost saves and normalized credit costs.
Figure 1
Figure 2
The heyday of M&A activity for investors was the 1990s when over 500 bank and thrift deals were announced in 1994 and 1998. Deal activity peaked last decade at 323 in 2007. Not coincidentally, cycle peaks in public market bank valuations occurred near the peaks in M&A activity in 1998 and 2007. When viewed as a percent of banks at the beginning of each year, deal activity has been relatively steady with 3-4% of banks being absorbed through acquisition, with the exception of 2008, 2009 and 2011.
One notable aspect of the bank M&A market since the financial crisis has been the absence of larger acquirers other than periodic deals. The primary reason cited has been regulatory challenges as large banks implement tough compliance requirements as part of Dodd-Frank and other regulatory mandates that emerged from the 2008-2009 financial crisis. Also, many bankers and corporate securities attorneys have publicly commented (and to us) that the Fed does not want to see merger applications from the largest banks; rather, they want consolidation to occur from the bottom rather than the top of the industry.
M&T Bank Corporation (MTB) remains the poster-child for the industry in terms of what can go awry with a merger application when a compliance issue emerges. M&T announced a deal to acquire then $44 billion asset Hudson City Bancorp on August 27, 2012 for $3.8 billion as shown in Figure 2. Over two years later the deal remains pending due to compliance issues that emerged for M&T, including some issues related to its 2011 acquisition of Wilmington Trust Corporation. Although on a smaller scale, BancorpSouth (BXS) recently extended by about a year the date of two definitive agreements it had entered into to acquire community banks in Louisiana and Texas due to compliance issues that emerged after the definitive agreements were signed.
CEO Richard Davis of US Bancorp (USB) has opined that acquisitions by larger banks will be episodic and focused like USB’s acquisition of Citizen Financial Group’s Chicago franchise earlier this year rather a broad-based trend. Nevertheless, the return of BB&T Corporation (BBT) to the acquisition market this year may signal larger banks are becoming more comfortable with their regulatory standing to resume acquisitions. In late 2013 BB&T announced a deal to acquire 22 Texas offices from Citigroup Inc. (C); it then announced a second purchase for 41 Texas branches in September. Within a week BB&T announced a $367 million deal for Bank of Kentucky Financial Corporation (BFKY). In November, it announced a $2.5 billion acquisition of Pennsylvania-based Susquehanna Bancshares (SUSQ). See Figure 1 for other details of these transactions.
The largest transaction announced year-to-date is CIT Group’s (CIT) $3.4 billion deal for IMB HoldCo, a privately-held entity that formed OneWest Bank from the failed IndyMac Bank, as shown in Figure 1. The transaction may be an outlier because CIT was under pressure from the Federal Reserve to build a core deposit franchise that does not yet exist in subsidiary CIT Bank, which traces its roots to a Utah industrial loan charter.
We do not know whether Davis is right about large bank M&A activity being episodic rather than on the cusp of picking-up. What is apparent is that the operating environment for banks remains challenging with pressure on NIMs, increasing regulatory costs and limited opportunities to improve fee income. As a result, we see no reason deal activity will slow from the 3-4% of the industry being absorbed each year other than as a result of a sharp drop in markets and/or a downturn in credit. The return of BB&T and the addition of the likes of First Horizon National Corporation (FHN) should, at the margin, support activity and maybe pricing to the extent it supports investor and banker confidence in the sector.
Reprinted from Bank Watch, November 2014.
Richmond v. Commissioner
In Richmond v. Commissioner (Estate of Helen P. Richmond, Deceased, Amanda Zerbey, Executrix, Petitioner v. Commissioner of Internal Revenue, Respondent. T.C. Memo. 2014-26), several key issues were addressed including:
- A split is highlighted among different Courts of Appeals and the Tax Court regarding how the implicit tax liability for a built-in capital gain (“BICG”) should be handled in a business valuation. The tax can be deferred. According to the Tax Court, a prospective BICG tax liability is not the same as a debt that really does immediately reduce the value of a company dollar for dollar.
- The Tax Court rejected the income approach to valuation for this asset-holding entity. It clearly stated that the Net Asset Value approach is consistent with the precedent of using net asset valuations for companies with asset holdings whose underlying values are readily ascertainable.
- The Tax Court assessed substantial penalties.The reported value on the estate tax return was less than 65% of the proper value, thereby triggering the benchmark for a “substantial” understatement under the tax law.
Background
At the time of her death, Helen Richmond held a 23.44% interest in a family-owned personal holding company, Pearson Holding Company (“PHC”). PHC was incorporated in Delaware in 1928 as a family-owned investment holding company, a Chapter C corporation. At the valuation date, PHC held a portfolio with an asset value of $52,159,430 and liabilities of only $45,389. Accordingly, PHC had a net asset value of $52,114,041. PHC’s portfolio of assets consisted of government bonds and notes, preferred and common stocks, cash, receivables and a modest security deposit. Common stocks represented over 97% of the total portfolio. Due to a low turnover in the underlying securities, PHC had an unrealized gain approximating $45,576,677, or 87.5% of the net asset value.
The co-executors of the estate engaged a law firm to prepare the estate tax return and retained a CPA at an accounting firm to value the PHC stock for purposes of the estate tax return. The estate tax Form 706 was filed timely. The Court noted that the CPA had a Master of Science in taxation, experience in public accounting involving audits, management advisory, litigation support and tax planning, was a member of the AICPA and other accounting groups, and had appraisal experience having written 10-20 valuation reports and testifying in court, but he did not have any appraiser certifications. The CPA prepared a draft report that valued the decedent’s interest at $3,149,767, using a capitalization of dividends method. Without further consultation with the CPA, the estate filed Form 706 based on this report. The IRS issued a statutory notice of deficiency. The IRS determined a value of the estate’s interest at $9,223,658. The tax liability was thereby increased, and a gross valuation misstatement penalty of $1,141,892 was determined.
At Trial
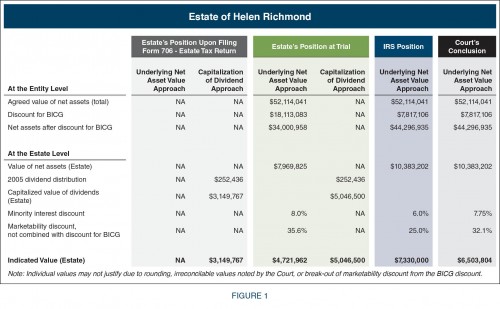
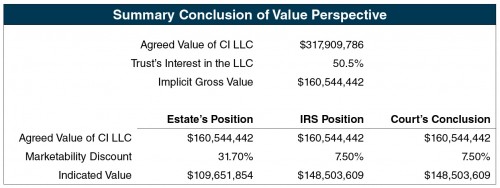
For ease of comparison, the position and conclusion of all parties at trial is shown in Figure 1.
At trial, the IRS expert in business valuation used a discounted net asset value approach (NAV). The agreed value of net assets, $52,114,041, was discounted by $7,817,106 before allocating the net value to the Estate’s 23.44% interest. The $7,817,106 represents 15.0% of the net asset value, and 43.16% of the agreed capital gain tax liability of $18,113,083, and 17.15% of the approximate unrealized gain of $45,576,677. The Court’s opinion described a convoluted rationale for the 15% BICG discount stating its “reasoning is not supported by the evidence.” The IRS expert further applied a 6% minority interest discount and a 25% marketability discount, concluding the Estate’s interest at $7,330,000. The Court noted this value was lower than the $9,223,658 value stated in the IRS’s initial notice of deficiency.
The original information on Form 706 was not defended at trial. Rather, the Estate offered a second opinion prepared by a business valuation expert, requesting that the Court adopt this expert’s opinion. This expert provided opinions based on both the underlying net asset value approach and the capitalization of dividends approach. The underlying net asset value approach discounted the UNAV by 100% of the BICG ($18,113,083), and then took an 8% minority interest discount and a 35.6% marketability discount. The Estate’s interest was $4,721,962 by this approach. This expert also offered an opinion based on the capitalization of dividends approach, incorporating the concepts of minority interest and marketability into the capitalization rate. The capitalization of dividends approach to value determined the Estate’s interest at $5,046,500.
In its opinion, the Court concluded that only the net asset value approach was appropriate for this asset holding entity. The opinion states that the agreed net asset value should be discounted by the 15% suggested by the IRS expert ($7,817,106), further discounted by 7.75% for the minority interest discount and 31.2% for a marketability discount. A value for the Estate at $6,503,804 was established by the Court.
The Court determined its 7.75% minority discount by referencing 59 closed-end funds utilized by both the IRS and Estate experts. Although the IRS was at 6% and the Estate at 8%, the Court examined the data presented and removed three outliers they believed skewed the mean, and re-calculated the mean at 7.75%. The Court concluded this to be reasonable.
The Court determined its 32.1% discount for lack of marketability by referencing restricted stock studies provided by both the IRS and the Estate. Both experts had interpreted those studies for their own purposes and the Court stated that, based on the studies, a general agreement appeared to exist that a marketability discount in the range of 26.4% to 35.6% with an average discount of 32.1% was appropriate and concluded to be reasonable.
Here’s What’s Important
The Court made it clear the NAV approach is more appropriate for an asset-holding entity as opposed to a capitalization of dividends approach. The capitalization of dividends valuation method is based entirely upon estimates about the future – the future of the general economy, the future performance of the Company and its future dividend payouts, and even small variations in those estimates can have a substantial effect on the value. The NAV approach does begin by standing on firm ground – publicly traded stock values that one can simply look up.
With regard to the BICG tax liability, the Court found that, despite contrary decisions by some courts, a discount of 100% of the implicit tax liability would be unreasonable, because it would not reflect the economic realities of the Company’s situation. The Court concluded the BICG tax liability cannot be disregarded in valuing PHC, but that PHC’s value cannot be reasonably discounted by this liability dollar for dollar. The Court concluded that the most reasonable discount is the present value of the cost of paying off that implicit liability in the future, and calculated the present value of that $18.1 million BICG liability over a 20 to 30 year holding period at discount rates ranging from 7.0% to 10.27%. It found the $7.8 million discount suggested by the IRS fell comfortably within their calculated range, thereby confirming that discount as reasonable in this case.
The Court assessed an accuracy-related penalty against the Estate. The Estate initially reported the value at $3,149,767 on Form 706, versus the Court’s determination of $6,503,804. The estate tax return was less than 65% of the proper value and a substantial valuation understatement exists under IRS guidelines. However, the 20% penalty would not apply to any portion of an underpayment if it is shown there was a reasonable cause for such portion and the taxpayer acted in good faith with respect to such portion. But the Court could not say in this case that the Estate acted with reasonable cause and in good faith by using an unsigned draft report as its basis for filing Form 706. Substitute appraisals were used at trial, and the value on the Estate Tax Return was left essentially unexplained. Additionally, while the initial value was prepared by a CPA, he was not a certified appraiser. The Court stated: “In order to be able to invoke ‘reasonable cause’ in a case of this difficulty and magnitude, the estate needed to have the decedent’s interest in PHC appraised by a certified appraiser. It did not.” The Court sustained the Commissioner’s imposition of an accuracy-related penalty.
The Tax Court has wrestled with the controversy of the appropriate treatment of the implicit tax liability for the built-in gain in a C-corporation since the repeal of the General Utilities doctrine by the Tax Reform Act of 1986. The taxpayer’s expert took 100% of the stipulated implicit tax liability as a discount against net asset value in the Richmond case. But the Tax Court countered by acknowledging conflicting opinions on this issue and stating “However, other Courts of Appeals and this Court have not followed this 100% discount approach, and we consider it plainly wrong in a case like the present one.”
The Tax Court resolved the issue in Richmond by discounting to present value the amortization of the current implicit tax liability over a period of 20 to 30 years. However, that methodology may not stand the test of an effective challenge. Such an approach fails to consider prospective underlying growth of the corporate “inside assets” in question. As those assets grow in the future based upon some reasonably achievable or projected growth rate, the implicit tax liability will grow right along with them since the underlying tax basis will remain fixed until the assets are sold. This expanding “spread” between the assets’ fixed tax basis and their future fair market value enhances the implicit tax liability beyond the known amount at a given valuation date. That growing liability will serve to diminish investment returns and would be considered in any fair market value negotiation for C-corporation stock at the valuation date.
The Business Appraisers’ Position
Mercer Capital addressed the investment rate of return perspective for hypothetical buyers and sellers dealing with built-in gains in our article: Embedded Capital Gains in Post-1986 C Corporation Asset Holding Companies. Chris Mercer concluded the analysis by stating: The end result of this analysis is that there is not a single alternative in which rational buyers (i.e., hypothetical willing buyers) of appreciated properties in C corporations can reasonably be expected to negotiate for anything less than a full recognition of any embedded tax liability associated with the properties in the purchase price of the shares of those corporations. And rational sellers (i.e., hypothetical willing sellers) cannot reasonably expect to negotiate a more favorable treatment, because any non-recognition of embedded tax liabilities by a buyer translates directly into an avoidable cost or into lower expected returns than are otherwise available. Valuation and negotiating symmetry call for a full recognition of embedded tax liabilities by both buyers and sellers.” View the full article here.
Bank Valuation: Financial Issues, Valuation Implications
With the banking industry facing new regulations and other pressures, this session focuses on the current environment at banks and valuation techniques appropriate for rendering valuation opinions that are consistent with this environment.
- Understand the current environment facing depository institutions and its effect on their valuation
- Appreciate unique factors affecting the valuation of depository institutions that are not present in the valuation of non-financial companies
- Identify and execute valuation methodologies consistent with this environment
Presented November 10, 2014 at the 2014 AICPA Forensic & Valuation Services Conference.
Digging Deeper: Exploring Nuances of DCF Analysis
If the present value of the subject company’s expected future cash flows is a foundational measure of the value of a company, practitioners should be very deliberate in projecting those future cash flows. In this session, participants will:
- Identify several key DCF model inputs
- Understand what drives DCF model inputs and how they relate to each other
- Learn how to present and interpret DCF model outputs under different scenarios
- Evaluate some of the most common biases in assumptions that can undermine cash flow forecasts
Presented November 10, 2014.
An Introduction to Business Development Companies
In the hunt for yield, investors are increasingly setting their sights on business development companies (BDCs), which offer stock market investors access to portfolios of private equity investments.
This webinar explored the features that have contributed to the growth in BDCs, underlying asset classes to which BDCs offer investors exposure, and highlighted the key performance metrics for evaluating BDCs.
Our panel discussed relevant regulatory developments affecting BDCs, review the portfolio valuation procedures and assumptions that influence quarterly profits, and explore the relative performance of key market benchmarks.
Webinar sponsored by SNL Financial. Presented September 23, 2014.
Boston Private Bank & Trust Company Acquisition of Banyan Partners
This article is reprinted from Mercer Capital’s Asset Management Industry newsletter (Q2, 2014). For a review of a prior transaction referenced in this article (Tri-State Capital’s acquisition of Chartwell Investment Partners), see the Q4, 2013 issue of Asset Management newsletter.
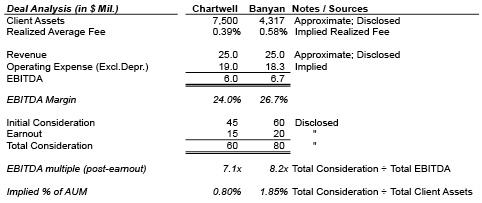
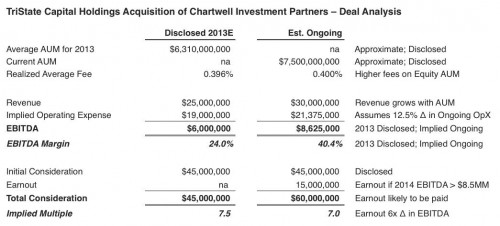
On July 16th, 2014 Boston Private Financial Holdings, Inc. (NASDAQ ticker: BPFH), the holding company of Boston Private Bank & Trust Company, entered an asset-purchase agreement to acquire Banyan Partners, LLC, a Registered Investment Advisor (RIA) headquartered in Palm Beach Gardens, Florida with approximately $4.3 billion in client assets. Key attributes of this deal and another recent bank acquisition of an asset manager are presented in Figure 1 below for perspective on industry pricing metrics.
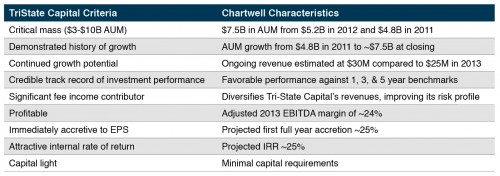
Similar to the Tri-State/Chartwell deal earlier this year, management delineated how Banyan’s attributes met Boston Private’s investing criteria as shown in Table 1.
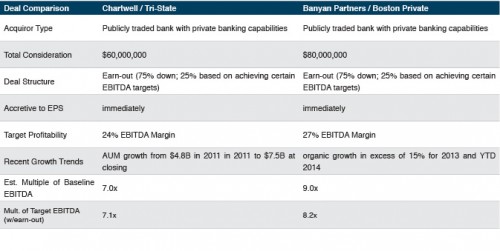
Table 2 depicts other similarities and key attributes of the Tri-State/Chartwell and Boston Private/Banyan Partners deals as banks continue to target advisors for exposure to fee income and higher margin products.
These recent deals are particularly instructive to other industry participants since, of the nearly 11,000 RIAs nationwide, approximately 80 (<1%) transact in a given year, and the terms of these deals are rarely disclosed to the public. Part of this phenomenon is attributable to sheer economics – a new white paper from third-party money manager, CLS Investments, argues that many advisors lose out financially in an outright sale of the business. Another recent publication titled "Advisors: Don't Sell Your Practice!" in research magazine ThinkAdvisor notes that many principals earn more in salary and bonuses than they would from the consideration they would otherwise receive in an earn-out payment over a period of time, as many of these deals are structured. In other words, returns on labor exceed potential returns on capital for many advisors, particularly for smaller asset managers that typically transact at lower multiples of earnings or cash flow. In these instances, an internal transaction with junior partners might make more sense for purposes of business continuity and maximizing proceeds. For larger RIAs, recent deals at 7-9x EBITDA suggest that buyers are willing to pay a little more for the size and stability of an advisor with several billion under management.
For more information or if we can assist you in any way, please feel free to contact us.
Reprinted from Bank Watch, September 2014.
Waiting on Margin Relief
Although it is difficult to discern with the ten-year U.S. Treasury presently yielding about 2.4% compared to 3.0% at the beginning of the year, many market participants believe the Federal Reserve will begin to raise the Fed Funds target rate next year. The thought process is not illogical. Consider that:
- The FOMC in late July announced that it would reduce monthly bond purchases (again) by $10 billion, leaving $25 billion to “taper” from what was a pace of $85 billion of monthly bond purchases when QE3 began in late 2012.
- Several Fed officials—notably some of the more hawkish regional bank presidents—have openly talked about rate hikes occurring sooner than the market expects.
- Second quarter GDP expanded at a 4.0% annualized pace based upon the initial estimate by the Commerce Department.
- Some measures of inflation are pointing to future issues, though wages and the Fed’s preferred inflation measure, the Personal Consumption Expenditures index, are not yet signaling emerging inflation.
- The unemployment rate as measured by the Bureau of Labor Statistic U-3 has declined to 6.2% from a peak of over 10% in October 2009.
- The Fed Funds target was reduced to 0.0% to 0.25% nearly six years ago and years since the immediacy of the financial crisis passed.
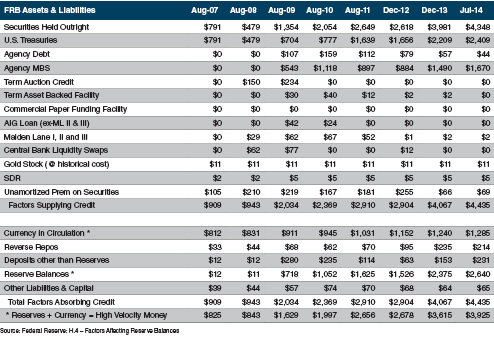
How high short-term rates may rise is unknown. (A corollary question for others is what, if anything, will the Fed do with its enlarged balance sheet as shown in Table 1.) Pimco’s Bill Gross has opined that the “new neutral” target rate will be around 2% rather than a historical policy bias of 4%. For lenders, money market funds and trust/processing companies, a hike in short rates cannot occur soon enough.
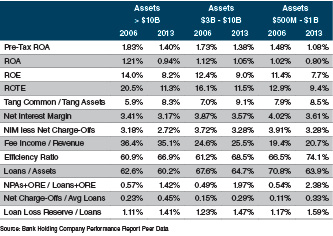
Although the Fed’s zero interest rate policy (“ZIRP”) helped reinvigorate markets, the economy and asset quality, it is increasingly weighing on revenues via depressed net interest margins (“NIM”) and post-recession profitability as shown in Table 2.
For traditional banks that primarily rely upon spread revenue, this is especially true. Funding costs cannot go lower, while asset yields remain under pressure. The asset yield story is nuanced, however. Bond portfolio yields have stabilized after years of cash flows being reinvested at lower rates. Loan portfolio yields partly depend on the mix, but the general trend since the financial crisis occurred continues to be down for two reasons. One is the reduction in the base rate (LIBOR, swap rate and 5-/10-year U.S. Treasury) that occurred during 2008-2011. Since then lower loan yields largely have reflected intensifying competition as lenders become more confident about the economy and less tolerant of holding excess amounts of liquidity and bonds. Banks have lowered or waived loan floors and have been willing to accept lower margins over the base rate to put higher yielding assets on the books. Some may recall the mantra last heard in 1993 when the Funds target was 3.0% and again in 2003 when it was 1.0%: “cash is trash.”
The other nuanced aspect of asset yields is the impact gradually improving loan growth for a broader swath of the industry has had on NIMs. Funding loan growth with excess liquidity and bonds entails a yield pick-up. What intensified competition does not show until the credit cycle turns is how much credit standards were relaxed to drive volume. Time will tell, though anecdotal stories we hear indicate there has been significant loosening of standards.
Should the FOMC follow through and raise short rates next year, most banks with a reasonable amount of LIBOR- and/or prime-based loans and non-interest bearing deposits will see revenues increase—provided deposit rates do not have to be raised aggressively and there are not too many (or too high) loan floors.
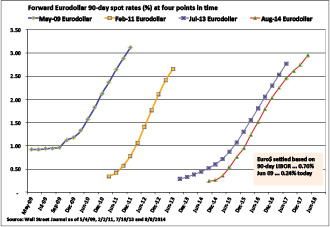
It seems like an ideal set-up for banks if the Fed will do its part. That said, we have been here before. Figure 3 reflects the forward Eurodollar curve at four separate dates: May 2009, February 2011, July 2013 and August 2014. Eurodollar contracts reflect future spot rates for U.S. dollars based upon where 90-day LIBOR is expected to settle. The contracts trade in a highly liquid market, unlike those for Fed Funds futures.
What Figure 3 shows is that the market has expected short rates to rise soon as soon as ZIRP was implemented. In May 2009, the expectation was that by late 2010 short rates would begin to rise. In early 2011, a strong fourth quarter 2010 GDP report (+3.2%) pushed contract prices down and forward spot rates sharply higher. The forward curve in July 2013 reflected higher short rates by late 2014. Currently, the forward curve projects higher short rates by mid-2015. And on it goes.
Bank executives and directors should be planning if the inevitable does not happen. Worse, what happens if rates stay low before the next recession occurs? Banks will struggle with a lower cushion in the form of pre-tax, pre-provision earnings to fund losses and/or build loan loss reserves than would be the case if short-rates and the NIM were higher. Of course, Dodd-Frank has mandated higher capital ratios to cushion losses as a perverse offset to ZIRP.
We at Mercer Capital have differing opinions about how Fed policy will evolve over the next year or two, but none of us (or you) knows for sure. Opinions are no substitute for planning. We do believe the planning process for a much longer period of ZIRP will require executives to think hard about the relevance of branch networks, the prudence of significantly shortening the duration of bond portfolios and how much credit risk is being assumed to achieve loan growth. A question that assumes more urgency is: Should the Board move sooner rather than later to sell or merge with a similar-sized institution if the Fed is not going to raise short rates (much) and thereby boost what may be an unacceptably low ROE for many banks?
We at Mercer Capital do not have the answer to every question, but we can help you ask the right questions and frame the answers in terms of thinking about shareholder value.
Reprinted from Bank Watch, August 2014.
Regulatory Landscape Overview from First Half of 2014
All is never quiet on the regulatory front, and the first half of 2014 was no exception. Below is a discussion of some (but certainly not all) developments affecting financial institutions at the federal regulatory level, from QMs, TruPS CDOs, and CCAR to payday lending, mobile banking, and the fines and penalties parade.
Qualifying Mortgages and Mortgage Servicing Rights
In January 2014 the Consumer Financial Protection Bureau (CFPB) implemented new rules intended to protect consumers shopping for a home mortgage. While some of the requirements are relatively minor and ultimately lead to a “check the box” mentality, others could have a significant impact on the way banks (community banks in particular) approach this lending area, perhaps causing some to exit the business altogether. Additionally, the value of Mortgage Servicing Rights (MSRs) may be materially affected, as new regulations increase the complexity of servicing a loan.
Generally speaking, a Qualifying Mortgage (“QM”) must have the following characteristics:
- A lender must assess and verify the borrower’s ability to repay the loan.
- QMs cannot contain what the CFPB considers “risky features”, such as negative amortization or interest-only payment structures.
- Points and fees paid by the borrower at closing must remain below certain caps.
A January 2014 survey of 27 mortgage originating entities conducted by the National Association of Realtors highlights just how far reaching the impact of the new QM regulations may be. For example:
- 45% of respondents indicated they would not originate non-QM mortgages, which has the effect of reducing the credit available for home purchases. Given that non-QMs are commonly written to riskier borrowers, this will likely have an outsized effect on the availability of credit in the subprime market.
- No respondents indicated that rates would be the same for non-QM borrowers, but the degree to which non-QM rates would be higher varied. Again, this will likely have an outsized effect on the subprime market, in this case with regard to affordability of credit.
- 83% of respondents expect to add compliance staff and 72% expect to invest in compliance software. Additionally 11% plan to close title or other affiliated practices and 22% plan to cut staff to save costs.
The above factors will have an impact on the profitability of residential mortgage lending both from a revenue (decreased volume) and expense (higher compliance costs) standpoint.
With respect to MSRs, there are a number of new and/or enhanced rules regarding how servicers communicate with borrowers, address errors and credit payments. However, the rules that have perhaps the most impact on servicers concern the rights of borrowers facing foreclosure.
- Servicers must now contact borrowers by the time they are 36 days late paying their mortgage.
- Servicers cannot initiate a foreclosure until a borrower is more than 120 days delinquent, allowing time for the borrower to submit an application for a loan modification or other alternative to foreclosure.
- Servicers cannot start a foreclosure with a homeowner who has submitted an applicati0n for help.
- Servicers must provide timely, accurate information about a foreclosure and employees who are contacted by homeowners must be knowledgeable and have access to critical information.
- Servicers must make delinquent homeowners aware of all options available to them, and must provide detailed and timely explanations to borrowers who are not approved for loss mitigation.
Essentially, the cost of compliance, training and systems to meet the above requirements will increase, sometimes materially, the cost of doing business as a mortgage servicer, thereby reducing profitability and thus the value of MSRs.
For banks that retain their servicing rights, they will experience an even greater hit to the bottom line, from both the QM and MSR regulations. In a time when profits are getting pinched from every angle, this is just one more profit center where management will be forced to reevaluate something that has likely worked under the status quo for so long.
The Volcker Rule, TruPS CDOs, and CLOs
On January 14, 2014, federal regulators issued an Interim Final Rule, which clarifies the portion of the Volcker Rule that affects Trust Preferred Securities (TruPS) CDOs. Initial interpretations of the Volcker Rule led industry participants to believe that rules prohibiting short-term proprietary trading by insured depository institutions would affect banks owning the majority of existing TruPS CDOs. Following a significant amount of comments from the industry against the rule as it affected TruPS CDOs, as well as pushback from members of Congress, the Interim Final Rule issued in January provided that the “covered funds” prohibition under the Volcker Rule would not apply to a CDO if:
- the TruPS CDO was established, and the interest was issued, before May 19, 2010;
- the banking entity reasonably believes that the offering proceeds received by the TruPS CDO were invested primarily in Qualifying TruPS Collateral; and,
- the banking entity’s interest in the TruPS CDO was acquired on or before December 10, 2013, the date the agencies issued final rules implementing section 619 of the Dodd-Frank Act.
This rule also defined Qualifying TruPS Collateral as any subordinated debt instrument or trust preferred security that:
- was issued prior to May 19, 2010, by a depository institution holding company that as of the end of any reporting period within 12 months immediately preceding the issuance of such trust preferred security or subordinated debt instrument had total consolidated assets of less than $15 billion; or,
- was issued prior to May 19, 2010, by a mutual holding company.
The Interim Final Rule became effective on April 1, 2014.
On April 7, 2014, the Federal Reserve Board, in consideration of comments received, announced that banking entities would have two additional one-year extensions to conform their ownership interests in and sponsorship of certain collateralized loan obligations (CLOs). Only CLOs in place as of December 31, 2013, that do not qualify for exclusion under the final rule for loan securitizations would be eligible. Of note, the rules in their current state do not exclude CLOs, as they do with most TruPs CDOs, but rather simply give banks additional time to come into compliance.
CCAR and Stress Testing Results
The Federal Reserve’s annual Comprehensive Capital Analysis and Review (CCAR), as well as annual stress testing mandated by the Dodd-Frank act, focuses almost exclusively on the largest banking institutions. Much has been written about the results of these tests, including the Fed’s objection to five of the 30 participants’ capital plans. Of those, four were based on qualitative concerns that centered on the institution’s planning process and ability to forecast revenue and losses.
Based on the announced results of the 2014 CCAR, the 30 participating firms are expected to distribute 40% less than projected net income from second quarter 2014 through first quarter 2015 (in other words, an aggregate payout ratio of 60%). The institutions have a combined $13.5 trillion in assets, or approximately 80% of all U.S. bank holding company assets. It is worth noting that any limitations placed on an institution’s ability to return capital to shareholders will affect the ability to raise capital, the required rate of return of capital, and thus the valuations of banking stocks. Although smaller institutions which face less scrutiny over their capital plans will be less impacted from a valuation standpoint, the influence of the valuation multiples for the largest banks on the overall market for bank stocks cannot be underestimated.
In the first quarter of 2014 the Federal Reserve Board of Governors, the FDIC and the OCC issued final supervisory guidance for stress testing for institutions with less than $50 billion but more than $10 billion in assets. Although this size range still does not encompass the typical community bank, it does demonstrate the tendency for regulatory guidance and the expectations of regulators to “trickle down” to smaller institutions over time. The guidance document discusses supervisory expectations for DFA stress test practices and offers additional details about the methodologies that should be employed, and is likely worth the 69-page read. The document can be found in the March 2014 press release section of the FDIC website, located here (http://www.fdic.gov/news/news/press/2014/pr14019.html).
Payday Loans and Other Nonbank Lending
The CFPB thus far in 2014 has shown a particular interest in the operations of payday lenders and other nonbank lending institutions. The agency conducted a survey, the results of which it provided in a March 25 press release, that contained a number of findings regarding the payday lending market, including:
- four out of five payday loans are rolled over or renewed within 14 days;
- many borrowers renew so many times that they ultimately pay more in fees than the amount of money initially borrowed;
- four out of five payday borrowers either default or renew a payday loan over the course of a year; and,
- for borrowers on monthly benefits, one out of five remained in debt for the entire year of the study.
It is unclear if what the CFPB study refers to as “fees” is actually interest charged on the loans, as the press release makes no mention of interest or interest rates otherwise. The press release notes that “with a typical payday fee of 15 percent, consumers who take out an initial loan and six renewals will have paid more in fees than the original loan amount.” The press release also states that “the CFPB has the authority to oversee the payday loan market,” presumably quieting any in the industry who may question the agency’s authority over this market, and also making clear the agency’s intent to pursue regulations in this area.
In addition to payday lending, the CFPB also looked at other nonbank institutions, including debt collection agencies and consumer reporting agencies (aka credit bureaus), and found evidence that “many companies had systemic flaws in their compliance management systems, such as consistently failing to have a system in place to track and resolve consumer complaints.” None of these enforcement efforts affect the traditional banking sector directly. However, banks encounter similar issues frequently, whether with a borrower caught in a spiral of debt, attempted collections on loans, or the process by which they deal with consumer complaints. Banks also depend heavily on, and deal directly with, credit bureaus. Attention to developments in the attitude of federal regulators toward these areas can prove instructive.
Bonus: Regulators Target Mobile and Electronic Banking Issues, Fines and Penalties Machine Keeps Humming
On June 11, 2014 the CFPB opened an inquiry into the use of mobile financial services. The inquiry appears to focus on how the use of mobile devices for purposes of conducting financial transactions might benefit unbanked and underbanked customers, as well as what information is collected on consumers, how it is collected, and how it is disclosed. However, the inquiry also solicits feedback regarding privacy concerns and the potential for data breaches. This announcement continues the trend of an increased focus on the safety of electronic banking in general, particularly given all of the high profile data breaches for non-bank corporations in recent months.
And lastly, the various federal and state regulatory agencies continue to wield the settlement hammer. The following is a sample of penalties and fines announced in the month of June alone.
- On June 13, news surfaced that the DOJ is seeking more than $10 billion from Citigroup to settle an investigation into the sale and pricing of mortgage-backed securities prior to the 2008 financial crises. The fine would join that paid by JPMorgan Chase as one of the largest related to the financial crisis, and demonstrates that even with the crisis more than five years in the rearview mirror, the days of reckoning for banks are not behind us.
- On June 25, Regions Bank reached an agreement with the SEC, the Federal Reserve Board and the Alabama State Banking Department regarding inquiries involving the accounting for commercial real estate and other loans on nonaccrual status at the end of the first quarter of 2009. The Bank will pay a $51 million civil money penalty to resolve the matter. The SEC continues to pursue fraud charges against certain former employees.
- On June 17, SunTrust Banks announced the finalization of an October 2013 agreement with the U.S. Department of Housing and Urban Development and the U.S. Justice Department for a settlement related to the origination of FHA-insured mortgages and the bank’s portion of the national mortgage servicing settlement. The settlement includes consumer relief of $500 million and a cash payment of $468 million for mortgage servicing misconduct, including robo-signing and illegal foreclosure practices. The DOJ press release announcing the settlement quoted Attorney General Eric Holder as saying “We expect that there will be more cases like this to come.”
- Following through on the Attorney General’s comment, on June 30 the DOJ announced a $200 million settlement with U.S. Bank also for allegations that it violated the False Claims Act in conjunction with originating and underwriting mortgage loans insured by the FHA. The settlement was the result of a joint investigation by HUD, Office of Inspector General, the Civil Division of the Department of Justice, and U.S. Attorney’s Offices for the Northern District of Ohio and Eastern District of Michigan.
Conclusion
This article is not exhaustive, and no doubt new developments will continue to surface on a weekly, if not daily, basis. We encourage management teams for bank of all sizes to remain vigilant and informed on this topic. Perhaps the most fitting closing thought is “an ounce of prevention is worth a pound of cure.”
Reprinted from Bank Watch, July 2014.
Complacent Investors May Need to Reassess the Earning Power of Some Acquirers
Jeff K. Davis, CFA, Managing Director of Mercer Capital’s Financial Institutions Group, is a regular editorial contributor to SNL Financial. This contribution was originally published June 5, 2014 at SNL Financial. It is reprinted here with permission.
Portfolio manager Grant Williams remarked at John Mauldin’s Strategic Investment Conference in mid-May that there may be a bubble in complacency. Maybe so with the CBOE Volatility Index (VIX) below 12, high yield credit trading at tight spreads to Treasurys and other risk measures that are comparable to the period leading up to the 2007-2009 financial crisis.
The recent drop in the 10-year yield to about 2.4% from around 2.7% in late April has begun to raise questions about the economy with some investors. Bank stocks have underperformed this quarter even though the rally in bonds may produce better gains on the sale of mortgages and bonds than expected. The SNL U.S. Bank Index declined 4.9% quarter-to-date through May 30 compared to a 2.6% gain in the S&P 500. I think the complacency surrounding the prospects for most banks’ earnings is finally catching up with reality that returns are as good as they are going to get in the current low-rate, low-credit cost environment.
Investors may have a greater sense of urgency as it relates to the Wall Street banks given the widespread coverage of the decline in fixed income trading; however, the issue is not new. The Wall Street Journal’s “Heard on the Street” column on May 23 highlighted how Bank of New York Mellon Corp. and State Street Corp. disappointed investors after a run in their shares during 2013 on expectations that a more favorable rate environment would emerge and thereby drive earnings. The same could be said about Comerica Inc. and a number of other rate sensitive banks whose shares, I think, have priced in an expanding net interest margin from short-term rate hikes by the Fed.
But where the complacency may be painful is among smaller regional banks that emerged from the financial crisis as big winners. One of the hallmarks of these institutions was the acquisition of failed and troubled banks for nominal prices during 2009-2011. These acquisitions may have been cheap and even produced big bargain purchase gains, but the accounting made it tough to discern earning power. Many of these institutions still have NIMs that are significantly above peer margins due to accretion of loans that were marked down for both credit and rate characteristics. Eventually the accretion will end as discounted loans are repaid, refinanced or charged off. In some instances costs associated with collecting these loans may provide some offset, but the reality of the lending market is that new commercial and industrial and commercial real estate loans generally entail rates that are only 3% to 4%.
CIT Group Inc. provides a road map as a result of the fresh start accounting that was adopted when the company emerged from bankruptcy in late 2009. Fresh start accounting was confusing, resulting in sizable marks and accretion for both assets and debt financing. As a result, analysts struggled to get their arms around CIT’s core earnings capacity. Within the last year, the impact of fresh start accounting substantially dissipated. In the year-ago quarter the net finance margin was 4.43% as reported and 4.64% on an adjusted basis. During the first quarter of 2014 the reported and adjusted net finance margins were 3.66%. Not coincidentally, the 2014 consensus estimate declined to $3.11 per share as of May 30 from $3.90 per share a year ago. CIT’s shares have underperformed both the SNL U.S. Bank Index and the SNL U.S. Specialty Lender Index, declining more than 5% over the last year compared to gains of approximately 10% for both indexes as of May 30.
I think a similar outcome awaits a number of the 2009-2011 acquirers that still have a well above average NIM. The Street may argue that higher short rates will offset the loss of accretion income, but absent higher short rates I see this as a huge issue given my view that NIMs for most institutions are headed toward the low 3% level over the next two years. Acquisitions and loan growth, both of which utilize excess capital, can partially offset, but probably not entirely.
There are many banks that face this issue. Most have attempted to be transparent with investors. Old National Bancorp’s investor material clearly shows the difference between the first-quarter reported NIM of 4.22% and the core NIM excluding accretion of 3.36%. Hancock Holding Co. does so, too (4.06% vs. 3.37%). But are investors really processing the information and is the sell-side willing or even capable of doing so? After all, the bias for forward estimates is almost always higher. Stocks look cheaper that way. And who wants to buy shares of a bank whose earnings are going to fall?
In theory, an efficient market would discount the loss of accretion earnings if not disregard it, but I do not believe that is the case for small cap stocks with limited analyst coverage. So the punchline is this: a number of well-managed banks are poised to experience underperformance in their shares as the Street will be forced to revise lower 2015 estimates and general earning power expectations as the accounting accretion from the post-crisis deals wanes. Conversely, the low NIM banks may be poised to outperform on a relative basis, at least for a while.
Reprinted from Bank Watch, June 2014.
Is It Time for Banks to Rethink Insurance?
It’s no secret that the number of insurance agency acquisitions by banks and thrifts has declined considerably over the last ten years. According to SNL Financial, an average of 60 agencies were purchased by banks annually between 2004 and 2008. Over the next five years, the average annual tally dropped to 27. The most likely reason for this decline is the effects of the recession and less capital available for investment. Interestingly enough, however, the number of agency divestitures by banks has been fairly constant at about ten per year. In the broader market for insurance agencies/brokerages, transaction volume has only gotten more robust over the last ten years, including a record 361 deals completed in 2012. Private equity and strategic consolidators remain keenly interested in the sector.
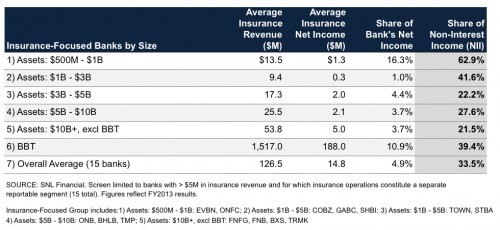
So is there any reason for banks to care about insurance anymore? A look at the numbers from some of the leading banks in insurance suggests that there is. We screened the universe of publicly traded banks for those institutions with at least $5 million in annual insurance revenue and for which insurance operations constituted a separate reportable segment. In other words, these are banks for which insurance operations are material, but the banks themselves are not so big as to dwarf the impact of the insurance revenue. Summary statistics for the 15 banks in our insurance-focused group are detailed below. The group is fairly evenly distributed by asset size, with the exception of BBT which is presented separately.
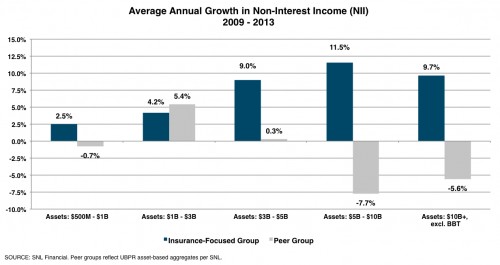
The most striking observation is the large share of non-interest income that these banks derive from their insurance operations. A consistent theme among banks for the last several years has been pressure on service charges on deposits. In fact, over the last five years, income from this line item has actually declined by 10.5% on average for banks in the $500M-$1B asset-based UBPR aggregate peer group. The results for the next two tiers, the $1B-$3B and $3B-$5B asset groups, were average declines of 4.2% and 3.5%, respectively. Growth in insurance-related revenue averaged 6.6% annually over the last five years for the insurance-focused group. So while the insurance-focused banks face similar pressures with respect to the traditional components of non-interest income, their insurance operations have provided a surprisingly strong source of growth.
The following chart compares the growth in overall non-interest income for the insurance-focused banks and their corresponding size-based peer groups.
It is clear that for those banks already in the insurance business, the revenue derived from this segment has provided a much-needed source of non-interest income and growth in an otherwise difficult operating environment. And for banks searching for new sources of non-interest income, insurance may offer a compelling opportunity.
What are the key factors to consider when purchasing an agency? First, we would suggest that the investment not be predicated solely on the basis of the cross-selling opportunities. Questions about whether the bank can provide leads to the agency (and vice versa) are important and meaningful, but should you as a buyer pay upfront for these things? A better way to approach the issue is to look for an agency with a stable, recurring revenue stream that can contribute to non-interest income and help diversify the bank’s earnings. An agency that already has an existing client base and recurring commissions can then be leveraged to achieve synergies with the bank.
The insurance business is a personal, sales-oriented business. Revenue is primarily commission-based, and growth is driven by rate (hard vs. soft market) and exposure units (volume). The biggest expenses are people, including commissioned producers to sell business and a quality support staff to service the business and provide customer service and claims support if necessary. Margins in the industry vary by size and product focus, but for the insurance-focused bank group, the average after-tax margin on insurance revenue was approximately 9.0% in 2013. The preferred metric in the agency/brokerage industry is EBITDA margin (earnings before interest, taxes, depreciation, and amortization), which certainly sounds out of place in the banking world, but is nevertheless the base upon which performance is assessed and deals are struck. EBITDA margins for the insurance segments in the bank group highlighted above range from the mid-teens to mid-twenties. Average return on equity for insurance agencies is also higher than for banks because the businesses do not require a large balance sheet. For example, the median return on equity over the period 2009 through 2013 for banks with assets of $1-$10 billion was 6.9% per SNL Financial, compared to 13.6% for the five largest publicly traded insurance brokers.
Other key considerations when evaluating potential agency acquisitions include concentrations (customer/producer/carrier), technology and compliance issues, and cultural fit. Concentrations add risk, especially if a large portion of the business resides with one key producer or owner. For bank acquirers especially, technology and privacy compliance issues could also create unanticipated challenges post-transaction if certain systems and procedures are not thoroughly investigated in due diligence. Cultural fit is hard to define but can either speed along the integration/transition process or threaten to derail it altogether.
How much should a bank pay for an agency or book of business? Rules of thumb can be dangerous, especially those metrics based on revenue, which ignore profitability. Most buyers and sellers tend to focus on adjusted EBITDA for the most recent year or perhaps a pro forma to normalize for non-recurring expenses and income. Transactions are more often than not structured as asset purchases and frequently involve multi-year earn-outs. Purchase prices usually involve a large upfront payment, followed by earn-outs based on future profitability or client retention targets. Because key owners and producers are often asked to stay on for a transition period post-sale, earn-outs serve the dual function of protecting the buyer and motivating the seller by providing for enhanced proceeds if the acquired agency performs above expectations.
Expanding into the insurance business might not be the best option for all banks but it’s clearly an avenue for growth and income diversification for those that can spot the opportunity. Once a platform bank agency is established, the existing regional and community bank branch footprint can be used to expand the model and grow the business. That’s an advantage that potential non-bank acquirers do not have. So while the transaction statistics might suggest that bank-owned agencies are a thing of the past, the performance of banks already in the business indicates that the model works – and that valuable opportunities may reside just down the street.
Mercer Capital provides the insurance industry with corporate valuation, financial reporting, transaction advisory, and related services. To discuss your needs in confidence, please contact us.
Reprinted from BankWatch, May 2014.
Five Big Valuation Issues
Z. Christopher Mercer, ASA, CFA, ABAR, founder and CEO of Mercer Capital, presented this keynote presentation to the American Academy of Matrimonial Lawyers and the AICPA 2014 Bi-Annual Joint Conference. The big five issues presented are:
- Discount Rates
- Control Premiums and Minority Interest Discounts
- Adjustments to the Income Statement
- Guideline Public Company Method and the Guideline Transaction Method
- Fundamental Adjustments
Also touched on was the topic of marketability discounts.
Banks Interested in Asset Managers and Trust Companies
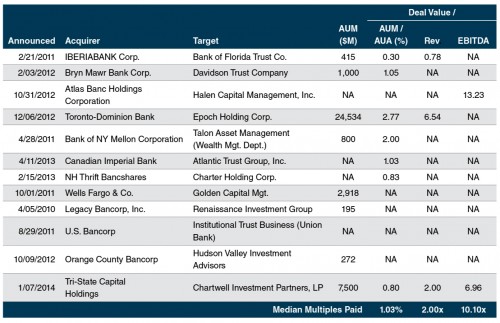
In a low interest rate environment coupled with rising capital requirements, many banks are turning their attention to asset management firms and trust companies to improve ROE and diversify revenue. Although deal terms are rarely disclosed, the table below depicts some recent examples of this trend with pricing metrics where available.
Source: SNL Financial
While multiples for activity metrics (AUM and revenue) can be erratic and tend to vary with profitability, EBITDA multiples are often observed in the 10x-15x range for public RIAs with their private counterparts typically priced at a modest discount depending on risk considerations, such as customer concentrations and personnel dependencies.
Powered by a fairly steady market tailwind over the last few years, many asset managers and trust companies have more than doubled in value since the financial crisis and may finally be posturing towards some kind of exit opportunity to take advantage of this growth. Despite the richer valuations, banks and other financial institutions are starting to take notice for a multitude of reasons:
- Exposure to fee income that is uncorrelated to interest rates
- Minimal capital requirements to grow AUM and AUA
- Higher margins and ROEs relative to traditional banking activities
- Greater degree of operating leverage – gains in profitability with management fees
- Largely recurring revenue with monthly or quarterly billing cycles
- Potential for cross-selling opportunities with bank’s existing trust customers
Still, there are often several overlooked deal considerations that banks and other interested parties should be apprised of prior to purchasing an asset manager or trust company. We’ve outlined our top three considerations when looking to purchase these kinds of businesses in today’s environment:
- Price. With most of the domestic equity markets at peak levels, asset manager valuations have never been higher, and purchasing an RIA or trust company prior to a market downturn or correction often leads to disappointing returns on investment. There may be some temptation to pay a higher earnings multiple based on rule-of-thumb activity metrics (% of AUM or revenue), but we would typically advise against paying above normal multiples of ongoing EBITDA for a closely held asset manager, absent significant synergies or growth prospects for the target company.
- Structure. Since many asset managers and trust companies are heavily dependent upon a few staff members for investing acumen or key client relationships, many deals are structured as earn-outs to ensure business continuity following the transaction. These deals tend to take place over three to seven years with a third to half of the total consideration paid out in the form of an earn-out based on future performance.
- Degree of operational autonomy. Asset managers (and their clients) value independence. Institutional investors typically have to consent to any significant change in ownership to retain their business following a transaction and may not be willing to do so if they feel that their asset manager’s independence is compromised. Senior managers at the target firm will likely need to be assured that the new owner will exert minimal interference on operations and strategic initiatives if key personnel are to be retained after the merger.
Perhaps because of these considerations, it is estimated that less than 1% of the 11,000 RIAs and independent trust companies transact in a given year. Still, with an aging ownership demographic and uniquely attractive business model to many prospective buyers, it is reasonable to assume that more asset managers and trust companies will transact in the coming years.
Mercer Capital provides asset management, trust companies, and investment consultants with corporate valuation, financial reporting valuation, transaction advisory, portfolio valuation, and related services. For more information, please contact us.
Koons v. Commissioner
It appears that Mr. Koons’ careful estate planning, involving a significant sale and redemption transaction of business operations to provide liquidity and flexibility in his later years, was disrupted by an untimely death. While estate planning professionals can hardly advise against a premature passing, the disruption here highlights the importance of starting early with business valuation input to help avoid a complex confluence of strategic transactions within a narrow time frame.
Key Issues
The Court rejected the Estate’s claim seeking a 31.7% marketability discount applied to a Revocable Trust’s ownership interest in a family-owned Limited Liability Company. The Estate’s expert calculated a marketability discount through a regression analysis. It was his opinion that a substantial risk existed that the Trust’s contemplated redemptions of Member Interests, contracted for as part of a planned redemption, might not be consummated. The contemplated redemptions would place the Trust in a voting control position.
The Court agreed with the IRS expert’s conclusion that the referenced redemption offers were binding contracts and were expected to be consummated. The lower risk implicit in the likelihood of a transaction, in context with the implicit voting control position, resulted in the IRS marketability discount of 7.5%, which was accepted by the Court.
The Court also held that claimed interest expense in the amount of $71,419,497 on a $10,750,000 loan from CI LLC to the John F. Koons III Revocable Trust is not deductible to the Estate as an essential expense. The Trust had borrowed the $10.75 million from the LLC in order to pay estate taxes.
Background
John Koons III (the “decedent” or “Koons”) died on March 3, 2005. At issue before the court was the value of his interest in his Revocable Trust (the “Trust’), as well as the deductibility of claimed interest expense on a loan which was incurred by the Trust to make payments on the estate tax liability.
In 1934, the father of John Koons III began buying shares in the Burger Brewing Co., which owned and operated a Cincinnati brewery. The decedent also purchased shares and later became the company’s president and CEO. Under Koons’ leadership, the company began bottling and distributing Pepsi soft drink products in the 1960s. In the 1970s the company stopped brewing beer altogether, and changed its name to Central Investment Corp. (“CIC”). Diversifying its business further, it expanded into the business of selling food and drinks from vending machines.
In 1997, CIC was in a dispute with PepsiCo about whether CIC had the exclusive right to sell Pepsi fountain syrup directly to restaurants, movie theatres, and other customers in its territory. Litigation ensued, and PepsiCo eventually suggested that the lawsuit could be settled if CIC exited the Pepsi system. CIC negotiated with PepsiAmericas, Inc., (“PAS”), the nation’s second largest Pepsi-Cola bottling company. Negotiations were expanded to include the sale of CIC’s vending-machine business.
In preparation for the sale of its soft drink and vending machine business, Central Investment LLC (“CI LLC”) was set up in August 2004 as a wholly owned subsidiary of CIC, to receive all the non-soft-drink and non-vending-machine assets. Koons and his children owned the same percentage in the newly-formed CI LLC as they did in CIC. However, the children were required to approve the sale transaction. Further, their interests in CI LLC were subject to redemption agreements within 90 days of the PAS transaction.
The PAS sale transaction was effected on January 12, 2005.
On February 27, 2005 (approximately four days before the valuation date), the last of the four children signed her letter offering to redeem their respective interests in CI LLC. Mr. Koons died on March 3, 2005. Mr. Koons had already transferred his interests in CI LLC to his Revocable Trust. At his death, the Revocable Trust had a total 50.50% interest in CI LLC, which included a 46.94% voting interest and a 51.59% nonvoting interest. The net asset value of CI LLC at the date of death was $317,909,786.
The children’s redemptions scheduled as part of the sale transaction took place on April 30, 2005 (approximately two months after the valuation date). With redemptions complete, the Trust (by then a Trust Under Will) owned a 70.42% voting interest and a 71.07% nonvoting interest in CI LLC.
On February 28, 2006 (approximately one year after the valuation date), the Trust borrowed $10.75 million from CI LLC to facilitate payments for Estate Tax liabilities. The Trust received a promissory note in the amount of $10,750,000 at 9.5% annual interest, with the principal and interest due in 14 equal installments of approximately $5.9 million each between August 31, 2024 and February 28, 2031. The terms of the loan prohibited prepayment. The total interest component of the 14 installments was $71,419,497. The proceeds of the loan would be used to make a payment toward the estate and gift tax liabilities.
Commentary
The parties agreed that the value of the Revocable Trust’s interest in CI LLC was less than the pro rata asset value. The parties also agreed that the difference was due to the lack of marketability of the interest in CI LLC as compared to the marketability of CI LLC’s assets. However, the parties disagreed on the magnitude of the marketability discount.
With Regard to the Marketability Discount
The Estate’s expert considered the Trust’s ownership interest in CI LLC as it existed on the date of death, i.e., a total 50.50% interest (comprised of a 46.94% voting interest and a 51.59% nonvoting interest). He developed a marketability discount through a regression analysis, and concluded that a 31.7% marketability discount was appropriate considering, among other factors, substantial risk existed that the redemptions of the children’s interests might not be consummated. Of course, the redemption of the children’s interests were accomplished soon after the valuation date, which resulted in the Trust owning a 70.42% voting interest and a 71.07% nonvoting interest in CI LLC.
The IRS expert believed that the redemptions of the interests of the four children would occur, and such redemptions would increase the voting power of the Trust’s interest to 70.42%. In determining a marketability discount, he considered the following characteristics of the Trust’s total 50.50% interest in CI LLC:
- There was only a small risk that the redemptions would not be completed;
- There were obligations imposed on CI LLC by the stock-purchase agreement, including those related to potential environmental, health, and safety liabilities;
- It was reasonable to expect that CI LLC would make cash distributions;
- There were transferability restrictions in the operating agreement;
- The owner of the Trust’s interest would have had the ability to force CI LLC to distribute most of its assets once the redemptions were closed;
- Most of CI LLC’s assets were liquid.
The IRS expert opined that a 5 -10% marketability discount was warranted. Within the 5 -10% range, he thought that 7.5% would reflect a reasonable compromise between a buyer and a seller.
The Court analyzed the two approaches to the marketability discount, highlighting that a key difference was the assumption of whether or not those scheduled redemptions would occur. The Court agreed with the IRS expert’s assumption, applying a 7.5% marketability discount, based on the following points:
- The redemption offers were binding contracts by the time Mr. Koons died on March 3, 2005;
- CI LLC had made written offers to each of the children to redeem their interests in CI LLC on December 21, 2004;
- Each of the four children had signed an offer letter by February 27, 2005;
- Once signed, the offer letters required the children to sell their interests in CI LLC to CI LLC.
With Regard to the Interest Expense Deduction
To raise money to pay for the Estate tax liabilities, the Trust borrowed $10.75 million from CI LLC in 2006. Because the installments were deferred for over 18 years, the interest component of the installments was high: it totaled $71,419,497.
According to the Court, administration expense deductions against the gross estate are limited by regulation to such expenses as are actually and necessarily incurred in the administration of the decedent’s estate, such as the collection of assets, payment of debts, and distribution of property to persons entitled to it. Expenditures not essential to the proper settlement of the estate, but incurred for the individual benefit of the heirs, legatees, or devisees, may not be taken as deductions.
The Court concluded it was not necessary for the Trust to borrow the $10.75 million from CI LLC in order to pay the federal tax liabilities:
- When it borrowed the money on February 28, 2006, the Trust had a 70.42% voting control over CI LLC, and CI LLC had over $200 Million in highly liquid assets.
The Trust had the power to force CI LLC and its Board of Managers to make a pro rata distribution to its members, including the Trust itself. - The Trust’s ability to force CI LLC to distribute assets made it unnecessary for the Trust to borrow from CI LLC.
- Lending money to the Trust did not avoid the necessity of making distributions altogether; it merely postponed the necessity. Furthermore, the Estate must remain active long enough for the loan to be repaid.
- The loan repayments are due 18 to 25 years after the death of Mr. Koons. Keeping the Estate open that long hinders the “proper settlement” of the Estate.
Since the loan was not necessary to the administration of the Estate, the projected interest to be paid under the loan is not a deductible administration expense of the Estate.
What’s Important
It appears that Mr. Koons’ careful estate planning, involving a significant sale and redemption transaction of business operations to provide liquidity and flexibility in his later years, was disrupted by an untimely death. The consideration of a loan component extending the life of the estate for many years beyond the date of death was an over-reach, and possibly could have been addressed after the redemption transaction. Furthermore, that redemption transaction clearly put the Trust in a voting control position. The IRS and the Court considered that contractual obligation to be a driving factor, thereby limiting the marketability discount. That controlling interest position would also likely have been addressed in a future estate planning strategy.
While estate planning professionals can hardly advise against a premature passing, the disruption here highlights the importance of starting early with business valuation input to help avoid a complex confluence of strategic transactions within a narrow time frame.
Tri-State Capital’s Acquisition of Chartwell Investment Partners: A Blueprint for Asset Manager Transactions
On January 7, 2014 Tri-State Capital Holdings, Inc. (NASDAQ ticker: TSC), the holding company of Pittsburgh-based TriState Capital Bank, entered a definitive asset-purchase agreement to acquire Chartwell Investment Partners, L.P., a Registered Investment Advisor (RIA) in the Philadelphia area with approximately $7.5 billion in assets under management (AUM). Unlike most acquisitions of closely held RIAs, the terms of the deal were disclosed via a conference call and investor presentation; the details of which are outlined below.
In the call and presentation, management delineated how Chartwell’s attributes met Tri-State’s investing criteria (as shown below). Many of these features are what makes many asset managers (not just Chartwell) so appealing to both banks and non-banks – growth potential, fee income exposure, high margins, scalability, operating leverage, adhesive clientele base, and minimal capital requirements. Few businesses possess all these characteristics, making many investment advisors like Chartwell the focal point of would-be acquirers with capital to spare.
Of the nearly 11,000 RIAs nationwide, typically less than 100 (<1%) transact in a given year, and the terms of these deals are very rarely disclosed to the public. Perhaps the biggest obstacle to effectively acquiring these businesses is the difficulty and uncertainty involved with ensuring that an asset manager’s clients, staff, and operational autonomy will be preserved post transaction. In a business totally dependent upon the investing acumen and long-term client relationships of a few key individuals, executive retention is critical yet often elusive if the firm’s independence is compromised by a prospective acquirer.
Because of these circumstances, the transactions that do take place are often complemented with contingencies based on staff and client retention with some part of the consideration structured as an earn-out to ensure financial performance holds up post transaction. Tri-State’s acquisition of Chartwell contains all these provisions and relatively favorable pricing, making it a viable prototype for deal structure in asset manager transactions.
Although RIA acquisitions have been relatively scarce in recent years, the outlook is perhaps more optimistic for 2014 as AUM balances and valuations at all-time highs may induce an aging ownership base to exit the business. With so much at stake, prospective buyers and sellers should utilize the Tri-State-Chartwell acquisition blueprint in negotiating a successful transaction for both parties.
To discuss a transaction or valuation need in confidence, contact us at 901.685.2120.
Bank Acquisitions of Asset Management Firms
This presentation, excerpted from Mercer Capital’s 2014 session at the Acquire or Be Acquired Conference sponsored by Bank Director magazine, focuses on the opportunities and challenges of the acquisition of an asset management firm by a bank.
Presented January 27, 2014
Acquisitions of Non-Depositories
An acquisition of a non-depository, such as an insurance agency, specialty finance company, trust company, or asset management firm, by a bank is an important decision. This presentation was presented at the 2014 Acquire or Be Acquire conference sponsored by Bank Director magazine and discusses the unique opportunities and challenges of such acquisitions.
Presented January 27, 2014
2013 Year-End Market Recap: Winners and Lesser Winners
While many banks chafe under tightening regulatory policy directed by the Federal Reserve and other agencies, the Fed’s monetary policy has, however, created favorable conditions for equity investors. Likewise, the Fed’s monetary policy has compressed spreads on credit-sensitive assets and negated the return on holding liquidity. From bank management’s perspective, these conditions have led to continued deterioration in asset yields, pressure to extend loan portfolio durations, and few remaining alternatives to reduce funding costs. In sum, the Federal Reserve and other agencies have created conditions that complicate bank managers’ decision making – namely, greater regulatory burdens and the effects of a prolonged low interest rate period. However, the Fed’s monetary policy also has created conditions ripe for expansion of banks’ stock prices.
For 322 banks traded on the NYSE, NYSE MKT, and NASDAQ, the median calendar year 2013 shareholder return (that is, stock price change plus dividends) was 38%. As indicated in Chart 1, only eight banks (2% of the population) suffered a negative return in 2013, with nearly one-third (32%) enjoying a total return exceeding 50%.
Chart 1: 2013 Total Return
The market performance is particularly striking when viewed relative to revenue growth in 2013, measured by the change in year-to-date recurring revenue between the year-to-date period ended September 30, 2013 and the comparable prior year period. Approximately one-half of the publicly traded banks experienced declining revenue in 2013, as illustrated in Chart 2. Many of the banks reporting faster revenue growth rates completed an acquisition.
Chart 2: YTD 2013 Revenue Growth (Through 9/30/13)
While revenue growth was difficult in 2013, banks had further opportunities to reduce credit-related costs, leading to some increase in net income. SNL Financial’s estimates suggest that “core” net income (that is, excluding certain non-recurring revenue and expense items) expanded a median of 8% for the population of publicly-traded banks in the trailing twelve month period ended September 30, 2013.
Winners and “Lesser” Winners
In performing a post mortem on a concluded year, it is often instructive to separate banks experiencing positive and negative returns, and then search for common characteristics distinguishing the two groups. In 2013, however, the “winner” and “loser” analogy appears less descriptive of the year. Therefore, we adopt the terms “winners” and “lesser winners.”
Market performance in 2013 cut across all asset size categories (see Table 1). Favorable performance for the subset comprised of banks with assets between $5 and $10 billion (return of 47%), along with the attendant expansion of price/earnings and price/tangible book value multiples, has provided this group a strong currency to undertake merger and acquisition activity in 2014.
Table 1
A strategy of purchasing banks with lower price/tangible book value multiples at year-end 2012 would have served investors well in 2013, as banks with year-end 2012 price/tangible book value multiples of less than 75% outperformed in 2013 (per Table 2). In addition to being potentially more leveraged to improving economic conditions (due to their more fragile asset quality), banks with lower price/tangible book value multiples benefited from greater M&A activity, more open capital markets, and investors’ desire for higher “beta” securities.
Table 2
Perhaps the most meaningful demarcation between the winners and lesser winners is evident in revenue or loan growth rates. As indicated in Tables 3 and 4, total returns exceeded 40% only for the subset of banks with revenue growth exceeding 5% between the September 30, 2013 year-to-date period and the comparable prior year-to-date period.
Table 3
Table 4
Several of the top performing banks in 2013 were active acquirers during the year. However, it was difficult to ascertain a relationship between acquisition activity and market returns, as suggested by Table 5. Thus, it remains incumbent on acquirers to maintain pricing discipline, such as by using their higher pricing multiple stocks to acquire smaller banks at lower multiples, and/or to demonstrate how the acquisition would benefit the acquirer’s profitability growth.
Table 5
In recent prior years, market returns often were correlated with non-performing asset ratios or changes in NPA ratios. This trend was less evident in 2013, as the winners included banks with NPAs less than 1% or greater than 10% of loans and other real estate owned.
Table 6
2014 Outlook
Market prognosticators are not predicting a reprise of 2013’s performance in 2014. In fact, returns comparable to 2013 would cause price/earnings multiples materially to exceed historical averages, without accelerating earnings growth. Analysts’ EPS estimates available at year-end 2013 suggest growth on the order of 7% in fiscal 2014, with improvement to 11% in fiscal 2015. In addition, consensus estimates for the S&P 500 index predict appreciation on the order of 5% to 6%. These estimates appear consistent with lower, but still positive, returns in 2013.
Potential challenges in 2014 include:
- An evolution in the market’s perception towards a belief that banks do not deserve the widening multiples experienced in 2014, due to the profitability pressures or diminished growth outlooks.
Margin pressure from the continued low interest rate environment, especially if loan growth does not improve. - Fewer opportunities to materially reduce credit-related costs, which banks have been able to leverage in recent years to report better profitability in the face of sluggish revenue growth.
- As noted in this article, accommodative Fed policy contributed to rising asset values in general and bank stock prices in particular. This occurred even with sluggish revenue growth trends in the industry, which are, in part, related to margin pressures caused by the same Fed policies. A tighter Fed policy, while perhaps providing some relief from margin contraction, may exert a drag on asset valuations. Thus, and somewhat ironically, higher revenue growth in the industry may not be correlated with better market performance of publicly traded banks.
- A scenario also exists whereby rising M&A activity fuels further stock price appreciation, if the market views the acquisitions as accretive to shareholder value.
Conclusion
Mercer Capital assists banks, thrifts, credit unions, and other depository institutions with significant corporate valuation requirements, transactional advisory services, and other strategic decisions. We pair analytical rigor with industry knowledge to deliver unique insight into issues facing depositories. To discuss a transaction or valuation issue in confidence, please contact us.
