Since Bank Watch’s last review of net interest margin (“NIM”) trends in July 2016, the Federal Open Market Committee has raised the federal funds rate eight times after what was then the first rate hike (December 2015) since mid2006. With the past two years of rate hikes and current pause in Fed actions, it’s a good vantage point to look at the effect of interest rate movements on the NIM of small and large community banks (defined as banks with $100 million to $1 billion of assets and $1 billion to $10 billion of assets).
As shown in Figure 1, NIMs crashed in the immediate aftermath of the financial crisis, primarily because asset yields fell much quicker than banks could reprice term deposits. NIMs subsequently rebounded as the asset refinancing wave subsided while banks were able to lower deposit rates. A several year period then occurred in which asset yields grinded lower at a time when deposit rates could not be reduced. This period was particularly tough for commercial banks with a high level of non-interest bearing deposits.
Since rate hikes started, the NIM for both small and large community banks have increased about 20bps through year-end 2018 before experiencing some pressure in early 2019. The nine hikes by the Fed to a target funds rate of 2.25% to 2.50% amounts to a 225bps increase.

At first pass, the expansion in the NIMs is less than might be expected; however, there are always a number of factors in bank balance sheets that will impact the NIM, including:
Recent incremental pressure on NIMs notwithstanding, community banks’ balance sheets were poised to take advantage of rising rates the past several years. The outperformance of bank stocks beginning in November 2016 reflected several factors, including an economic and regulatory backdrop that would allow the Fed to raise rates further and faster, and thereby support NIM expansion.
The underperformance of bank stocks since last fall reflects investor concern that this tailwind is ending in addition to more general concerns about what a possible economic slowdown implies for credit costs. Telltale signs include the inversion of the Treasury yield curve and yields on the two-year and five-year Treasuries that, as of the date of the drafting of this article, are below the low-end of the Fed Funds target range.
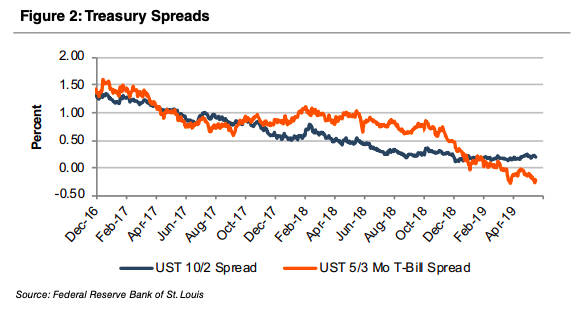
Also, the spot and forward curves for 30-day Libor imply the Fed will cut the Funds target rate and other short-term policy rates one or two times by early 2020 (or stated differently, the December rate hike was a mistake).

The Federal Funds rate, the predominant influence on short-term interest rates, has remained unchanged since year-end 2018 at a target range of 2.25%–2.50% due to concerns about lower inflation figures and what they may forewarn about future economic growth as reflected in falling U.S. Treasury yields. The FOMC reiterated its wait-and-see approach on May 1. However, the sand appears to be shifting beneath the Fed’s feet.
The Wall Street Journal’s most recent Economic Forecasting Survey revealed an increasing belief that the Fed’s next move will be to cut rates. 51% of respondents said that a rate cut would be the next move, up from 44% in April. 25.5% replied that the next rate raise would occur in 2020 or later. Fed officials have maintained their stance that a rate move in either direction will not occur soon.
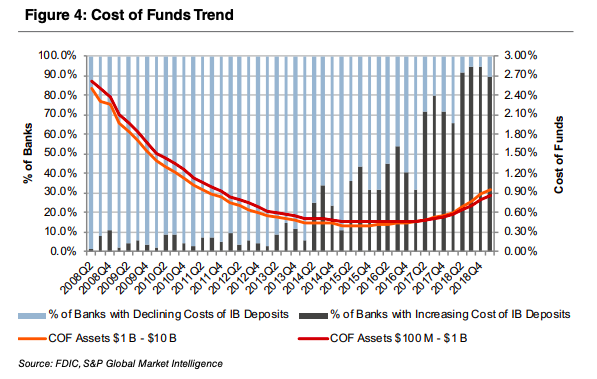
As deposit costs initially lagged, but more recently moved with short-term interest rate hikes, the composition of a bank’s deposit base and funding structure has become increasingly important. As shown in Figure 4, the percentage of banks experiencing a rising cost of interest bearing deposits has steadily increased. Total funding costs have nearly doubled since year-end 2016 as depositors have reoriented funds toward accounts offering higher rates. Banks searching for funding either must engage in intense deposit competition or tap into higher-cost sources such as wholesale funding.
Going forward community banks may face a modest reduction in NIMs because the yield curve is flat and the cost of incremental funding is expensive. Some community banks will choose to slow loan growth in order to protect margins; others will accept a lower margin. The predicament demonstrates yet again why deposit franchises are a key consideration for acquirers as banks with low cost deposit franchises and excess liquidity are particularly attractive in the current market.
Originally published in Bank Watch, May 2019.