2007: A Year to Forget for Banks
As the world celebrated the closing of another year on December 31, many bankers hoped to soon forget one of the worst periods for bank stock performance in recent history. Credit quality concerns, margin pressure, slowing earnings growth, and a declining housing market took a toll on the market for shares of publicly traded banks, which generally underperformed broader market indices such as the S&P 500 for the year. Seemingly, no public bank was left untouched by the effects of the subprime market collapse and subsequent credit market disruptions; Bank of America and Citigroup, the two largest banking institutions in the U.S., saw price declines of 22.7% and 47.2%, respectively, from year-end 2006 to year-end 2007.
But how has the market affected community banks? Mercer Capital observed two asset size-based bank indices – banks with assets between $1 billion and $5 billion, and banks with assets between $500 million and $1 billion – to gauge the impact of the 2007 financial institution market trends on smaller institutions.
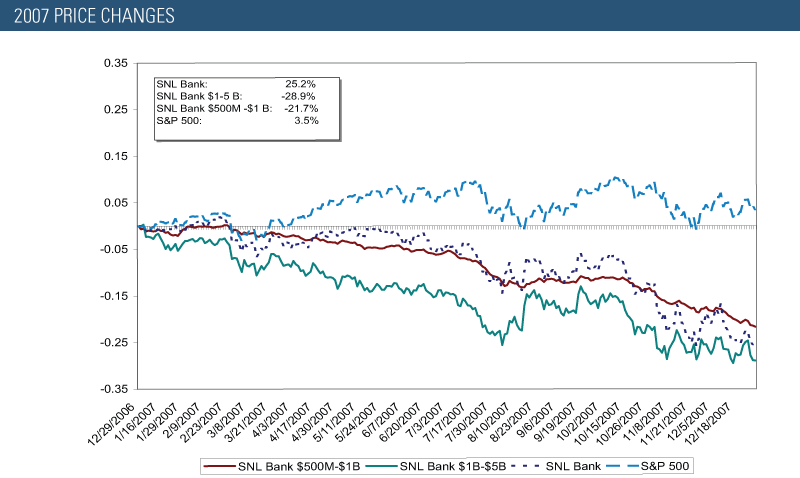
As shown in Figure One, the larger group of banks with assets greater than $1 billion and less than $5 billion felt a more severe impact than the banking industry overall (as measured by the performance of the SNL Bank index) with a year-over-year price decline of 28.9%, reflecting the worst performance observed over the past ten years. For comparison purposes, the SNL Bank index exhibited a decline of 25.2%, while the S&P 500 saw a slight increase of 3.5% for the same period. The unfavorable performance of the larger index was fairly widespread, with 97% (158 out of 163) of the banks reporting price declines in 2007. More than half of the group experienced larger declines than the SNL Bank index overall. Of the five banks with an increase in stock price from 2006 to 2007, four were either targets in a merger or acquisition or the subject of strong takeover speculation.
Public banks with assets between $500 million and $1 billion fared somewhat better, with an overall decline of 21.7%; however, the price decline observed for these banks also reflected the most unfavorable performance in the last decade. Of the 102 banks included in the group, 84% saw declining prices in 2007, with 42% reporting price declines greater than that observed for the SNL Bank index.
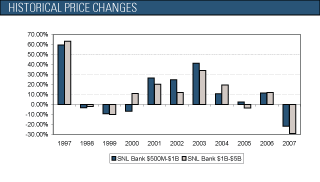
Figure Two reflects the historical trend in market performance for the two size-based indices with the 2007 performance notably weaker than 1999, the weakest previous year since 1997. One dollar invested in the larger bank index at the beginning of 1997 would have been worth $3.80 at year-end 2006 but declined to $2.97 at year-end 2007.
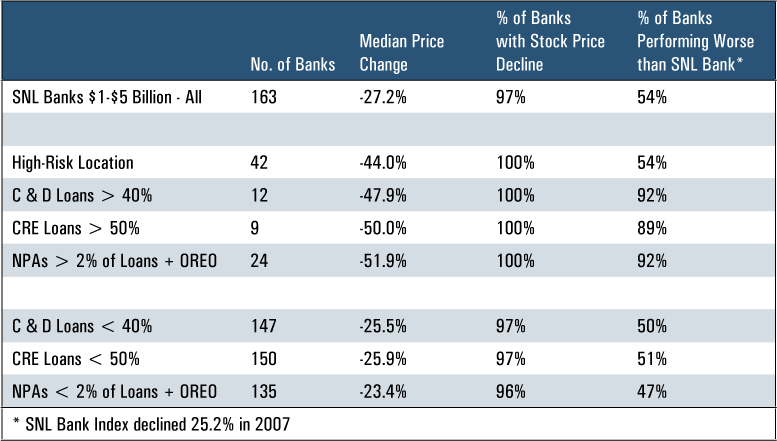
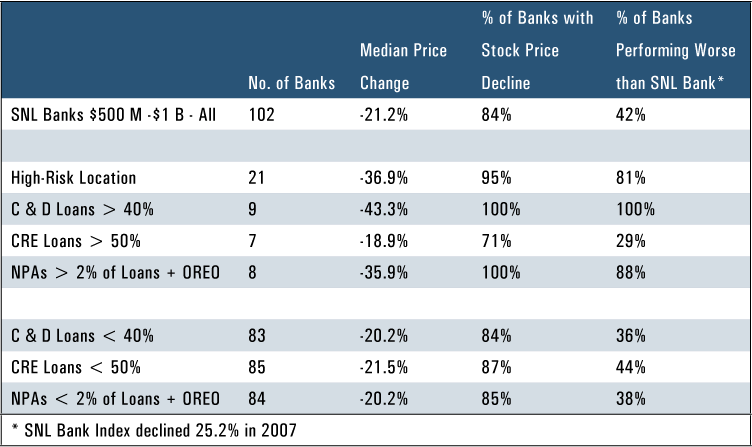
In order to attempt to isolate the driving trends behind the market performance of these institutions in 2007, we stratified the banks in each group based on location, loan portfolio concentrations, and asset quality metrics. Tables One and Two and subsequent discussion summarize our findings.
Location
For the larger index, 42 banks were located in higher-risk markets where home price appreciation skyrocketed during the housing boom and are now experiencing the most rapid real estate market declines (Florida, California, Nevada, Georgia, or Colorado) or markets with a struggling local economy (Michigan). Of these banks, 100% reported price declines with a median decrease of 44%. Results for banks in the smaller index located in the same markets were similar, with 95% of the 21 banks reporting a price decline and a median decrease of 37% for the entire group.
Construction & Development Loans
Twelve of the larger public banks reported construction & development loans accounting for more than 40% of their loan portfolio at September 30, 2007; all of which saw price declines from 2006 and eleven of which underperformed the SNL Bank index. The median price decline for the larger banks with high concentrations of construction and development loans was 48%, substantially above the median for the $1 billion to $5 billion group overall. The remaining banks in the index reporting construction and development credits at less than 40% of total loans experienced a median price decline of 26%.
For the smaller bank index, each of the nine banks reporting C&D loan levels higher than 40% of loans at September 30, 2007 experienced price declines greater than the SNL Bank index and saw a median price decline of 43% for 2007. The median price decline for the remaining banks in the index was 20%.
Commercial Real Estate Loans
Of the 163 banks in the larger index, nine reported commercial real estate loans comprising more than 50% of their entire portfolio at September 30, 2007. Of these banks, eight reported price declines more severe than the overall bank index, with price declines ranging from 21% to 62%. The median price decline for the group was 50%. For comparison purposes, the remaining banks in the index with CRE concentrations less than 50% reported a median price decline of 26%.
CRE concentration observations were less conclusive for the smaller bank index, as the median price decline was less than that observed for the banks with low CRE levels. The pricing disparity may reflect the small number of banks in the index with higher CRE levels, three of which reported price increases apparently reflecting other factors, such as strong asset quality and lower concentrations of riskier construction loans.
Asset Quality
24 of the banks with assets between $1 billion and $5 billion reported non-performing assets measuring greater than 2.00% of loans plus OREO at third quarter-end. Of these banks, 22 (92%) underperformed the SNL Bank index; the median price decline for the group was 52%. The remaining banks with non-performing asset ratios less than 2.00% experienced a median price decline of 23%, with less than half underperforming the SNL Bank index. Eight banks in the smaller index reported non-performing assets greater than 2.00%, seven of which saw a price decline greater than the SNL Bank index. The median price decline for these banks was 36%, as compared to 20% for the remaining banks in the index with stronger asset quality metrics.
The above observations regarding smaller publicly traded banks are consistent with the performance of many community banks throughout the U.S. Those with a significant portion of loans in areas with a rapidly declining housing market, high levels of construction and development or CRE credits, or unfavorable trends in asset quality have been viewed more negatively in public markets than those without such characteristics. Banks in this situation may be more likely to encounter earnings obstacles in the near future as the real estate market and credit issues are resolved.
At the time of publication, most of the banks observed in these studies had not yet released financial data for the fourth quarter. As such information is released, our observations of the stock market performance and financial characteristics of the banks discussed above will be updated and further examined in a future issue of Bank Watch.
Reprinted from Mercer Capital’s Bank Watch, January 2008.


