Last year was a volatile year for credit and equity markets that saw price moves that more typically play out over a couple of years. The year began with a broad-based sell-off in risk assets that got underway in late 2015 due to concerns about the impact of the then Fed intention to raise short-term rates up to four times, widening credit spreads, and a collapse in oil prices. Credit (i.e., leverage loans and high yield debt) and equities rebounded in March and through the second quarter after market participants concluded that media headlines about potentially sub $20 oil were ridiculous and that the Fed probably would not raise rates four times; or, stated differently—the U.S. economy was not headed for recession. Markets staged the second strong rally of the year immediately following the national elections on November 8th with the surprise election of Donald Trump as the next POTUS, and Republicans holding Congress.
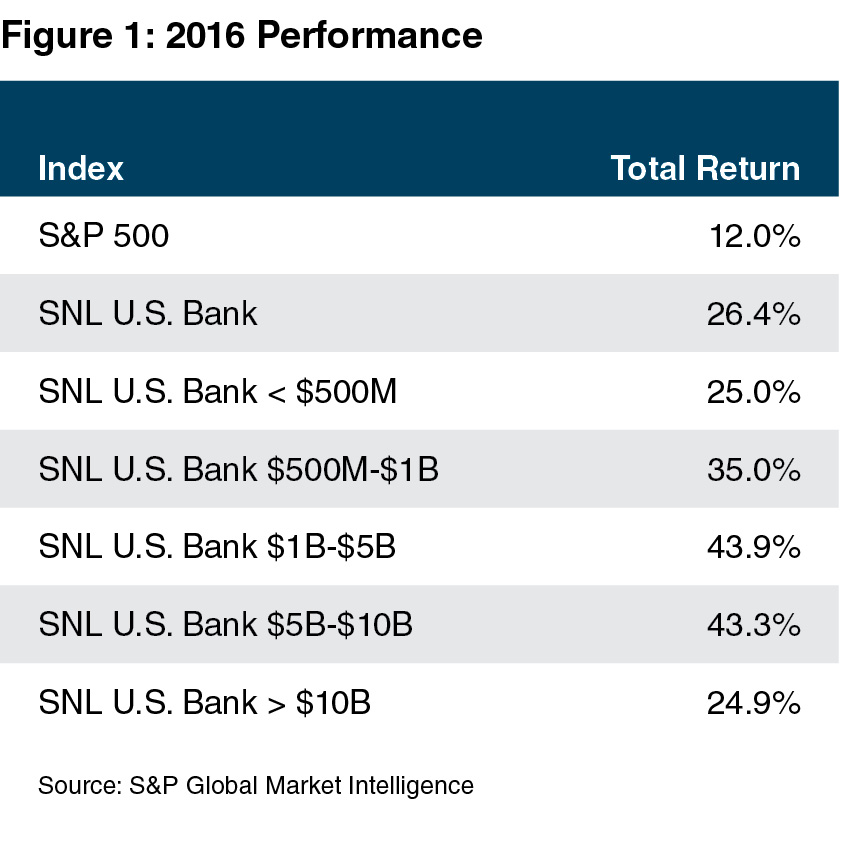
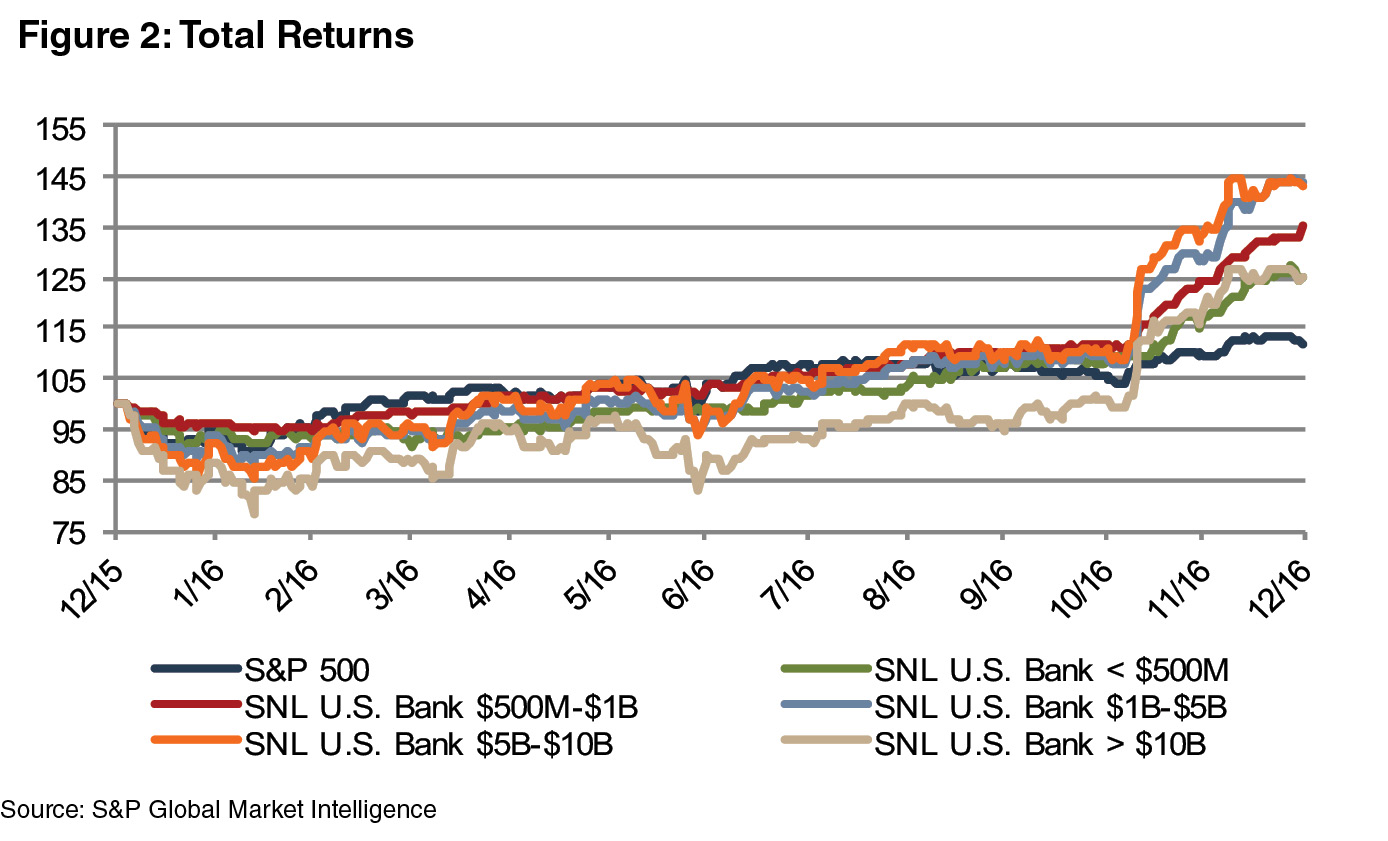
Not surprisingly, the heavily regulated financial sector outperformed the broader market, with bank stocks (as represented by the SNL U.S. Bank Index) gaining 23% versus 5% for the S&P from November 8th through the end of the year. Most of the return for the bank index was realized after the election given the full year total return of 26%. Banks in the $1 to $5 billion and $5 to $10 billion groups led the way in 2016 with total returns on the order of 44% for the year.
The magnitude of the rally in bank stocks was notable because the U.S. economy was not emerging from recession – when bank earnings are near a cyclical trough, poised to turn sharply higher as credit costs fall and loan demand improves.
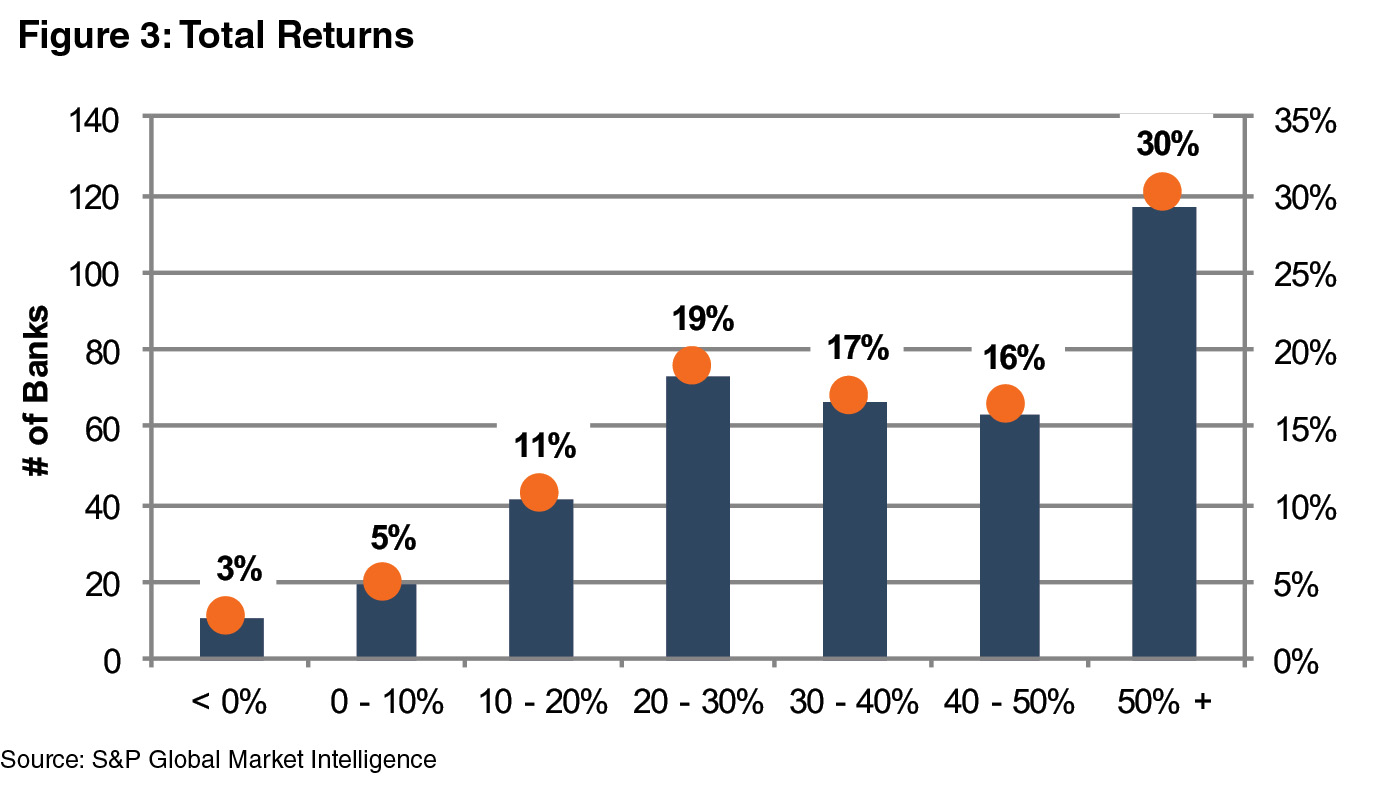
Last year was a great year for most bank stock investors. Bank returns averaged around 40% in 2016, with 30% of the U.S. banks analyzed (traded on the NASDAQ, NYSE, or NYSE Market exchanges for the full year) realizing total returns greater than 50%. The returns reflected three factors: earnings growth, dividends (or share repurchases that were accretive to EPS), and multiple expansion.
As shown in Figure 4, the median P/E for publicly-traded banks expanded about 30% to 20.6x trailing 12-month earnings at year-end from 15.9x at year-end 2015. Likewise, the median P/TBV multiple expanded to 181% from 140%. While bank stocks closed the year at the highest P/E level seen this century, P/TBV multiples remain below the pre-crisis peak given lower ROEs (ROTCEs), which in turn are attributable to higher capital and lower NIMs.
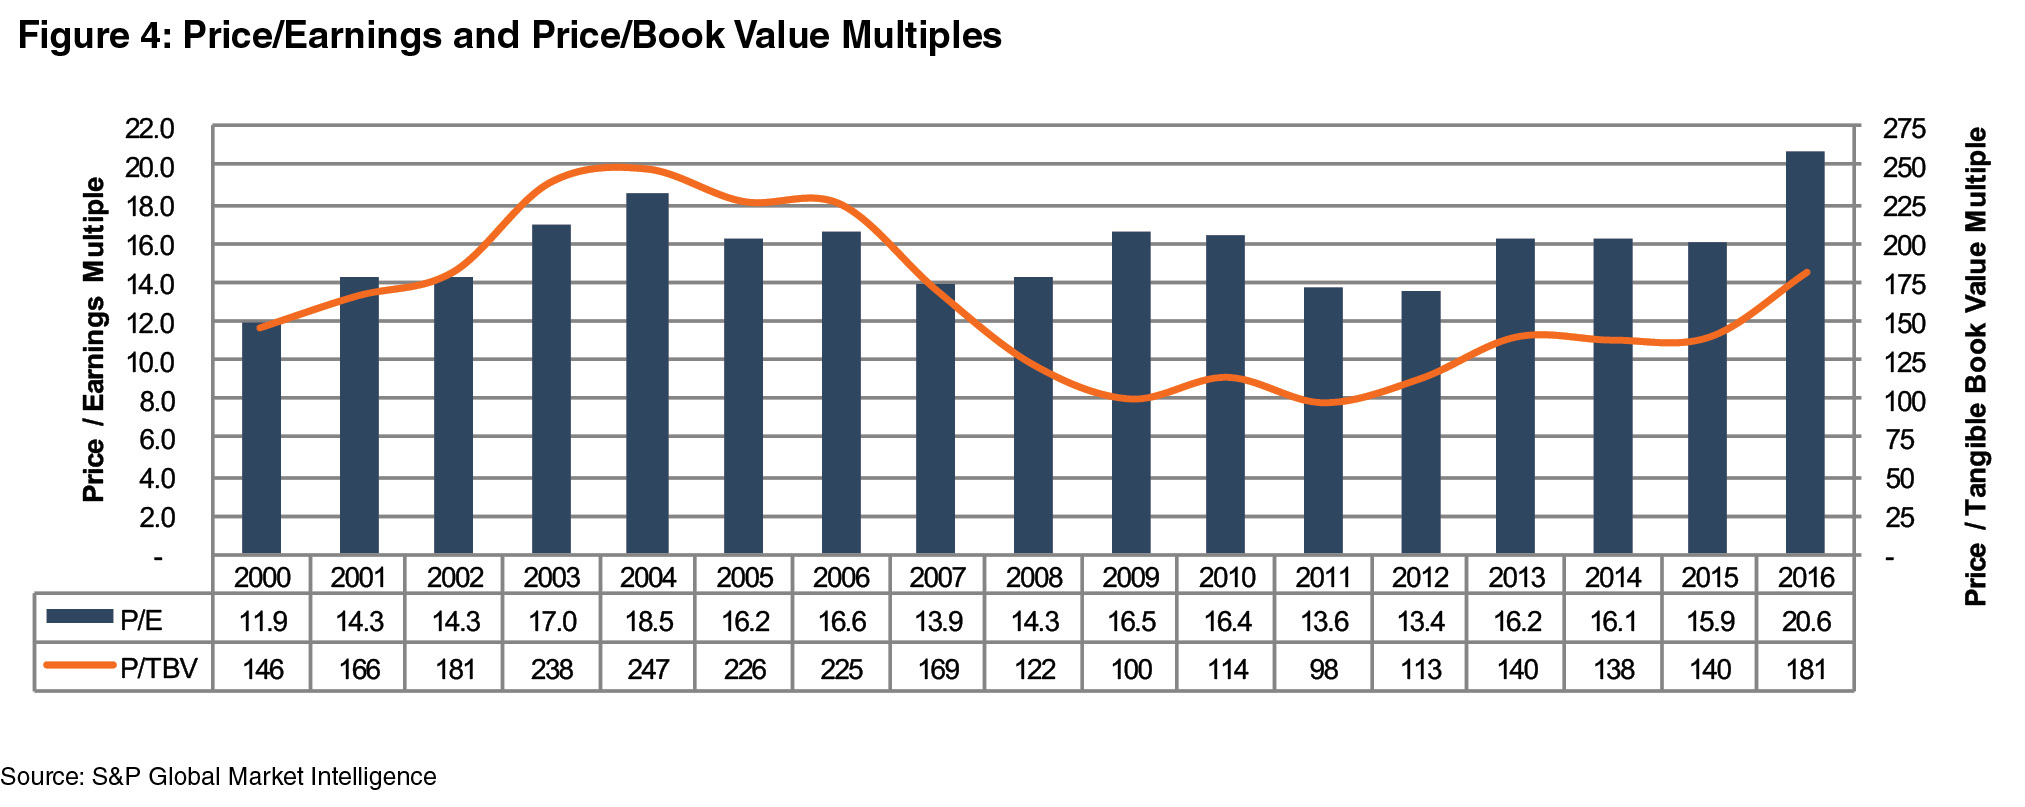
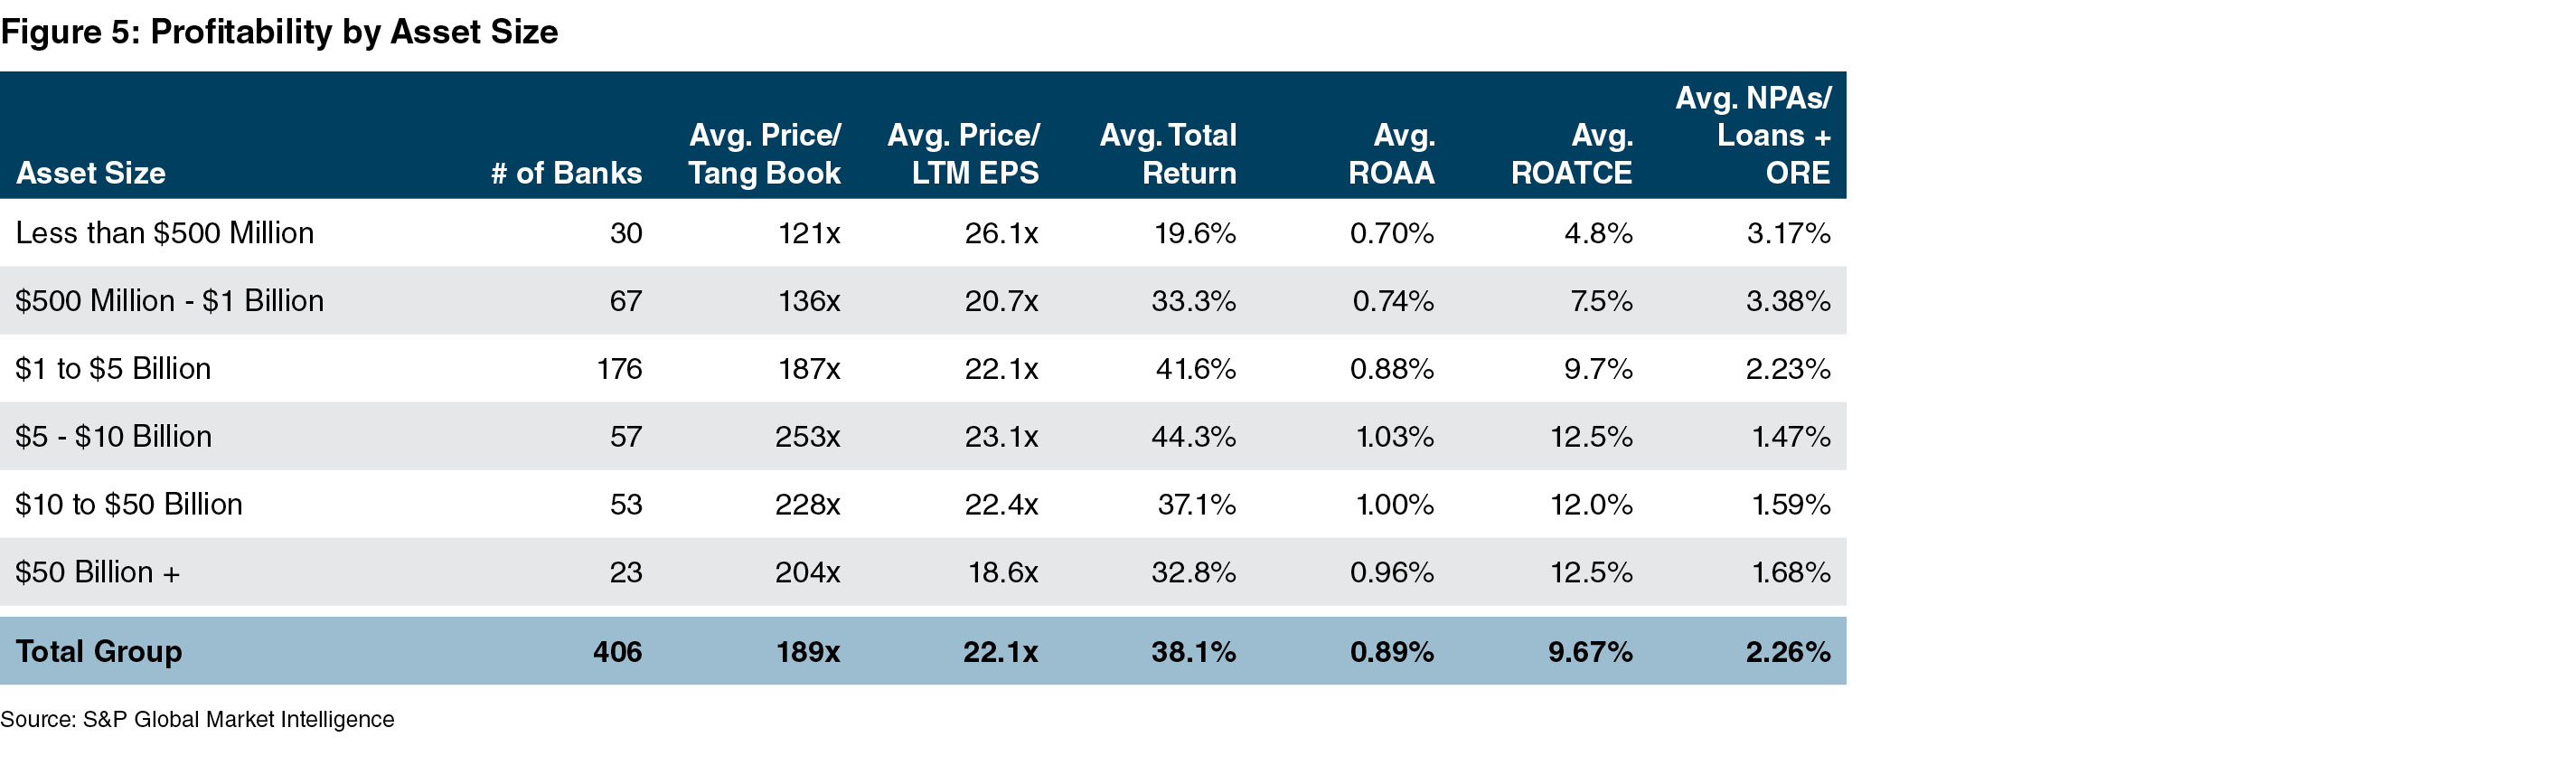
Figure 5 summarizes profitability by asset size. Banks with assets between $5 and $10 billion were the most profitable on an ROA basis and realized the highest total returns for the year. This group stands to benefit the most from regulatory reform if the Dodd-Frank $10 billion threshold (and $50 billion for SIFIs) is raised. In the most optimistic scenario, the market appears to be discounting that banks’ profitability will materially improve with lower tax rates, higher rates, and less regulation. The corollary to this is that the stocks are not as expensive as they appear because forward earnings will be higher provided credit costs remain modest. Based upon our review, most analysts have incorporated lower tax rates into their 2018 estimates, which accounts for much more modest P/Es based upon 2018 consensus estimates compared to 2017 consensus estimates.
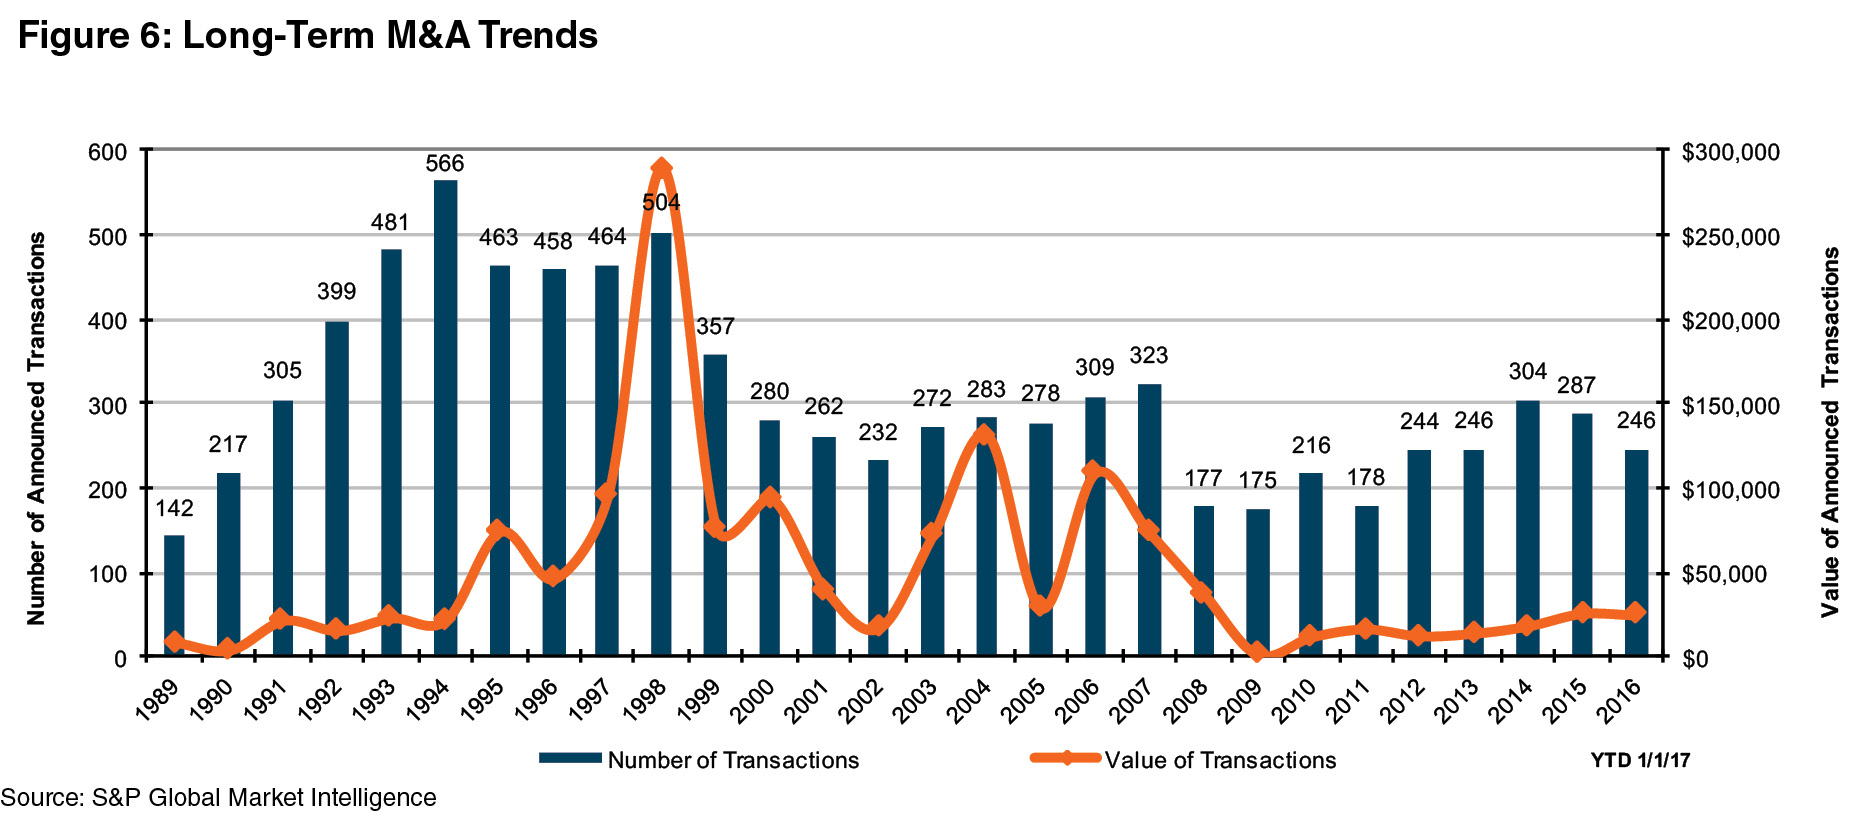
On the surface, 2016 M&A activity eased modestly from 2014 and 2015 levels based upon fewer transactions announced; however, when measured relative to the number of banks and thrifts at the beginning of the year, 2016 was consistent with the long-running trend of 2-4% of institutions being acquired each year. The 246 announced transactions represented 3.8% of the 6,122 chartered institutions at the beginning of the year compared to 4.5% for 2014 and 4.2% for 2015.
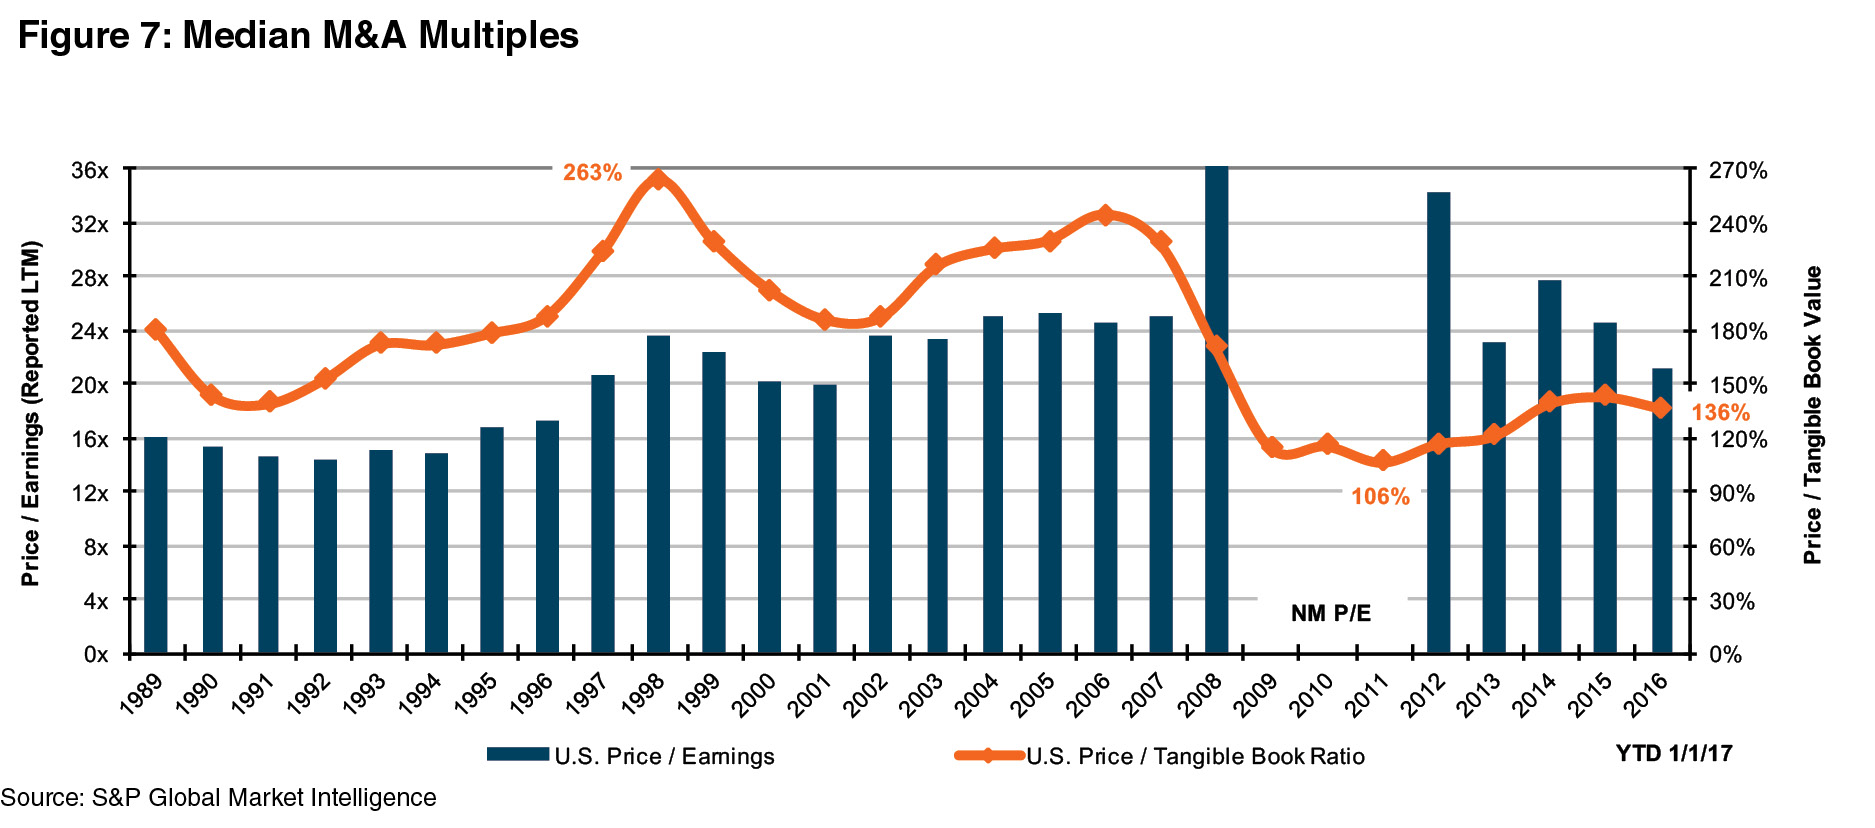
As for pricing, median multiples softened a little bit, but we do not read much into that. Last year, the median P/TBV multiple for transactions in which deal pricing was disclosed eased to 136% compared to 142% in 2015; the median P/E based upon trailing 12 month earnings as reported declined to 21.2x versus 24.4x in 2015.
Elevated public market multiples since the national election have set the stage for higher M&A multiples in 2017 as publicly-traded buyers can “pay” a higher price with elevated share prices (Figure 8). The impact of this was seen among some larger transactions announced after the national election compared to when LOIs were announced earlier in the Fall. Activity may not necessarily pick-up with higher nominal prices, however, if would be sellers decide to wait for higher earnings as a result of anticipated increases in rates and lower taxes and regulations. In effect, some may wait for even better values or decide not to sell because ROEs improve sufficiently to justify remaining independent. Time will tell.
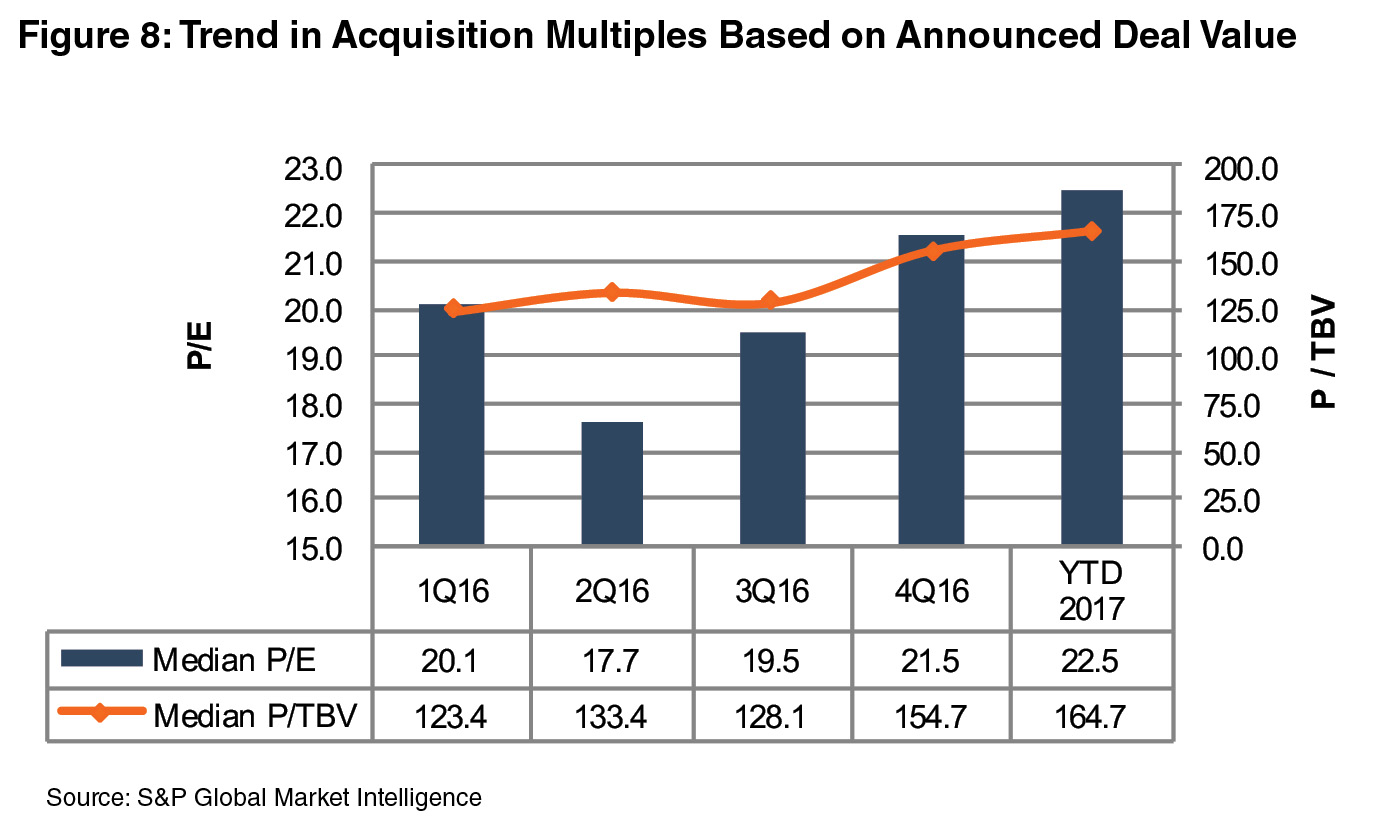
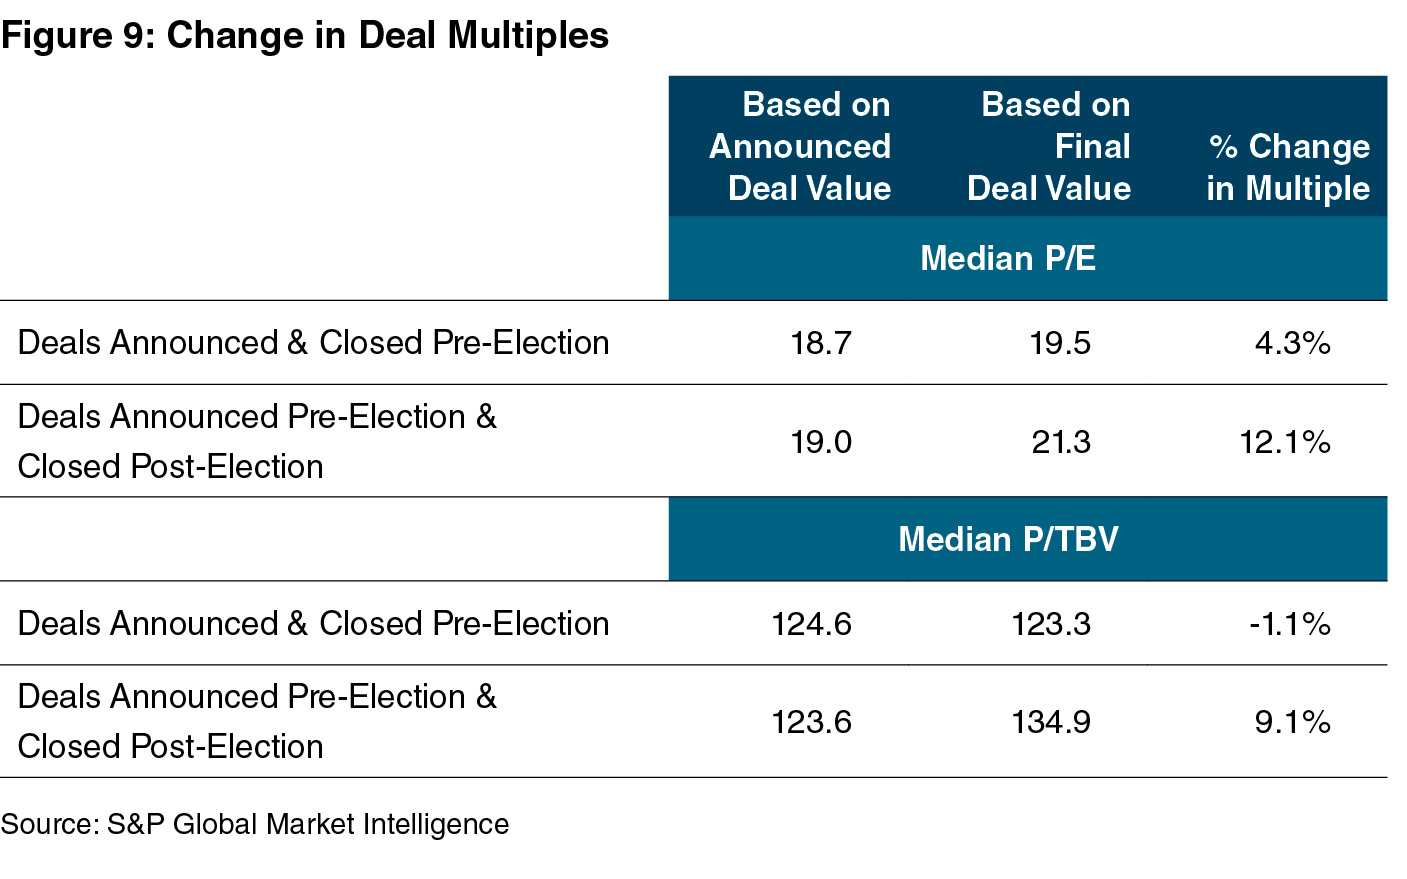
Figure 9 shows the change in deal multiples from announcement to closing and compares the change between deals announced and closed pre-election to those closed post-election. With the run-up in pricing, P/E and P/TBV multiples increased 12% and 9% from announcement to close compared to 4% and a decline of 1% pre-election.
No one knows what the future holds, although one can assess probabilities. An old market saw states “buy the rumor; sell the news” which means stocks move before the expected news comes to pass. As of the date of the drafting of this note (February 7), bank stocks are roughly flat in 2017. The stocks have priced in the likelihood of some roll-back in Dodd-Frank, higher short-term and long-term rates, lower tax rates, and a generally more favorable economic backdrop that supports loan growth and asset quality. The magnitude of these likely – but not preordained – outcomes and the timing are unknown. Following a big rally in 2016, returns for bank stocks may be muted in 2017 even if events in Washington and the Fed prove to be favorable for banks.
That said, higher stock prices and investor demand for reasonable yielding sub-debt from quality issuers implies the M&A market for banks should be solid. The one caveat is that there are fewer banks, so a healthy M&A market for banks could still entail fewer transactions than were recorded in 2016.
Mercer Capital is a national business valuation and financial advisory firm. Financial Institutions are the cornerstone of our practice. To discuss a valuation or transaction issue in confidence, feel free to contact us.
This article originally appeared in Mercer Capital’s Bank Watch, February 2017.