With the Fed positioned to hike the Fed Funds and IOER rates several more times following the September meeting, it is a good time to look at the recent trend in core deposit values. Mercer Capital previously published articles on core deposit trends in 2016 just before the November election, and again in October 2017.
Coming out of the recession, the prolonged low interest rate environment held values of core deposit intangible assets acquired in bank transactions at historical lows. Deposit premiums paid in transactions likewise remained below pre-recession levels. Following the 2016 election, amid expectations of stronger economic growth and rising rates, core deposit values and deposit premiums both saw some modest increases by the fourth quarter of 2017. Three rate hikes by the Fed in 2018 have driven rates sufficiently high that banks are now beginning to price deposits more competitively as liquidity tightens.
Using data compiled by S&P Global Market Intelligence, we analyzed trends in core deposit intangible (CDI) assets recorded in whole bank acquisitions completed from 2000 through August 2018. CDI values represent the value of the depository customer relationships obtained in a bank acquisition. CDI values are driven by many factors, including the “stickiness” of a customer base, the types of deposit accounts assumed, and the cost of the acquired deposit base compared to alternative sources of funding. For our analysis of industry trends in CDI values, we relied on S&P Global Market Intelligence’s definition of core deposits.1 In analyzing core deposit intangible assets for individual acquisitions, however, a more detailed analysis of the deposit base would consider the relative stability of various account types. In general, CDI assets derive most of their value from lower-cost demand deposit accounts, while often significantly less (if not zero) value is ascribed to more rate-sensitive time deposits and public funds, or to non-retail funding sources such as listing service or brokered deposits which are excluded from core deposits when determining the value of a CDI.
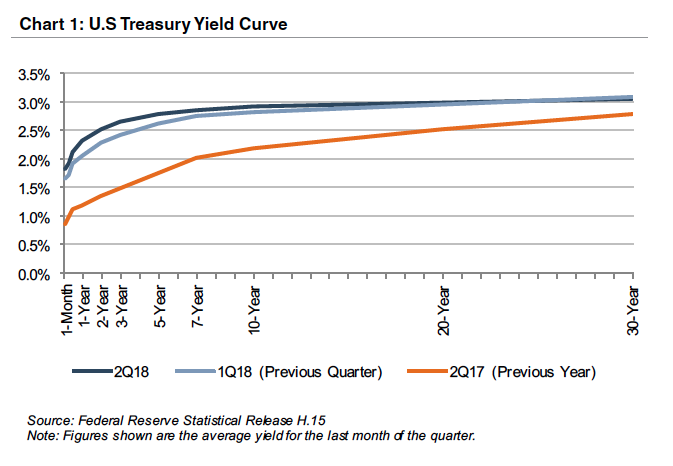
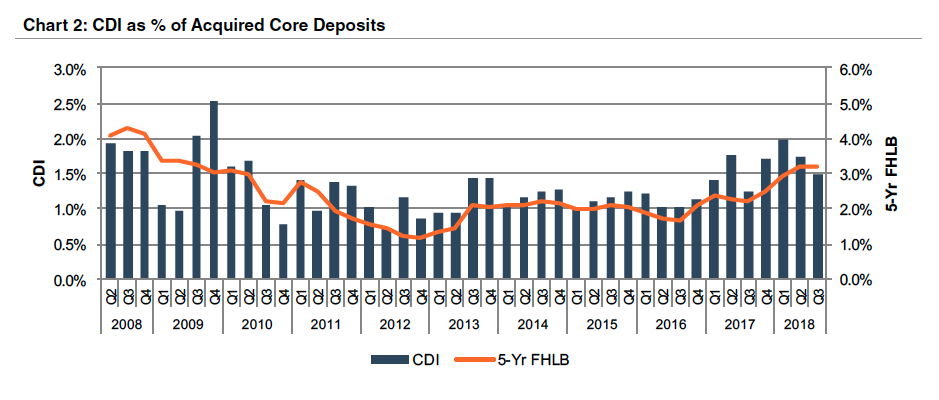
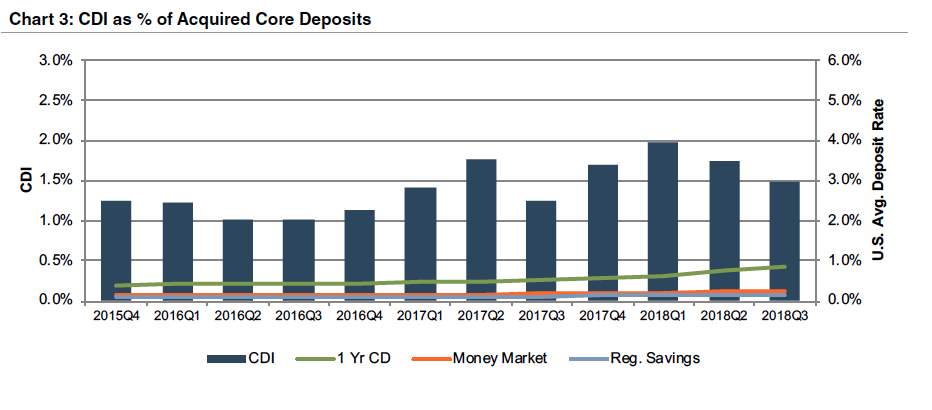
Current CDI values reported in acquisitions remain well below long-term historical average levels, averaging approximately 1.5% in the 2017-2018 timeframe compared to averages in the 2.5%-3.0% range in the early 2000s. Chart 2 summarizes the trend in CDI values since the start of the 2008 recession, compared with rates on 5-year FHLB advances. Over the post-recession period, CDI values have largely followed the general trend in interest rates—as alternative funding has become more costly in recent years, CDI values have generally ticked up as well. However, despite remaining above post-recession average levels, CDI values in the second and third quarters of 2018 (through August) have lagged the broader trend in interest rates with some decline in CDI values observed in these quarters. In addition to a flattening yield curve, some of the easing in CDI values in recent months may result from increasing deposit costs which reduces the value of deposits relative to other funding sources. Despite Fed increases in interest rates since late 2015, deposit costs have lagged the broader trend of rising interest rates (Chart 3).
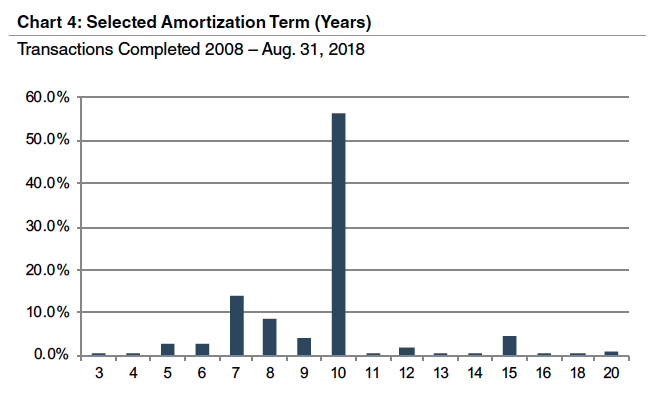
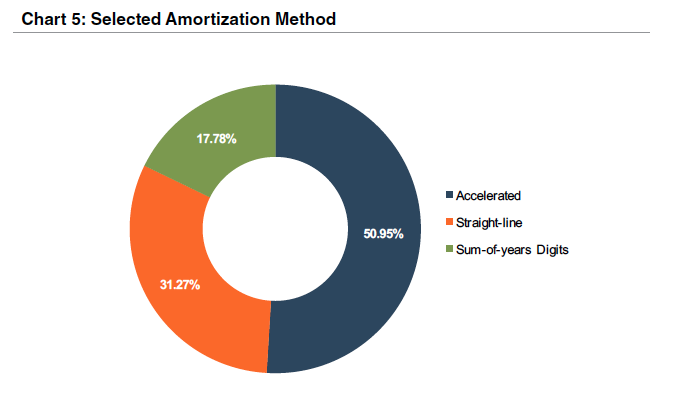
Based on the data for acquisitions for which core deposit intangible detail was reported, a majority of banks selected a ten-year amortization term for the CDI values booked (Chart 4). Less than 10% of transactions for which data was available selected amortization terms longer than ten years. Amortization methods were somewhat more varied, but an accelerated amortization method was selected in approximately half of these transactions (Chart 5).
Core deposit intangible assets are related to, but not identical to, deposit premiums paid in acquisitions. While CDI assets are an intangible asset recorded in acquisitions to capture the value of the customer relationships the deposits represent, deposit premiums paid are a function of the purchase price of an acquisition. Deposit premiums in whole bank acquisitions are computed based on the excess of the purchase price over the target’s tangible book value, as a percentage of the core deposit base. While deposit premiums often capture the value to the acquirer of assuming the established funding source of the core deposit base (that is, the value of the deposit franchise), the purchase price also reflects factors unrelated to the deposit base, such as asset quality in the acquired loan base, unique synergy opportunities anticipated by the acquirer, etc. Additional factors may influence the purchase price to an extent that the calculated deposit premium doesn’t necessarily bear a strong relationship to the value of the core deposit base to the acquirer. This influence is often less relevant in branch transactions where the deposit base is the primary driver of the transaction and the relationship between the purchase price and the deposit base is more direct.
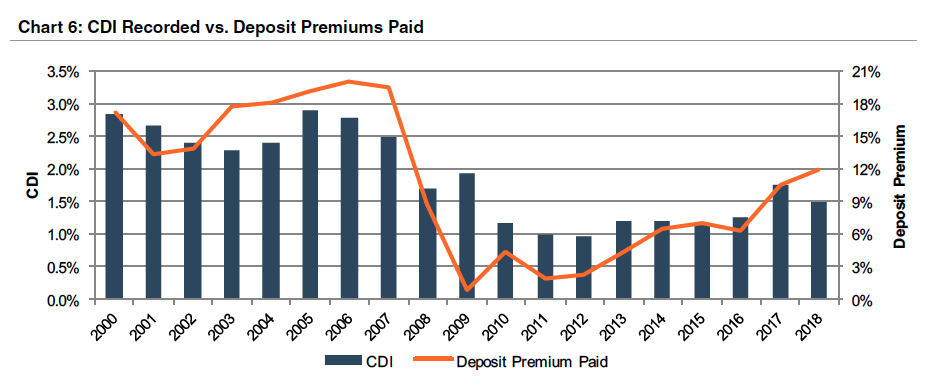
Deposit premiums paid in whole bank acquisitions have shown more volatility than CDI values, rising more substantially in the post-recessionary period and continuing to improve through the year-to-date 2018 period as a result of improvement in deal values. Despite improved deal values, current deposit premiums in the range of 12% remain well below the pre-financial crisis levels when premiums for whole bank acquisitions averaged closer to 20% (Chart 6).
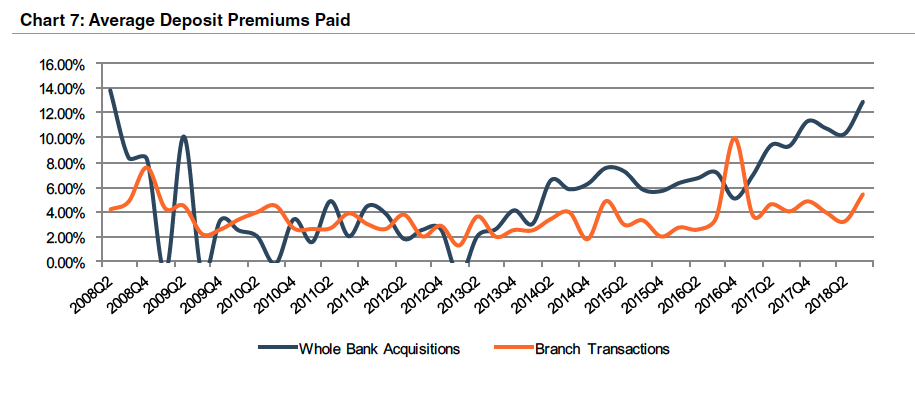
Deposit premiums paid in branch transactions have generally been less volatile than tangible book value premiums paid in whole bank acquisitions. Branch transaction deposit premiums are up from the 2.0-4.0% range observed in the financial crisis, but have remained in the 4.0-5.5% range since 2017, as shown in Chart 7.
For more information about Mercer Capital’s core deposit valuation services, please contact us.
Originally published in Bank Watch, September 2018.
1 S&P Global Market Intelligence defines core deposits as, “Deposits, less time deposit accounts with balances over $100,000 and foreign deposits if available or deposits, less all deposit accounts with balances over $100,000 and foreign deposits.”


