Basics of Financial Statement Analysis
Part 2: The Income Statement
This post is the second of four installments from our Basics of Financial Statement Analysis whitepaper. In this series of posts, our goal is to help readers develop an understanding of the basic contours of the three principal financial statements. The balance sheet, income statement, and statement of cash flows are each indispensable components of the “story” that the financial statements tell about a company.
If the balance sheet is a photograph, the income statement is a movie. It summarizes the activity of a business over a period of time. Whereas the balance sheet caption is “as of” a particular date, the caption for the income statement reads “for the period ending” on a particular date. As its name suggests, the income statement summarizes the revenues, expenses, and resulting income for the company during a particular period.
Principal Income Statement Components
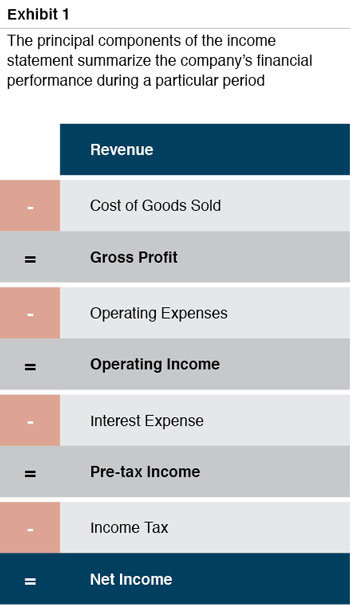
Exhibit 1 summarizes the basic flow of the income statement. We will walk through each of the principal components in turn.
Revenue
The concept of revenue is intuitive. It is the amount received from customers in exchange for the goods or services provided by the company. Analysis of revenue should focus on change over time. For many businesses, it may be possible to analyze revenue as the product of some measure of volume sold and effective pricing. Doing so allows the analyst to more clearly evaluate the underlying changes in revenue (i.e., is revenue increasing due to volume growth or higher prices). When looking at revenue over time, the goal should be to identify why revenue has been stable, grown, or decreased. These factors will not be enumerated on the face of the income statement, but the overall trends should prompt further investigation to fill out the narrative more clearly. Ultimately, revenue growth (or decreases) can be traced back to some combination of a few potential factors.
- Increasing volume with existing retained customers. Does the company have a base of recurring customers that generate revenue each year? If so, the company may piggyback on the growth of its existing customers. If the market for the company’s goods and services is growing, is the company gaining or losing share in relevant markets? If so, why?
- Volume from new customers is greater than lost volume from customer attrition. Some amount of customer churn is to be expected. Even satisfied, enthusiastic customers are occasionally acquired by non-customers or go out of business. If some degree of churn is inevitable, the company will need to identify and cultivate new customers to take the place of lost customers. What are the trends in customer attrition? Why do existing customers leave, and why do new customers start doing business with the company?
- Sales of new products/services in excess of sales from obsolete products/services. Whether because of technological advances or other factors, the company’s existing portfolio of products and services may eventually become obsolete. Is the company developing new products or services to take the place of such products? If so, do the new offerings appeal primarily to existing customers or to those who have not historically been prospects?
- Price increases. Regular price increases are an often-overlooked source of potential revenue growth. Does the competitive environment permit the company to increase pricing on a regular and predictable basis? If price increases are not feasible, is the company’s production efficiency increasing?
Cost of Goods Sold & Gross Profit
Cost of goods sold (“COGS” for short) is easiest to understand for a retailer or wholesaler, for whom the cost of goods sold is simply the amount paid for the inventory that is then sold to the company’s customers. For a manufacturer, COGS is the sum of the raw materials, direct labor, and production overhead incurred to manufacture the company’s products. Many service companies do not report a distinct cost of goods sold on the income statement.
The excess of revenue over cost of goods sold is gross profit. For the purpose of reading and understanding financial statements, gross profit is generally a more enlightening point of analysis than cost of goods sold. Gross profit represents the amount available to pay for the company’s operating expenses and generate operating income. Analysts will generally compute a company’s gross margin by dividing gross profit into revenue. Gross margin is therefore a measure of gross profit per dollar of revenue. Calculating gross margin facilitates comparisons of the subject company’s performance over time and relative to peers.
Calculating gross margin facilitates comparisons of the subject company’s performance over time and relative to peers.
When analyzing gross margin for the subject company over time, the reader of the income statement should attempt to reconcile observed changes to competitive factors facing the business. If the company’s production inputs include raw materials subject to price volatility, can it adjust prices in response to the changing input prices, or does gross margin fluctuate? Does the company engage in hedging activities to reduce volatility? If gross margins are contracting over time, it may be a result of pricing pressure from low-cost competitors. Conversely, if gross margins are expanding, that may suggest that the company has pricing power due to some competitive advantage relative to competitors or suppliers.
Comparing gross margins to those of peers can reveal differences in strategy among firms. A company focused on product differentiation would generally expect to report gross margins in excess of their peers, while one focused on cost advantages may be willing to accept a lower gross margin in the expectation that operating expenses will be lower.
Operating Expenses & Operating Income
Operating expenses include those costs incurred to support the sales & marketing, administration, and research & development activities of the company. These overhead activities are incurred to both service existing customers and to promote the company’s growth through acquiring new customers and developing new products. Deducting operating expenses from gross profit yields operating income. As with gross profit, operating income is best analyzed relative to revenue (i.e., operating margin).
Operating income (also referred to as EBIT, or earnings before interest and taxes) is an important point of comparison to other firms because it is the lowest level of earnings that is unaffected by sources of financing. In other words, a company’s operating margin reflects the efficiency with which it converts revenue to profits before taking interest expense into account.
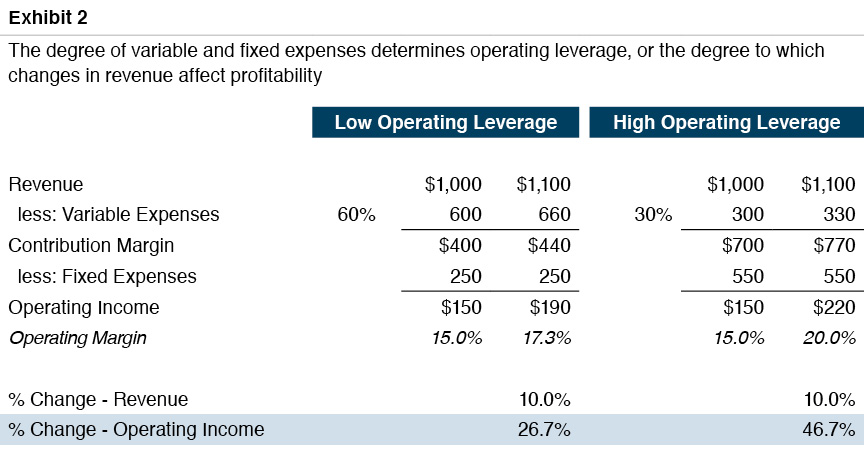
Income statements presented in accordance with generally accepted accounting principles (GAAP) do not classify expenses as fixed or variable, even though doing so can be very helpful. Broadly speaking, variable expenses fluctuate with revenue, while fixed expenses remain unchanged over a fairly wide range of revenue levels. Companies with a greater proportion of fixed expenses are said to have operating leverage, meaning that a given change in revenue will have a greater impact on operating income. Exhibit 2 illustrates the concept of operating leverage.
Both companies in Exhibit 2 generate the same base revenue and operating profit. However, most of the expenses for the company on the left are variable, while those for the company on the right are predominately fixed. While revenue for both companies increased by 10%, the company on the right experienced a more substantial increase in profitability. A few observations are in order:
- First, all companies have some degree of operating leverage. To the extent the company has any fixed costs, changes in revenue will trigger disproportionate changes in profitability. So the real question is not whether a company has operating leverage, but rather the degree to which it has operating leverage.
- Second, an emphasis on scenarios in which revenue is increasing might suggest that operating leverage is inherently good. Yet, that perspective needs to be balanced by the very real possibility that revenue could decline, in which case the company with a greater degree of operating leverage will experience a disproportionate decrease in profitability. Stated alternatively, the company with less operating leverage also has a lower breakeven point. For example, the company on the left in Exhibit 2 breaks even with revenue of $625, while the company on the right would lose $113 at that level of revenue.
- Finally, the distinction between variable and fixed expenses is imprecise and fluid. The longer the planning horizon, the more variable a company’s cost structure is. Even over a specified time period, whether a given cost is truly variable or fixed is a matter of some interpretation. Yet, the ultimate purpose of such analysis is not absolute precision, but rather a conceptual framework for evaluating strategy and a broad measure of the effect of changing revenue on profitability.
Interest Expense & Pre-tax Income
Shareholders receive current returns in the form of dividends, and lenders receive current returns in the form of interest payments. Although conceptually equivalent (both are returns to capital providers), interest payments are recorded as expense on the income statement, while dividends paid to shareholders are not.
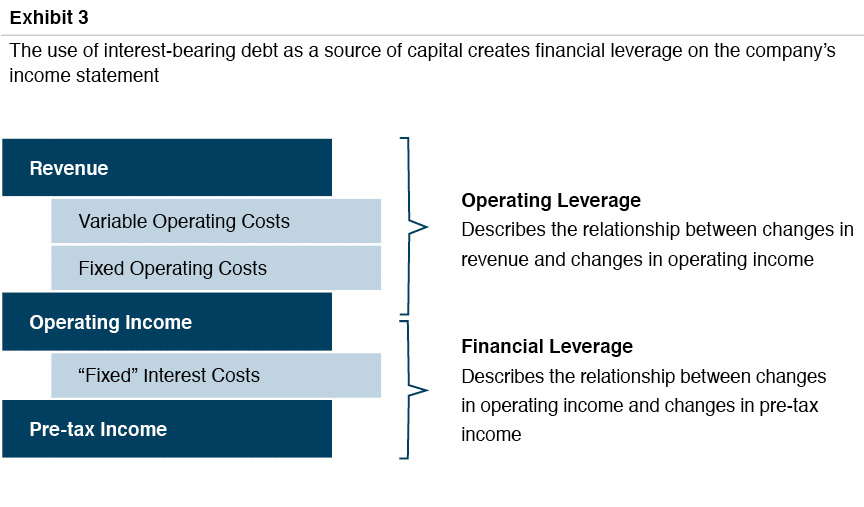
The amount of interest expense incurred during the period is the product of the average interest-bearing debt balance outstanding during the period and the effective interest rate on the debt. The rate on debt can be either fixed at a set rate for the duration of the instrument, or it may float with reference to a market rate, like LIBOR. In either case, the amount of interest expense is not correlated with the amount of revenue or operating income generated by the company during the period. In other words, even floating-rate interest constitutes a “fixed” cost. Whereas operating leverage describes the change in operating income relative to a given change in revenue, financial leverage describes the change in pre-tax income relative to a given change in operating income. As with operating leverage, financial leverage magnifies both upside and downside returns.
Experienced readers of financial statements will correlate interest expense on the income statement to the balance of interest-bearing debt on the balance sheet. This check helps confirm the emerging narrative the financial statements are telling about the company and illustrates how the financial statements are related to one another.
Income Taxes & Net Income
The final deduction in calculating net income is income tax expense. The first consideration in analyzing income tax expense is the tax structure of the company. Many privately-held family businesses are organized as S corporations or limited liability companies, both of which “pass-through” taxable income to the shareholders. As a result, such companies neither pay income taxes nor report income tax expense. From a cash flow standpoint, however, these companies almost always distribute cash in an amount that would otherwise be reported as income tax expense to fund the income tax liability that accrues to shareholders personally.
For taxable entities, income tax expense will ordinarily be proportionate to the reported pre-tax income. In other words, income taxes are perfectly variable with respect to pre-tax income – if the effective tax rate in the relevant jurisdiction is 40%, income tax expense will be equal to 40% of pre-tax income.
From a somewhat broader conceptual perspective, net income is the change in shareholders’ equity during the period resulting from the operations of the business.
One complicating factor that need not detain us too long here is that the IRS does not use GAAP to calculate taxable income. As a result, the amount of income that the company actually pays tax on during a given year may not match the amount of pre-tax income reported on the company’s financial statements. These differences often relate to different timing assumptions regarding when certain items of revenue or expense are recognized. Eventually, such differences will reverse themselves. If GAAP income exceeds taxable income, income tax expense will be based on the higher GAAP earnings, and the difference between income tax expense and taxes actually due is recorded as a deferred tax liability on the balance sheet. If GAAP income is less than taxable income, income tax expense will still be based on the lower GAAP earnings, but the excess of taxes actually due over income tax expense is recorded as a deferred tax asset on the balance sheet.
Net income is the difference between revenue and all expenses. From a somewhat broader conceptual perspective, net income is the change in shareholders’ equity during the period resulting from the operations of the business. This conceptual definition of net income is consistent with the reconciliation of shareholders’ equity summarized in Exhibit 5 in a previous post.
Earnings per Share
For public companies, earnings are expressed on a per share basis. While per share earnings are a less common expression for private companies, the underlying concept remains valid. If the reported earnings are not scaled to the number of shares outstanding, it can be difficult to assess whether earnings growth generated by investments funded through the issuance of new shares has been economically accretive or dilutive. Expressing earnings on a per share basis is also important when evaluating the effect of potentially-dilutive equity-based compensation on shareholders.
Normalizing Adjustments
Our discussion thus far has assumed a very “clean” income statement. Income statements for real companies are often a bit messier and include items such as gains and losses on the sale of assets, currency gains and losses, the results of discontinued operations, extraordinary charges due to changes in accounting principles, and other non-operating sources of income and expense. Consistent with the broad conceptual definition of net income noted in the previous section, the inclusion of such items is entirely appropriate, as these items do have a very real effect on shareholders’ equity.
On the other hand, one common purpose of income statement analysis is to discern the earning potential of the company on a prospective basis. For this purpose, it is entirely appropriate to make “normalizing” adjustments to the reported income statement. Such adjustments are used to convert the income statement from one that is backward-looking to one that is forward-looking. Normalizing adjustments will fall into one of the following three broad categories:
- Clean up unusual or non-recurring events. The most obvious adjustments are those that remove the effect of unusual or non-recurring events, such as losses due to unusual weather events, large recoveries in litigation, or unusual transaction costs that obscure the true earning power of the business. One should be wary, however, if management labels every roadbump that the company encounters as “non-recurring” while assuming that every bit of good fortune represents ongoing earning power. A series of annual, non-recurring losses begins to look like a recurring feature of the business. The goal is to normalize earnings, not sanitize them.
- Remove the effect of discontinued lines of business. Business lines come, and business lines go. To get a clean view of the future prospects of the business, the results of discarded business lines should be excised from the reported income statement. If the discontinued business was profitable, removal will reduce normalized earnings, and vice versa. While sales and cost of goods sold can generally be readily identified, associated operating expenses may be more difficult to estimate. If too much of the expense base is allocated to the discontinued business, earning power will be overstated.
- Add the impact of recently acquired businesses. For an acquisition made during the fiscal year, the reported earnings of the acquirer will not reflect the full impact of the acquisition on earning power. For example, if the legacy business generates earnings of $10 million, and the business acquired mid-year earns $5 million annually, reported earnings for the year will be $12.5 million. Adjusting reported earnings to reflect a full year of operations for the acquired business will result in a more accurate view of “run rate” earnings. For acquisitive businesses, these adjustments can be significant. Ultimately, such adjustments are appropriate to the degree they accurately reflect the earnings contribution of the acquired business.
In short, earnings adjustments are an appropriate element of financial statement analysis, but the proposed adjustments should be carefully scrutinized to ensure that they do not distort the true earning power of the company.
Excursus: EBITDA
The most commonly cited measure of earnings for private companies is EBITDA, or Earnings Before Interest, Taxes, Depreciation, and Amortization. EBITDA is an example of a non-GAAP measure of financial performance since it does not appear on the face of most income statements. It is, however, readily calculated by simply following the components of its perfectly descriptive name. When management teams and others focus on adjusted EBITDA, it is important to have a clear reconciliation identifying the normalizing adjustments that were included in the calculation.
Why do investors and managers focus on EBITDA? There are essentially two reasons. First, EBITDA is the broadest measure of earnings and cash flow for the firm. As depicted in Exhibit 4, EBITDA is a proxy for the cash flow that is available for a variety of purposes. It is therefore, in one sense, a measure of the discretionary cash flow available to a potential acquirer of the business as a whole, which explains why it is the performance metric of choice for describing and assessing merger and acquisition activity.
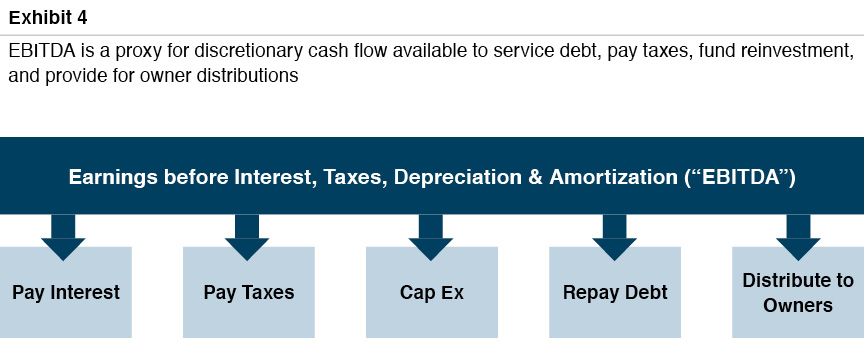
Second, referencing EBITDA promotes comparability across firms. Working up from the bottom of the income statement, EBITDA provides the most consistent measure of relative operating performance of different companies by “normalizing” for structural features of how different companies are organized, financed, and assembled.
- Income Taxes. As discussed previously, many private companies are organized as tax pass-through entities and therefore report no income tax expense on the income statement. Since EBITDA is calculated without regard to income taxes, C corporations and S corporations are on equal footing.
- Interest Expense. The decision to finance operations with debt rather than equity does not directly affect the operating performance of the business. Since EBITDA is calculated without regard to interest expense, the operating performance of highly leveraged companies can be readily compared to that of companies with no debt.
- Depreciation. Depreciation is a non-cash charge. Annual depreciation charges are influenced by the amount of depreciable assets (some companies own real estate while others rent) and accounting assumptions (depreciable lives and methods). Calculating earnings prior to depreciation charges normalizes for these differences. A note of caution is in order here, however—the comparability benefits break down a bit at this point. If Company A rents facilities while Company B owns facilities, EBITDA will be lower for Company A (rent expense is deducted in computing EBITDA) than for Company B (depreciation is not). However, Company B will presumably have higher capital expenditure needs to maintain the properties that it owns than Company A will as a lessee. All of which is another way of saying that, while it is true that depreciation does not represent a cash outflow in the period recognized, it does represent a real cash outflow in a prior period, and one that will need to be repeated as the asset wears out.
- Amortization. Companies that grow through acquisition recognize intangible assets on their balance sheets that are subsequently written off through amortization charges on the income statement. Companies that grow organically do not incur amortization charges. Since EBITDA is calculated prior to amortization deductions, the performance of companies that have grown through acquisition is presented on a comparable basis with those that have grown organically. Unlike depreciable fixed assets, amortizable intangible assets generally do not need to be replaced through subsequent cash outflows.
Conclusion
The income statement records the revenues earned and expenses incurred by the company during a period of time. Experienced financial statement readers focus on revenue growth and margins (on an absolute basis, with respect to change over time, and relative to peers). Breaking revenue down into its constituent parts (volume and price) can yield insights into the narrative behind changes in revenue over time. Analysis of fixed and variable operating expenses can help form judgments regarding breakeven revenues and the sensitivity of changes in operating income to changes in revenue. Interest and income tax expenses reveal the company’s financing and organizational decisions. Expressing earnings on a per share basis helps assess whether investments in growth have been accretive or dilutive. Normalizing adjustments may be appropriate to develop an estimate of ongoing earnings. EBITDA is a commonly-cited measure because it enhances comparability across firms and serves as a proxy for cash flow available to owners for a variety of discretionary ends.
 Family Business Director


