Five Reasons Your Family Business Should Focus on ROIC


Family Business Director calls Memphis, Tennessee home, and among other things, Memphis is a basketball town. In the 2017 NBA playoffs, former Grizzlies coach David Fizdale launched a meme when he wrapped up his post-game press conference with an epic rant on the unbalanced officiating during the game by citing a litany of statistics, walking off exclaiming, “Take that for data!”
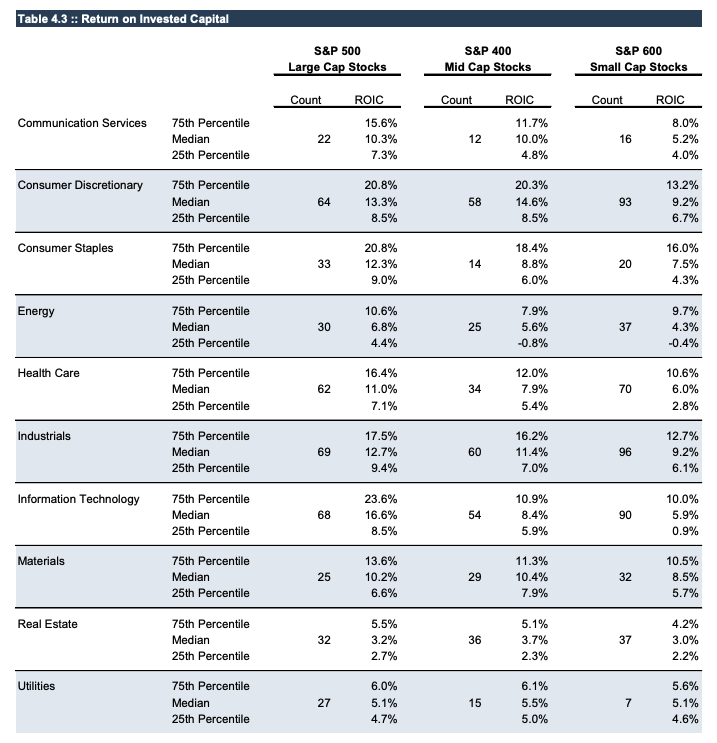
Both the sports and business worlds are increasingly data-driven, and access to relevant data is essential to making good decisions. Our goal in publishing the 2019 Benchmarking Guide for Family Business Directors was to make such data available for family business directors. We have written often of our fondness for return on invested capital (ROIC) as the best comprehensive measure of financial performance for family business. Table 4.3 of the Guide, reproduced below, summarizes ROIC measures for the population of public companies from which we drew observations.
Hoping to make Coach Fizdale proud, we took a closer look at the data this week to see if could confirm our hunch that ROIC matters. To do so, we divided our population of companies into two groups. The first group includes those companies with ROIC greater than their respective industry and size group median, and the second group consists of the below median ROIC companies. Dividing the population this way ensures that the groups are balanced with respect to size and industry composition.
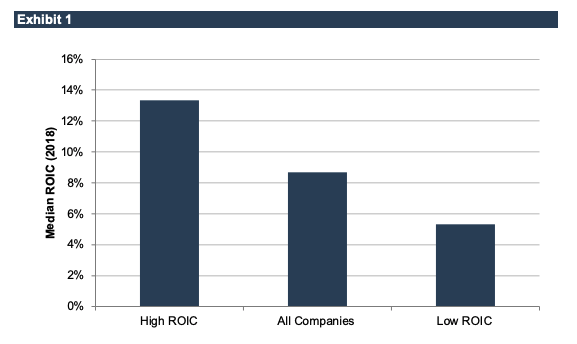
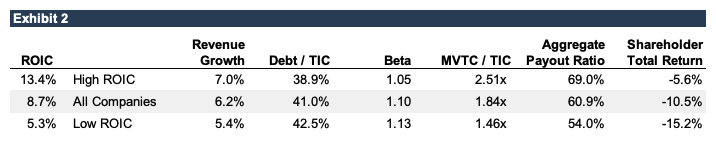
As shown in Exhibit 1, the median ROIC for the overall population is 8.7%, while the medians for the High ROIC and Low ROIC groups are 13.4% and 5.3%, respectively. This week, we examine other attributes of the firms in each group to see whether ROIC is, in fact, a good predictor of positive outcomes for family shareholders. Exhibit 2 summarizes the data.
Having analyzed the data, we can identify five reasons family businesses should focus on ROIC.
#1 – High ROIC Companies Grow Faster
The first thing we notice is that companies in the High ROIC group tend to have higher historical revenue growth rates than those in the Low ROIC group. We measure historical revenue growth on a three-year compound annual basis. This measure includes both organic and acquisition-fueled growth. As summarized in Exhibit 2, the median compound annual growth rate for the High ROIC group is 7.0%, compared to 5.4% for the Low ROIC group.
There is no necessary correlation between ROIC and revenue growth. So why do the High ROIC companies grow faster than the Low ROIC companies? We can hazard a couple of guesses:
- First, companies that are attentive to ROIC tend to have less lazy capital on their balance sheets. As a result, the assets that are held are more productive, and managers are more effective in finding revenue-relevant uses of corporate assets.
- Second, ROIC-mindful managers and directors tend to be more discriminating acquirers of other businesses. By focusing on the marginal ROIC impact of proposed acquisitions, these companies do a better job of weeding out poor acquisitions that dilute revenue growth.
#2 – High ROIC Companies Distribute More Cash
The good news does not end with revenue growth, however. Perhaps the firms in the High ROIC group generate faster revenue growth simply by reinvesting earnings rather than distributing earnings to shareholders. If so, the revenue growth differential would merely be a side effect of stinginess towards shareholders. Happily, however, this is not the case. The companies in the High ROIC group actually distribute earnings to shareholders more liberally than their counterparts in the Low ROIC group. Combining both dividends and share repurchases, the median aggregate payout ratio for the High ROIC group is 69% of earnings, compared to 54% for the Low ROIC group.
ROIC is a natural deterrent to the empire-building tendencies which can be especially prevalent in family businesses. Managers and directors who benchmark to ROIC would prefer to distribute earnings than reinvest those earnings in capital projects that do not provide adequate returns. This is especially significant for family businesses, since many family disputes are rooted in reluctance or unwillingness to pay dividends.
#3 – High ROIC Companies Are Less Risky
But perhaps, the ROIC skeptic may claim, the High ROIC companies are merely accepting greater levels of risk – after all, return follows risk. However, the data seems to rule out this possibility. We considered two measure of risk: financial leverage and beta.
- Measured as a percentage of total invested capital, debt comprises 38.9% of the total for the High ROIC group compared to 42.5% for the Low ROIC Group.
- Beta is a measure of relative riskiness for equity holders: the higher the beta, the greater the risk. The median beta for the High ROIC group is 1.05x, compared to 1.13x for the Low ROIC group.
These differences may not seem very large, but what is most important is what they tell us the High ROIC companies don’t do. They don’t fund higher shareholder payouts by borrowing more money than their Low ROIC peers. Nor do they chase returns by engaging in riskier projects. As we noted above, we constructed our High ROIC and Low ROIC groups to be balanced with respect to both industry and company size, so those factors do not account for the observed differences in financial leverage and beta.
#4 – High ROIC Companies Provide Better Returns
Is ROIC simply a manipulation of accounting data with no traction in the real world, or does it actually translate into superior shareholder returns? To answer this question, we calculated total shareholder returns (capital appreciation plus dividend yield) for each of the companies in our population for calendar year 2018. As noted in Exhibit 2, the median shareholder return for the High ROIC group outperformed the median for the Low ROIC group by approximately 9.6% (negative 5.6%, compared to negative 15.2%). Calculating ROIC is not merely an exercise for overly-excitable accountants, but is a tool for directing strategy and managerial attention to the behaviors that generate shareholder returns.
Does your family business track shareholder returns over time? If so, how do the shareholder returns compare to various benchmarks? If not, is it because historical valuation data is not available, or because family leaders are reluctant to perform the calculation? Paying attention to ROIC today is a reliable way to improve shareholder returns tomorrow.
#5 – High ROIC Companies Are Worth More
Finally, High ROIC companies are worth more than Low ROIC companies. This will not come as a surprise to readers familiar with the work of consulting firm Stern Stewart in the mid-1990s. The greater the sustainable return per dollar of invested capital, the more a given dollar of invested capital is worth. The most straightforward way to measure this is by calculating the ratio of the market value of total capital (MVTC, the sum of debt plus the market value of equity) to total invested capital (TIC, the sum of debt plus the book value of equity).
- If the ratio is 1.00x, the capital entrusted to management by lenders and shareholders is neither enhanced nor diminished by the stewardship of management.
- If the ratio is greater than 1.00x, management’s efforts are increasing the value of the family’s capital; if the ratio is less than 1.00x, family capital is actually being squandered in the business.
In the lexicon of Stern Stewart, MVTC/TIC is a proxy for Market Value Added. The median MVTC/TIC ratio for our High ROIC group is 2.51x compared to 1.46x for the Low ROIC group, confirming our intuition that High ROIC companies are more valuable.
Conclusion
Return on invested capital is not a silver bullet – it will not solve all of the challenges facing your family business. It can even be misused. However, when we let the data speak for itself, the benefits of ROIC are undeniable.