While many banks chafe under tightening regulatory policy directed by the Federal Reserve and other agencies, the Fed’s monetary policy has, however, created favorable conditions for equity investors. Likewise, the Fed’s monetary policy has compressed spreads on credit-sensitive assets and negated the return on holding liquidity. From bank management’s perspective, these conditions have led to continued deterioration in asset yields, pressure to extend loan portfolio durations, and few remaining alternatives to reduce funding costs. In sum, the Federal Reserve and other agencies have created conditions that complicate bank managers’ decision making – namely, greater regulatory burdens and the effects of a prolonged low interest rate period. However, the Fed’s monetary policy also has created conditions ripe for expansion of banks’ stock prices.
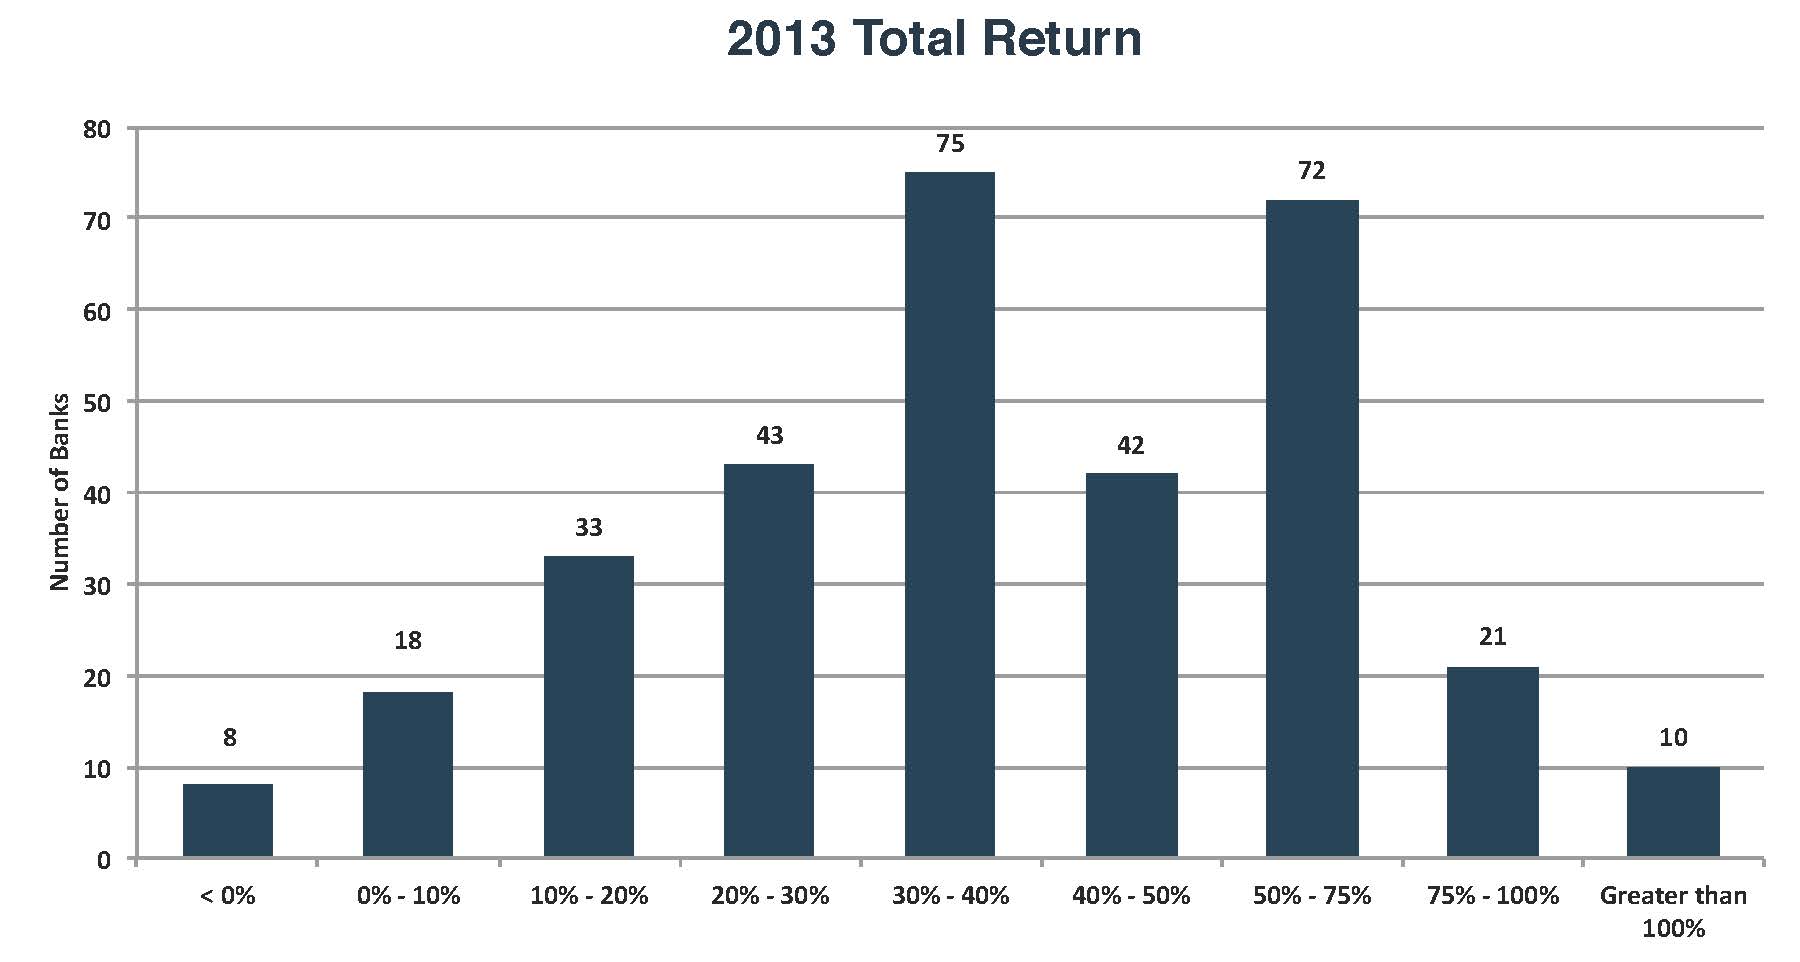
For 322 banks traded on the NYSE, NYSE MKT, and NASDAQ, the median calendar year 2013 shareholder return (that is, stock price change plus dividends) was 38%. As indicated in Chart 1, only eight banks (2% of the population) suffered a negative return in 2013, with nearly one-third (32%) enjoying a total return exceeding 50%.
Chart 1: 2013 Total Return
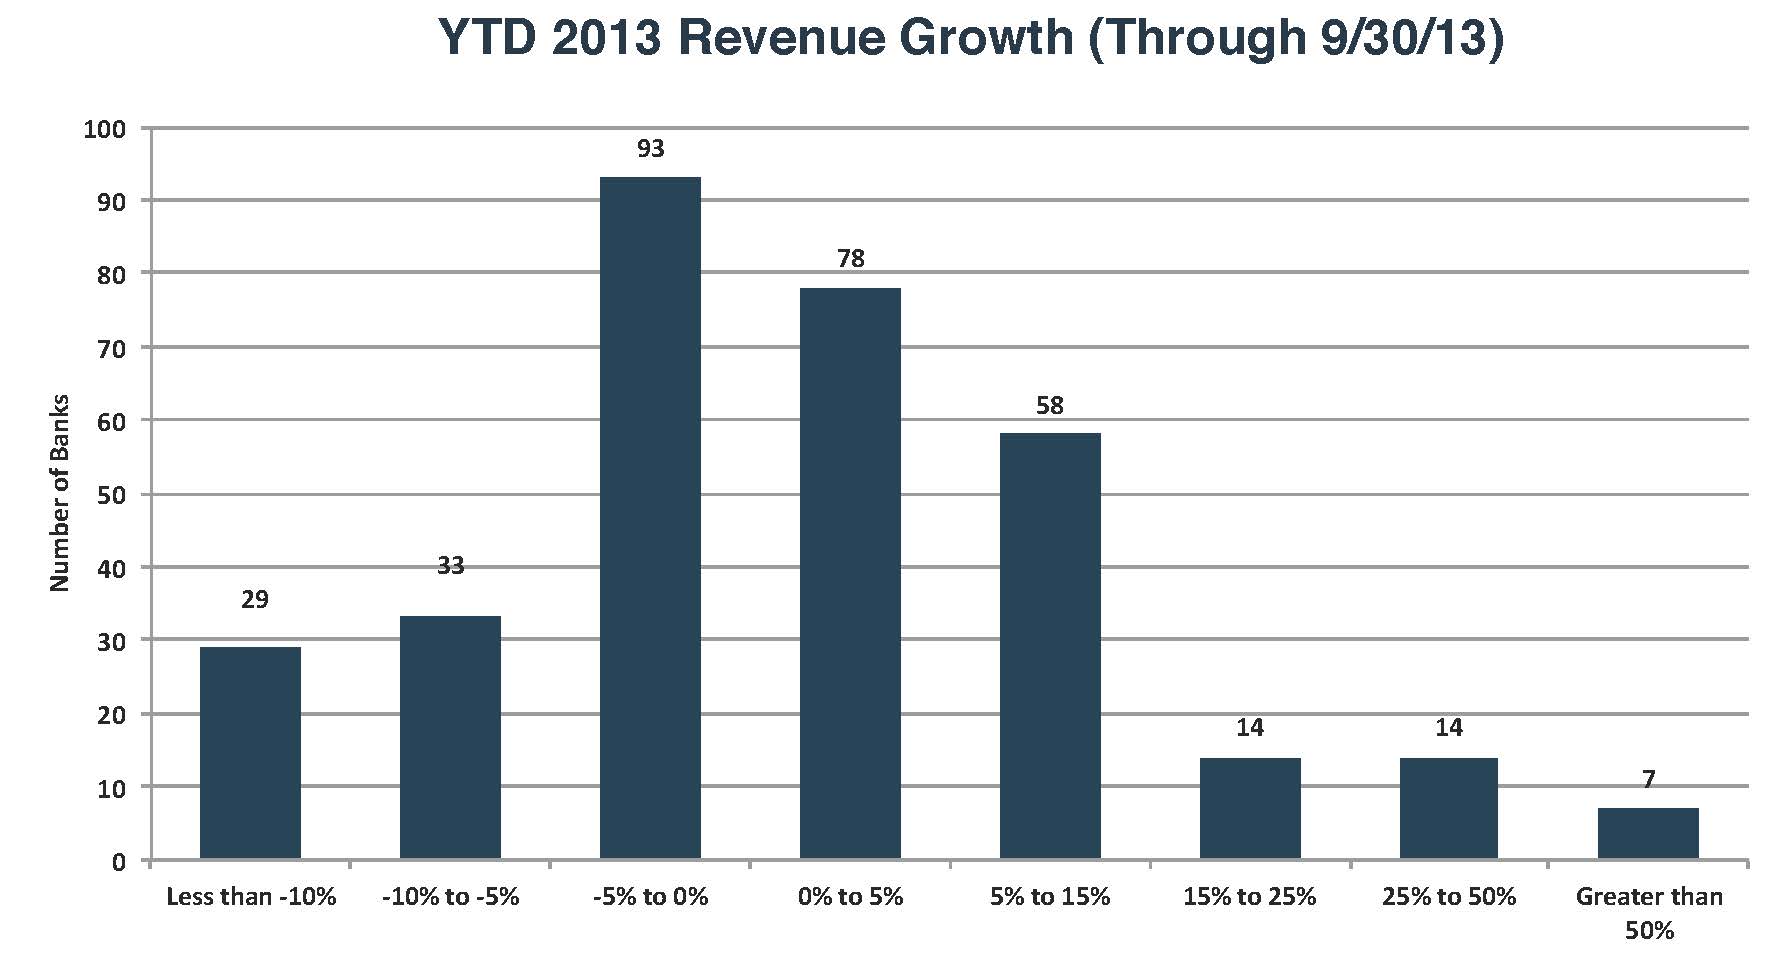
The market performance is particularly striking when viewed relative to revenue growth in 2013, measured by the change in year-to-date recurring revenue between the year-to-date period ended September 30, 2013 and the comparable prior year period. Approximately one-half of the publicly traded banks experienced declining revenue in 2013, as illustrated in Chart 2. Many of the banks reporting faster revenue growth rates completed an acquisition.
Chart 2: YTD 2013 Revenue Growth (Through 9/30/13)
While revenue growth was difficult in 2013, banks had further opportunities to reduce credit-related costs, leading to some increase in net income. SNL Financial’s estimates suggest that “core” net income (that is, excluding certain non-recurring revenue and expense items) expanded a median of 8% for the population of publicly-traded banks in the trailing twelve month period ended September 30, 2013.
In performing a post mortem on a concluded year, it is often instructive to separate banks experiencing positive and negative returns, and then search for common characteristics distinguishing the two groups. In 2013, however, the “winner” and “loser” analogy appears less descriptive of the year. Therefore, we adopt the terms “winners” and “lesser winners.”
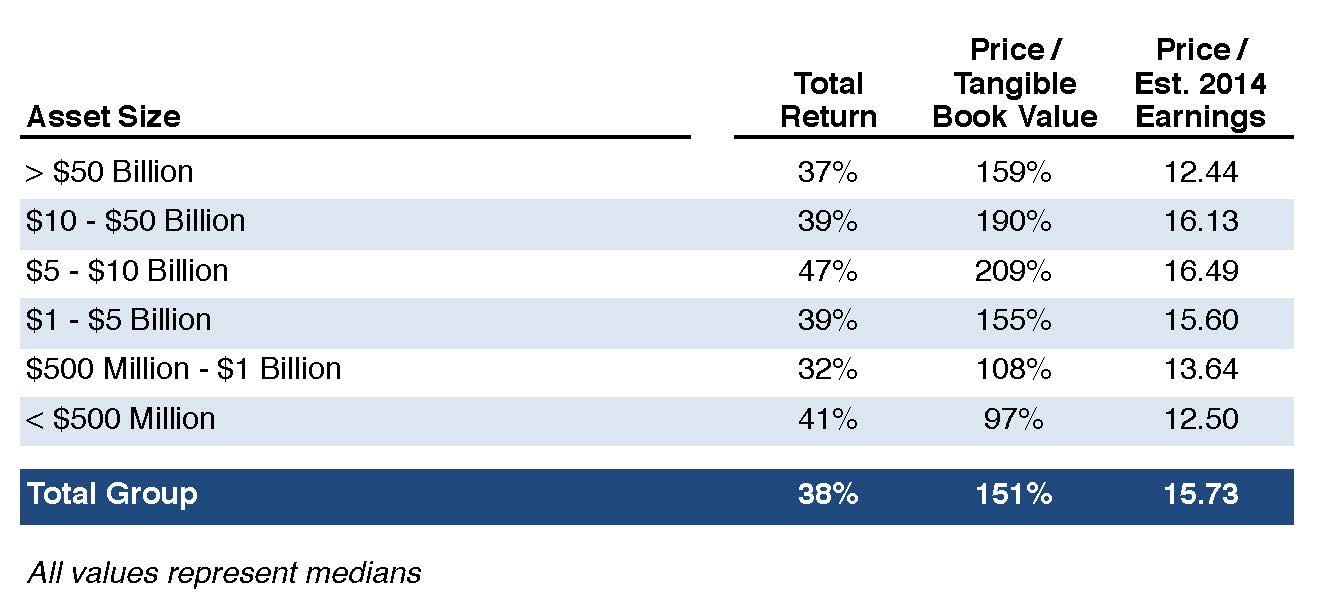
Market performance in 2013 cut across all asset size categories (see Table 1). Favorable performance for the subset comprised of banks with assets between $5 and $10 billion (return of 47%), along with the attendant expansion of price/earnings and price/tangible book value multiples, has provided this group a strong currency to undertake merger and acquisition activity in 2014.
Table 1
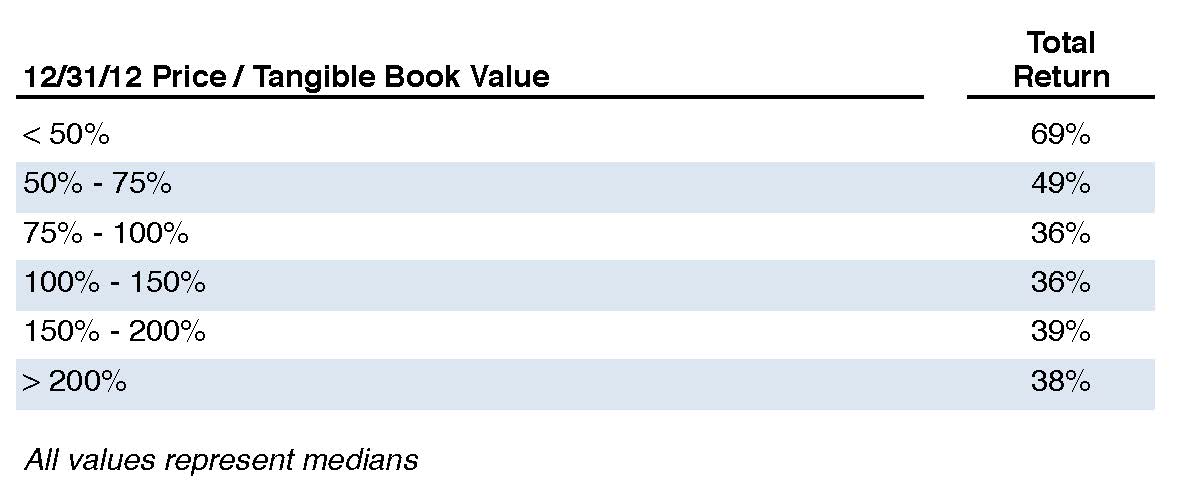
A strategy of purchasing banks with lower price/tangible book value multiples at year-end 2012 would have served investors well in 2013, as banks with year-end 2012 price/tangible book value multiples of less than 75% outperformed in 2013 (per Table 2). In addition to being potentially more leveraged to improving economic conditions (due to their more fragile asset quality), banks with lower price/tangible book value multiples benefited from greater M&A activity, more open capital markets, and investors’ desire for higher “beta” securities.
Table 2
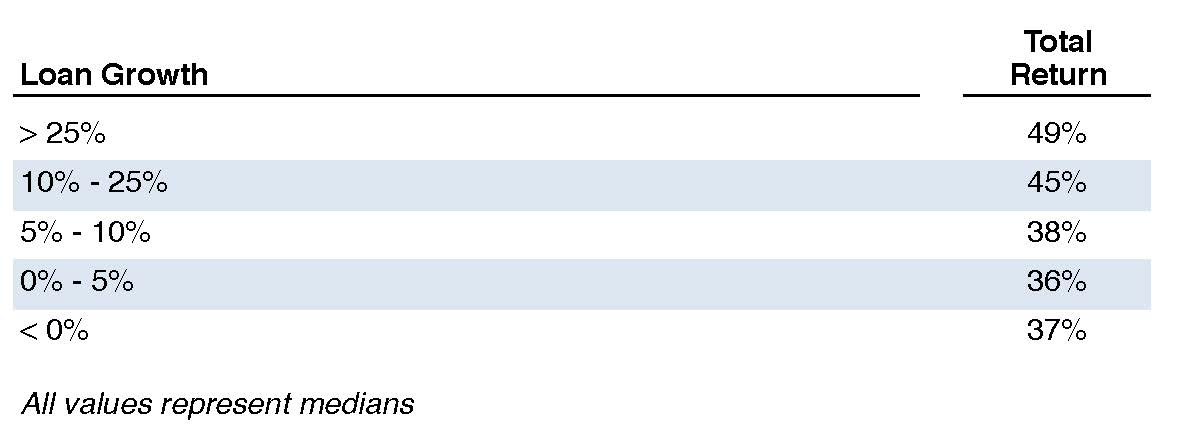
Perhaps the most meaningful demarcation between the winners and lesser winners is evident in revenue or loan growth rates. As indicated in Tables 3 and 4, total returns exceeded 40% only for the subset of banks with revenue growth exceeding 5% between the September 30, 2013 year-to-date period and the comparable prior year-to-date period.
Table 3
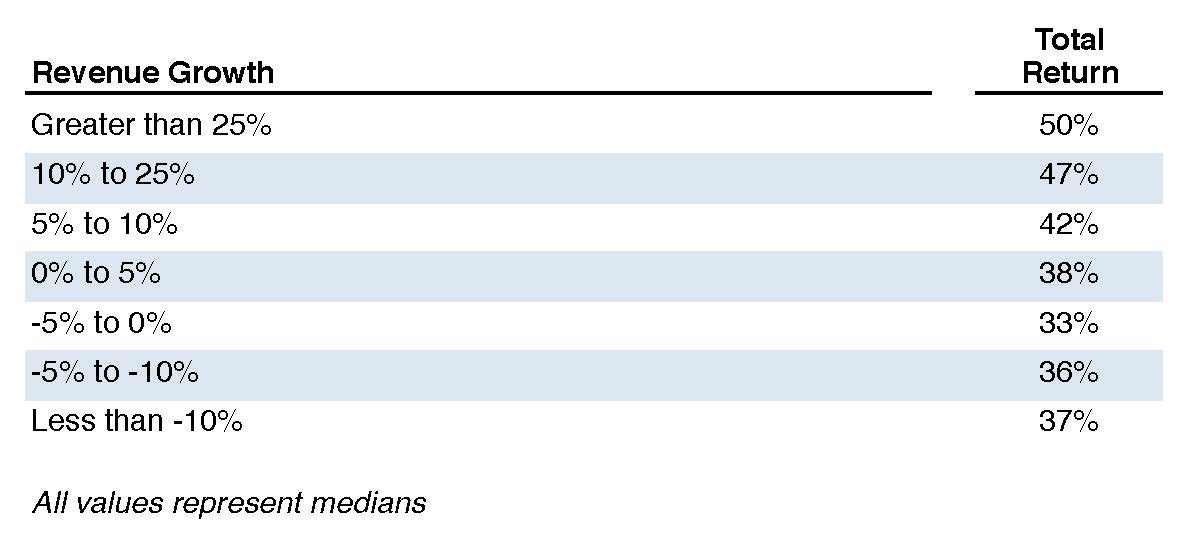
Table 4
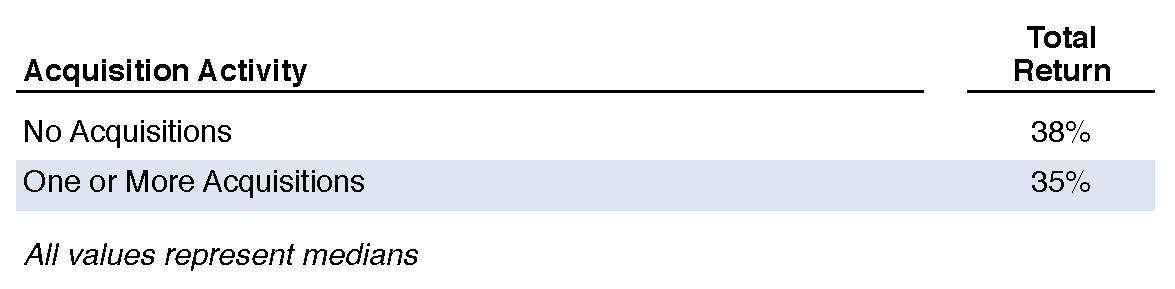
Several of the top performing banks in 2013 were active acquirers during the year. However, it was difficult to ascertain a relationship between acquisition activity and market returns, as suggested by Table 5. Thus, it remains incumbent on acquirers to maintain pricing discipline, such as by using their higher pricing multiple stocks to acquire smaller banks at lower multiples, and/or to demonstrate how the acquisition would benefit the acquirer’s profitability growth.
Table 5
In recent prior years, market returns often were correlated with non-performing asset ratios or changes in NPA ratios. This trend was less evident in 2013, as the winners included banks with NPAs less than 1% or greater than 10% of loans and other real estate owned.
Table 6

Market prognosticators are not predicting a reprise of 2013’s performance in 2014. In fact, returns comparable to 2013 would cause price/earnings multiples materially to exceed historical averages, without accelerating earnings growth. Analysts’ EPS estimates available at year-end 2013 suggest growth on the order of 7% in fiscal 2014, with improvement to 11% in fiscal 2015. In addition, consensus estimates for the S&P 500 index predict appreciation on the order of 5% to 6%. These estimates appear consistent with lower, but still positive, returns in 2013.
Potential challenges in 2014 include:
Mercer Capital assists banks, thrifts, credit unions, and other depository institutions with significant corporate valuation requirements, transactional advisory services, and other strategic decisions. We pair analytical rigor with industry knowledge to deliver unique insight into issues facing depositories. To discuss a transaction or valuation issue in confidence, please contact us.


