2019 Outlook: Gasping for Air Replaces 2018’s Rainbow Chasing
What a difference a year makes. A year ago corporate tax reform had been enacted that lowered the top marginal tax rate to 21% from 35%. Banks were viewed as one of the primary beneficiaries through a reduction in tax rates and a pick-up in economic growth. Now investors are questioning whether bank stocks and other credit investments are canaries in the U.S. economic coalmine.
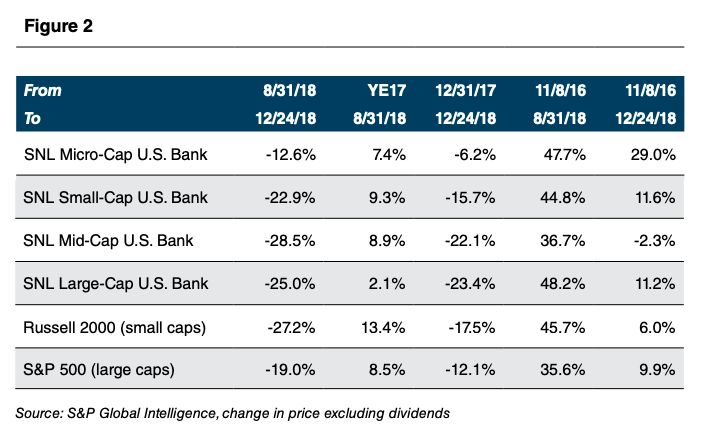
As 2018 draws to a close, bank fundamentals are very good; however, bank stock prices have tanked. SNL Financial’s small-, mid-, and large-cap bank indices have fallen by more than 20% since August 31, which meets the threshold definition of a bear market (i.e., down 20% vs. 10% for a correction).
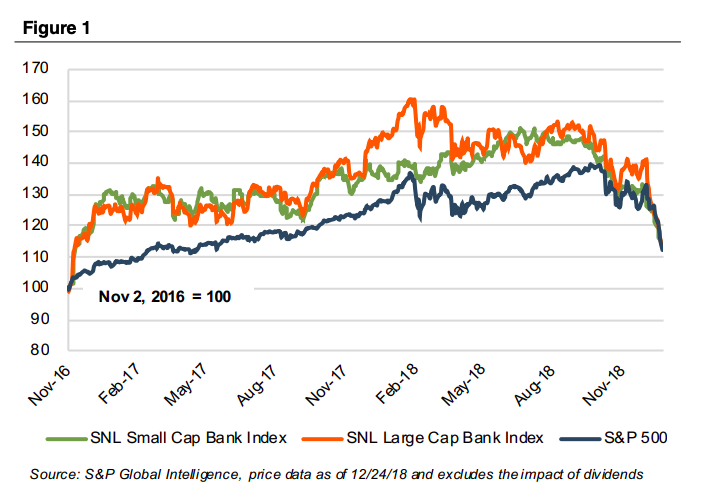
Markets, of course, lead fundamentals, and corporate credit markets lead equity markets. Among industry groups, bank stocks are “early cyclicals”, meaning they turn down before the broader economy does and tend to turn up before other sectors when recessions bottom.
Large cap banks peaked in February while the balance of the industry peaked in the third quarter after having a fabulous run that dates to the national elections on November 8, 2016. The downturn in bank stock prices corresponds with weakening home sales, widening credit spreads in the leverage loan and high yield bond markets, a ~40% reduction in oil prices, and a nearly inverted Treasury yield curve.
To state the obvious: markets—but not fundamentals so far—are signaling 2019 (and maybe 2020) will be a more challenging year than was assumed a few months ago in which the economy slows and credit costs rise. The key question for 2019 then is: how much and is a slowdown fully priced into stocks?
Our next issue of Bank Watch will entail a deep dive into credit, but for this issue, we observe that a global unwind of leverage is underway as the Fed extracts liquidity from the system. Bond buying (QE) and ultra-low rates helped drive asset prices higher. The reverse is proving true, too.
Bank Fundamentals
Bank fundamentals are in good-to-great shape. During the third quarter all FDI-Cinsured institutions reported aggregate net income of $62 billion, up 29.3% from 3Q17. Excluding the impact of lower taxes, 3Q18 pro forma net income would have been about $55 billion, up 13.9% from 3Q17. The data is more nuanced once the industry is segregated by asset size, however.
As shown in Figure 3, ROA and ROE have nearly rebounded to the last pre-crisis year of 2006. Importantly, capital has increased significantly and, thereby, provides an additional buffer whenever the next downturn develops.
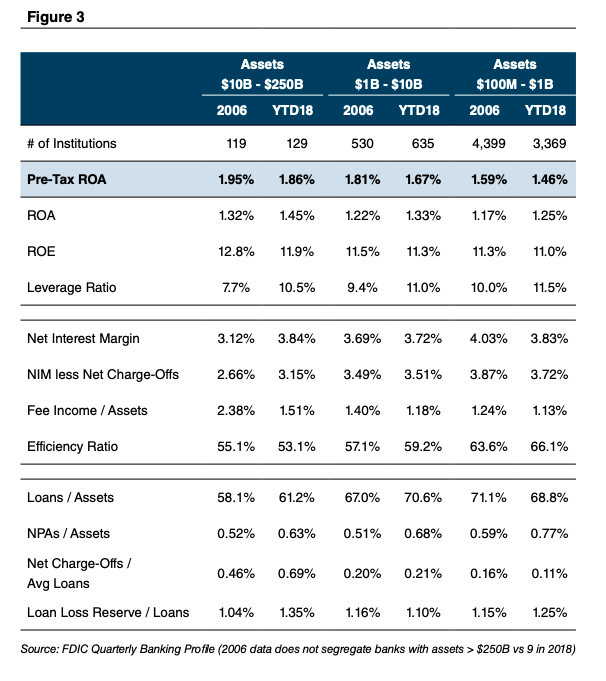
As it relates to 2019, bank fundamentals are not expected to change much other than credit costs are expected to increase from a very low level in which current loss rates in all loan categories are below long-term averages. Wall Street consensus EPS estimates project mid-single digit EPS growth for the largest banks, primarily as a result of share repurchases and a slightly higher full year NIM, while regional and community bank consensus estimates reflect upper single digit EPS growth from the same factors and somewhat better loan growth.
However, credit and equity markets imply the consensus is too high given the sharp widening in credit spreads and drop in bank stock prices the past several months. Although markets lead fundamentals, market signals about magnitude are less clear. Given continuing growth in the U.S. economy that on balance will be helped by lower oil prices, it seems reasonable that an increase in credit costs the market is forecasting will be modest, and as a result, bank profitability will not be meaningfully crimped in 2019.
The Fed: 2019 Rate Hikes Seem Unlikely
Whenever the Fed embarks on an extended rate hiking campaign, the saying goes the Fed hikes until something breaks. The market is signaling that the December rate hike—the ninth in the current cycle—that pushed the Fed Funds target from 2.25% to 2.50% when the yield on the 10-year UST bond was ~2.8% may be one of those moments. What’s unusual about the current tightening cycle is it represents an attempt by the Fed (but not the BOJ, ECB or SNB) to extract itself from radical monetary policies in which the Fed is raising short-term rates and shrinking its balance sheet at the same time.
Given the flat yield curve, it is hard to see how the Fed will hike the Fed Funds another couple of times as planned for 2019, unless the Fed wants to invert the yield curve or unless intermediate- and long-term rates reverse and trend higher. Presumably the $50 billion a month pace in the reduction of its US Treasury and Agency MBS portfolio will continue. Alternatively, perhaps the Fed will bow to the market and not raise rates in 2019 and slow or even halt the reduction in its balance sheet to stabilize markets.
As it relates to bank fundamentals, the impact on net interest margins will depend upon individual bank balance sheet compositions. Broadly, however, a scenario of no rate hikes implies less pressure to raise deposit rates, and rising wholesale borrowing rates should stabilize. The result, therefore, should be a little bit better NIMs than a slight reduction if the Fed continues to hike given that deposit rate betas for many institutions are well over 50% now. More important for banks if the Fed pauses vs continues to hike would be the impact on asset values (higher all else equal) and, therefore, credit costs.
Bank Valuations: Support but Never a Stand-Alone Catalyst
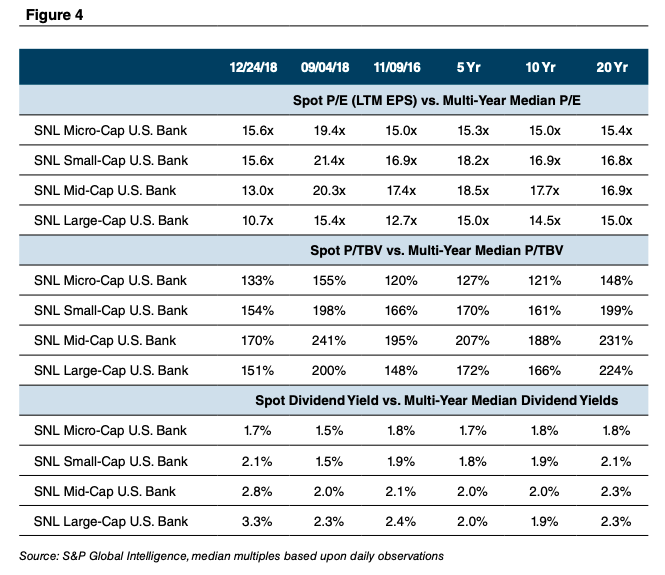
A synopsis of bank valuations is presented in Figure 4 in which current valuations for the market cap indices are compared to the approximate market top around August 31, November 8, 2016 when the national election occurred, and multi-year medians based upon daily observations. An important point is that valuation is not a catalyst to move a stock; rather, valuation provides a margin of safety (or lack thereof) and thereby can provide additional return over time as a catalyst such as upward (or downward) earnings revisions can cause a multiple to expand or contract.
Bank stocks—particularly mid-cap and large-cap banks—enter 2019 relatively inexpensive to history. The stocks are cheap relative to 2019 consensus earnings with large cap banks trading around 8x and small cap banks at 10x; however, the market’s message is that the estimates are too high. It is hard to envision that estimates are dramatically too high as proved to be the case in 2008 unless the economy is poised to roll-over hard, which seems unlikely. Assuming no recession or a shallow recession, then, the modest valuations may result in bank stocks having a good year even if fundamentals weaken and analysts cut estimates because the limited downside in earnings had been adequately priced into the stocks by late December.
Bank M&A: Slowing Activity for 2019 Likely
Outwardly, 2018 has been another good year for bank M&A even though activity slowed in the fourth quarter. There were few notable deals other than Fifth Third’s pending acquisition of Chicago-based MB Financial valued at $4.8 billion at announcement and Synovus Financial’s pending acquisition of Boca Raton-based FCB Financial Holding valued for $2.8 billion at announcement. Even before bank stocks rolled over the shares of both Fifth Third and Synovus severely underperformed peers as investors questioned the exchange ratios, cost saving assumptions, credit risk (especially at FCB), and whether the buyers could keep the franchises intact as key personnel defected elsewhere.
The national average price/tangible book multiple expanded to 173% from 166% in 2017 and about 140% in 2014, 2015 and 2016 before the sector was revalued in the wake of the national election. The median P/E of 25x was within the five-year range of 21x to 28x.
The total number of bank and thrift transactions through December 24 totaled 261, which equated to 4.4% of the commercial bank and thrift charters as of year-end 2017. During 2014–2018, the number of acquisitions exceeded 4% each year except for 2016 when activity at the beginning of the year was hampered by weak stock prices as a result of a slowing economy that was marked by a collapse in oil prices and sharply wider credit spreads.
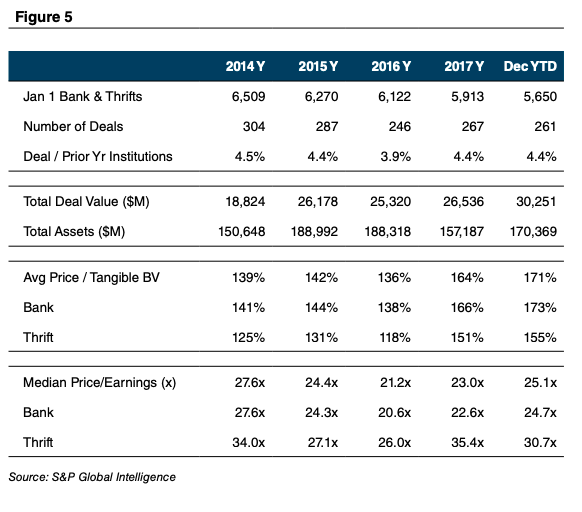
Weak bank stock prices crimp the ability to negotiate deals because most sellers are focused on absolute price rather than relative value when taking the buyer’s shares as consideration; and, buyers usually are unwilling to increase the number of shares being offered given a limitation on minimum acceptable EPS accretion and maximum acceptable TBVPS dilution. A notable late year exception occurred when Cadence Bancorporation opted to increase the number of shares it will issue to State Bancorp by 9.6% because the double trigger in the merger agreement signed during May when Cadence’s share price was much higher came into play.
Although there is no change in the driver of consolidation such as succession issues, shareholder liquidity needs, and economies of scale, a slowdown in M&A activity in 2019 is likely because bank stocks will enter the year depressed. Deals that entail some amount of common share consideration will be tough to structure unless sellers will be willing to take less, which most will not do with operating fundamentals in good shape for now. All cash deals will be impacted less, but all cash deals are more prevalent among very small institutions in which pricing usually occurs at a discount to those that entail some proportion of common shares.
Summing It Up
The market is shouting fundamentals will weaken in 2019 after a long period of gradual improvement following the Great Financial Crisis, which most likely will be reflected in sluggish loan growth and modestly higher credit costs; however, bank stocks may surprise to the upside as they did to the downside in 2018 provided a) there is no recession or a shallow one; and, b) the Fed relents and does not hike further and potentially slows the run-off of its excess bonds (and liability reserves). For clients of Mercer Capital who obtain year-end valuations, rising stock prices since the presidential election may be reversed partially, given the compression in market price/earnings and price/tangible book value multiples that occurred in 2018.


