We recall discussions in early 2022 with clients regarding their outlook for 2022 – three 25 basis point Fed rate increases, a “more normal” operating environment following the pandemic afflicted 2020 and 2021, and stable credit quality. The latter of those three items held true, but 2022 was anything but normal. Instead of three 25 basis point rate increases, the Fed delivered seven totaling 425 basis points. The bull market was routed for both equities and, most exceptionally, bonds.
Given this backdrop, publicly-traded banks did comparatively well. The median stock price change among the 343 banks and thrifts traded on the NASDAQ and NYSE was negative 9% in 2022, relative to negative 19% for the S&P 500 and negative 33% for the NASDAQ. Further, there was more dispersion in performance during 2022.
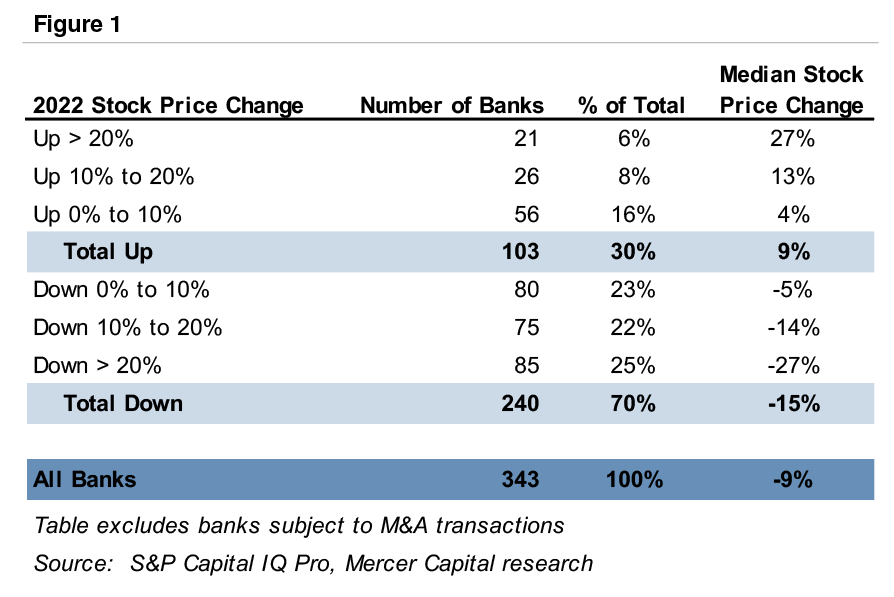
In 2020, only 13% of publicly-traded banks reported a rising stock price during the year, whereas in 2021 only 5% of banks reported a falling stock price from year-end 2020 to 2021. That is, banks generally moved in tandem—down in 2020 and up in 2021. While not evenly balanced, 30% of banks reported a positive year-over-year stock price change in 2022 (see Figure 1). We believe this positive performance for quite a few banks in 2022 was masked by the downbeat market sentiment and warrants further investigation.
Figure 2 distinguishes shares price changes in 2022 by asset size range. The largest banks, with assets exceeding $100 billion, performed the worst in 2022, with no banks reporting share price appreciation and a median stock price decline of 22%. Smaller banks performed better, led by banks with assets between $1 and $5 billion. This stratum reported a median share price decline of only 5%, with 38% of the banks experiencing positive share price appreciation in 2022.
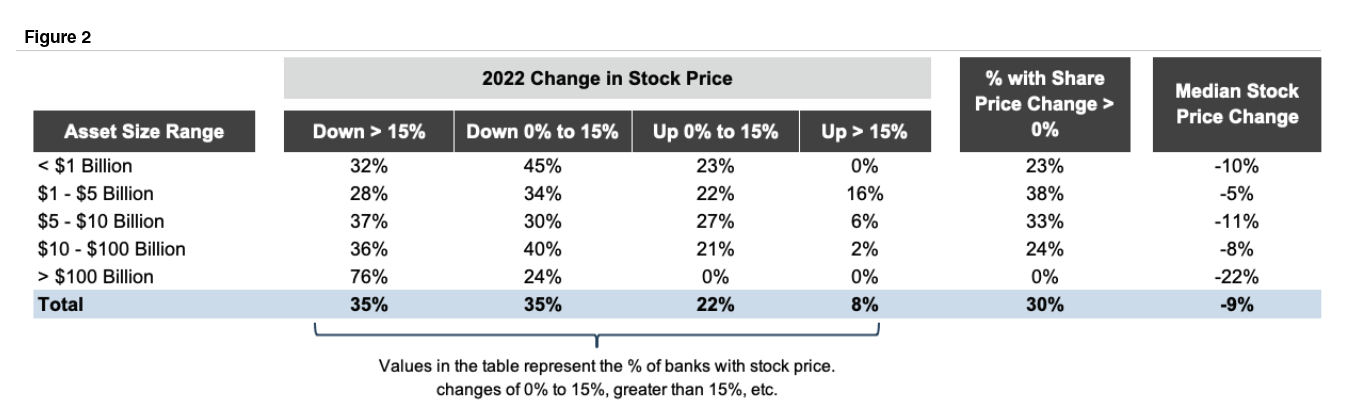
Click here to expand the image above
While market performance remains a function of the market’s ever evolving view of a particular bank’s earning power, growth outlook, and risk attributes, we explore in this article some of the factors influencing the better and weaker performing banks in 2022.
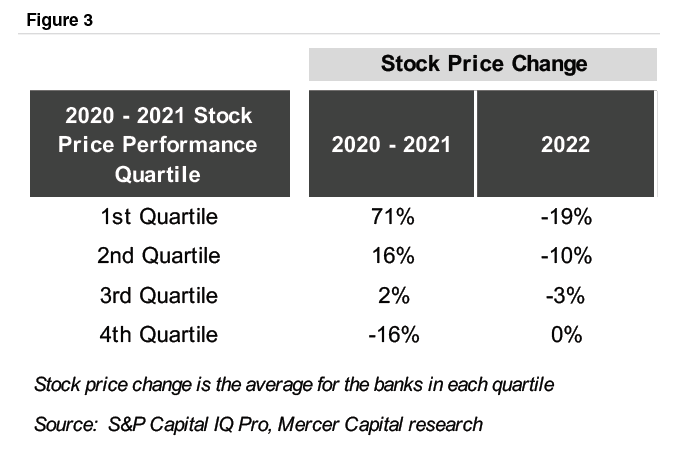
One of the best predictors of share price appreciation in 2022 was, in fact, performance from year-end 2019 to year-end 2021. As indicated in Figure 3, banks with the strongest price appreciation during 2020 and 2021 performed the worst in 2022, while those banks that most lagged the market in 2020 and 2021 outperformed in 2022.
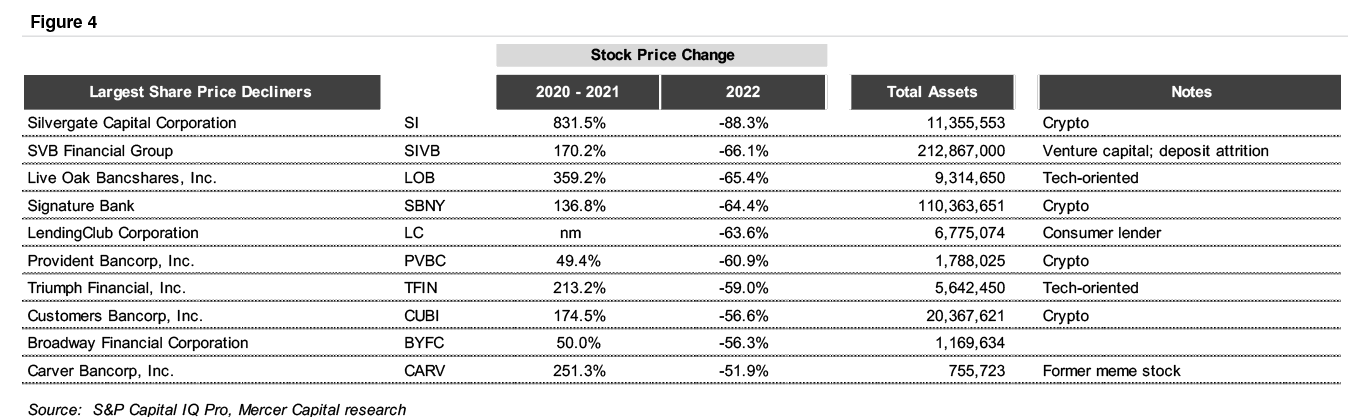
Some of the market leaders in 2020 and 2021 crashed out of favor in 2022, such as those embracing crypto or positioning themselves as technology leaders rather than stodgy, traditional banks. Figure 4 presents the ten banks with the largest negative returns in 2022.
Click here to expand the image above
The most common question we received over the last twelve months was, “what is the effect of the unrealized securities portfolio loss on share value?” While there are possibly extenuating circumstances for some banks (see, e.g., Silvergate Capital Corp. in Figure 4), our general guidance is that the market emphasizes forward-looking earning power, not the magnitude of the unrealized loss.
Figure 5 correlates stock performance in 2022 with the magnitude of the unrealized securities portfolio loss.1 For example, banks in the first quartile had a median unrealized loss of 5% of equity.2 These banks experienced a median stock price change of negative 6%. Meanwhile, banks with the largest unrealized losses—ranging from 29% to 111% of tangible equity—reported a median stock price change of negative 5%. A more robust statistical analysis indicates a similar result; that is, virtually no relationship between the size of a bank’s unrealized securities portfolio loss and market performance in 2022.
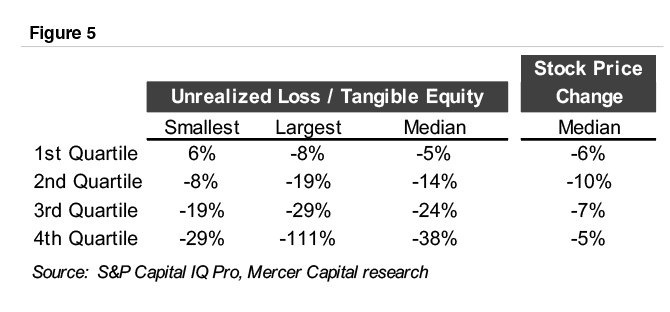
Our view is that the unrealized loss on securities should be evaluated in the context of the entire balance sheet. We would be more concerned, from a valuation standpoint, when a large unrealized loss is coupled with a heavier exposure to fixed rate loans, particularly if the bank is facing pressure on deposit rates.
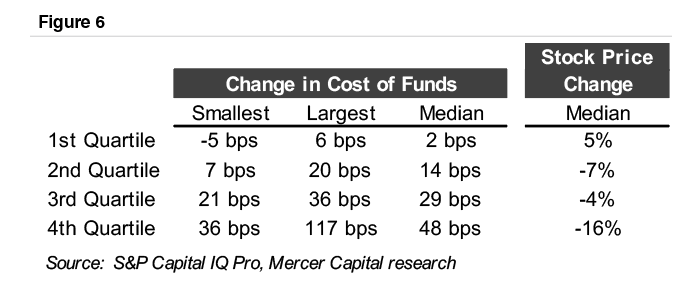
As we found out in 2022, some core deposits are more core than others. One of the strongest determinants of stock price performance in 2022 was the change in the cost of funds. We evaluated the change in the cost of funds from the first through the third quarters of 2022.3 As indicated in Figure 6, banks in the first quartile reported a median increase in the cost of funds of two basis points, whereas banks in the fourth quartile reported a median increase of 48 basis points. Further, banks in the first quartile reported a median stock price change of positive 5% in 2022, versus negative 16% for the fourth quartile banks.
An analysis of net interest margin expansion between the first and third quarters of 2022 shows a similar result. Banks in the first quartile reported a median change in NIM of six basis points and a stock price change of negative 18%, while banks in the quartile with the most NIM expansion—82 basis points for the median fourth quartile bank—eked out a 1% positive share price appreciation.
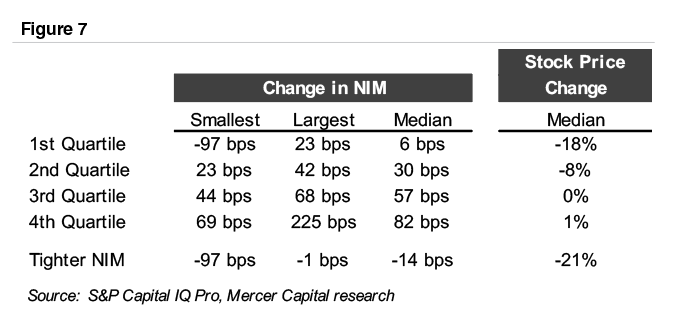
The preceding analysis masks the market’s concern for banks with tightening NIMs, however. Among the 205 banks in our analysis, eighteen reported NIM compression between the first and third quarters of 2022. These banks underperformed, with sixteen of the eighteen reporting lower stock prices in 2022 and a median stock price decline of 21%. This indicates the market’s sensitivity to NIM compression, which will be an issue for more banks in 2023 as rising deposit rates bite.
From publicly-available disclosures, it is difficult to discern the sensitivity of a bank’s assets, including both loans and securities, to rising rates. In the recent zero rate environment, pressure existed to invest in anything but short-term liquid assets. Therefore, we evaluated whether balance sheet composition could explain market performance in 2022. We could find no discernable relationship between loan/deposit ratios and market performance in 2022. However, while the evidence is somewhat weak, banks with the largest exposures to short-term liquid assets performed better in 2022.4
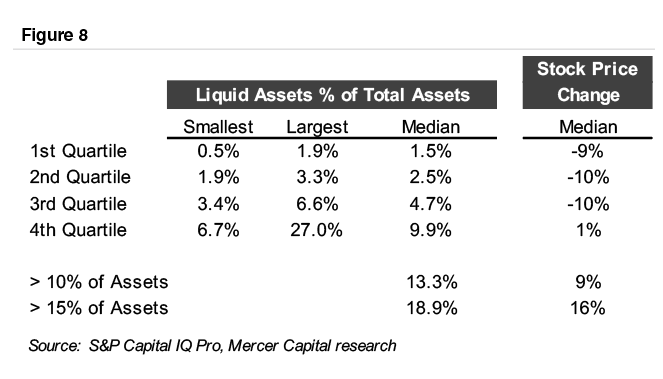
Figure 8 shows short-term liquid assets as a percentage of total assets. Most banks operate with short-term liquid assets in a relatively tight range (under 5% of total assets); thus, limited correlation is evident between exposure to short-term liquid assets and performance. However, a more positive relationship begins to emerge in the tail of the distribution. Banks in the fourth quartile reported liquid assets of 9.9% and a positive 1% stock price change. Narrowing the fourth quartile banks to those with liquid assets exceeding 10% or 15% of total assets results in stronger share price changes of positive 9% and 16%, respectively.
As in 2022, no doubt some newfound concerns will emerge in 2023 to drive bank stock performance. We suspect that funding cost pressure will remain an overarching concern in 2023, with true core deposits proving their value in a way not evident for years. Loan repricing will be interesting to watch. With many Prime, LIBOR, and SOFR-based floating rate loans having already repriced, further expansion in asset yields will depend on the contractual repricing periods for existing adjustable rate loans and, for newly originated loans, the “rate beta” between origination rates and broad market rates. After a long period of near nil credit losses, it would not be surprising to see some upward pressure on credit losses, although this seems likely to remain episodic in 2023. Some banks with heavier exposure to consumer loans underperformed in 2022, and it will be interesting to watch if weaknesses emerge in any segments of banks’ commercial loan portfolios in 2023.