On September 21, 2022, the Federal Reserve increased the target federal funds rate by 75 basis points, capping off a collective increase of 300 basis points since March 2022. With the expectation of additional rate increases this year, it’s a good time to evaluate recent trends in core deposit values and discuss expectations for deposit valuations in the coming months.
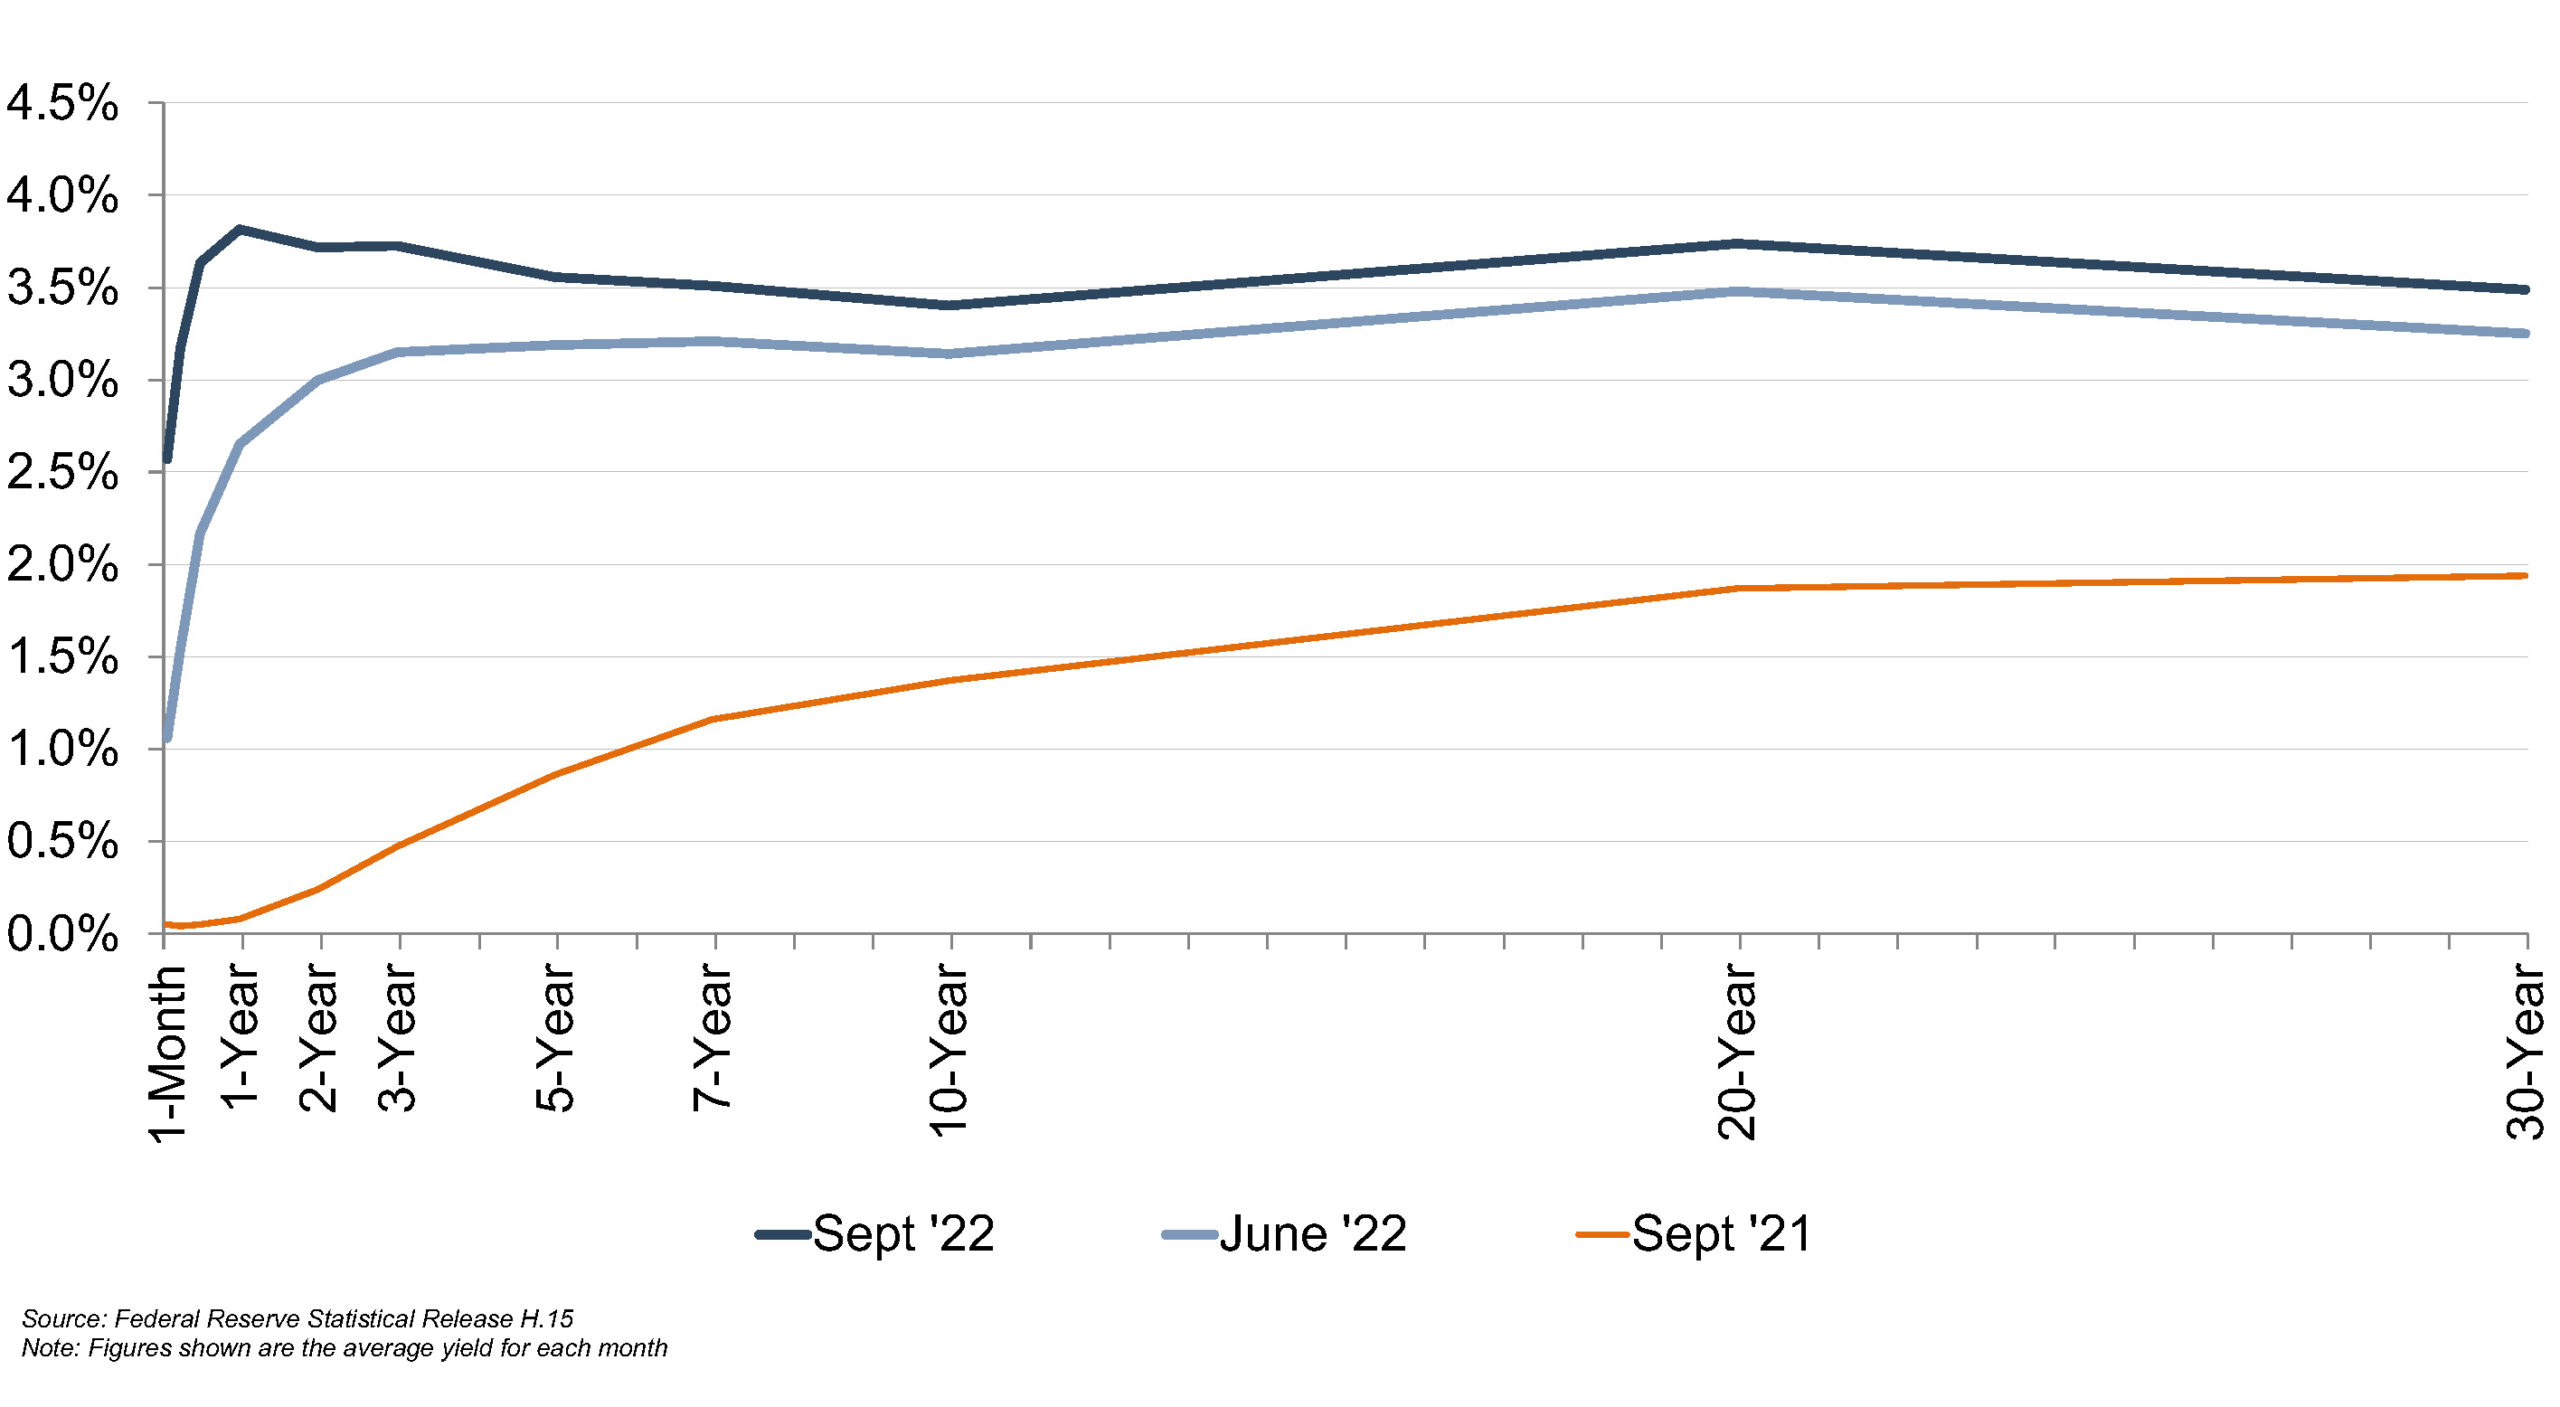
Mercer Capital previously published articles on core deposit trends in August 2020 during the early stages of the pandemic and again in August 2021. In those articles, we described a decreasing trend in core deposit intangible asset values. In response to the pandemic, the Fed cut rates effectively to zero, and the yield on the benchmark 10-year Treasury reached a record low. While many factors are pertinent to analyzing a deposit base, a significant driver of value is market interest rates. As shown below, we find ourselves in a very different interest rate environment today.
Using data compiled by S&P Capital IQ Pro, we analyzed trends in core deposit intangible (CDI) assets recorded in whole bank acquisitions completed from 2000 through mid-September 2022. CDI values represent the value of the depository customer relationships recorded by acquirers as an intangible asset. CDI values are driven by many factors, including the “stickiness” of a customer base, the types of deposit accounts assumed, the level of noninterest income generated, and the cost of the acquired deposit base compared to alternative sources of funding. For our analysis of industry trends in CDI values, we relied on S&P Capital IQ Pro’s definition of core deposits.1
In analyzing core deposit intangible assets for individual acquisitions, however, a more detailed analysis of the deposit base would consider the relative stability of various account types. In general, CDI assets derive most of their value from lower-cost demand deposit accounts, while often significantly less (if not zero) value is ascribed to more rate-sensitive time deposits and public funds. Non-retail funding sources such as listing service or brokered deposits are excluded from core deposits when determining the value of a CDI.
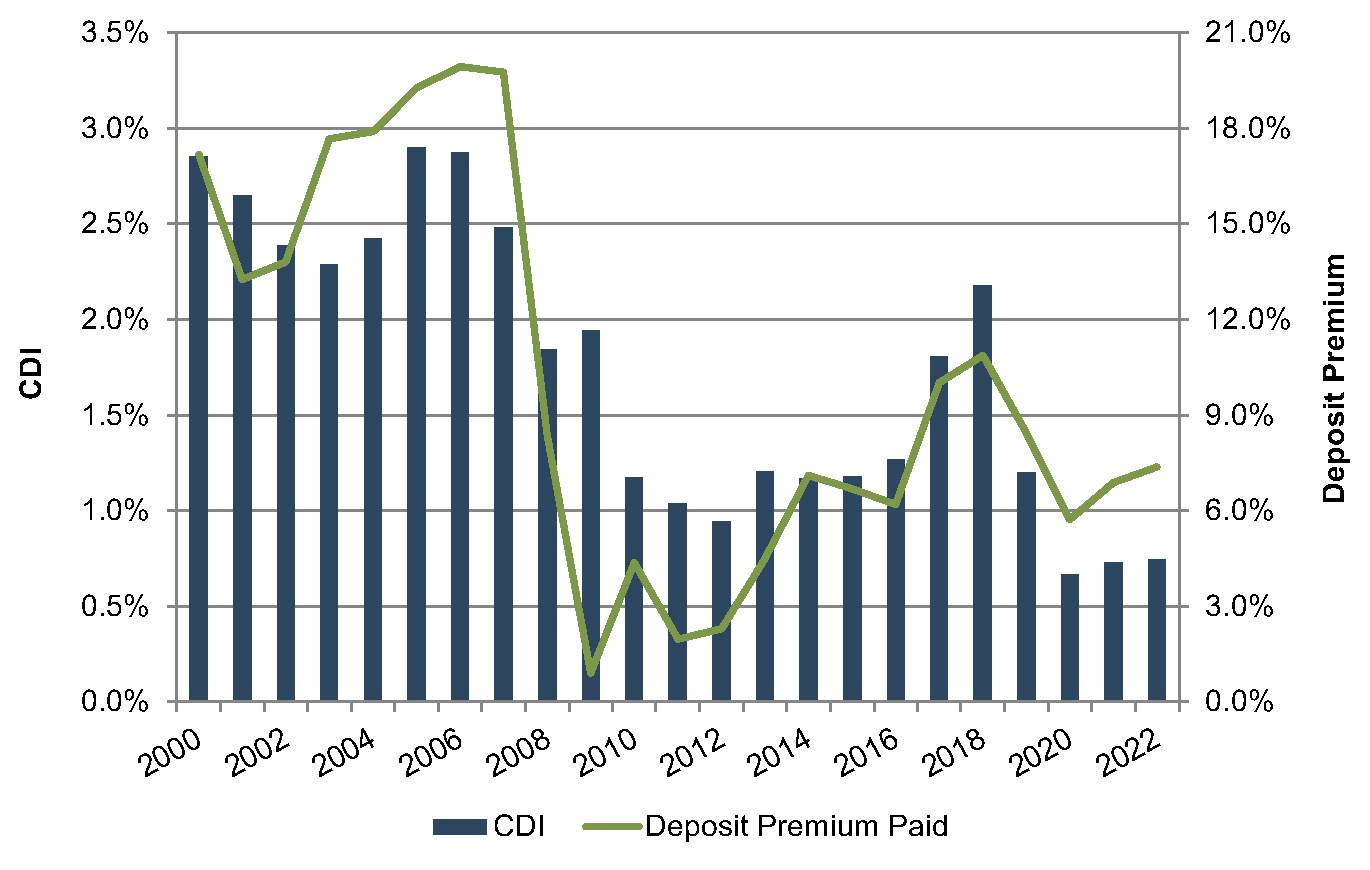
Figure 2 summarizes the trend in CDI values since the start of the 2008 recession, compared with rates on 5-year FHLB advances. Over the post-recession period, CDI values have largely followed the general trend in interest rates—as alternative funding recorded by acquirers became more costly in 2017 and 2018, CDI values generally ticked up as well, relative to post-recession average levels. Throughout 2019, CDI values exhibited a declining trend in light of yield curve inversion and Fed cuts to the target federal funds rate during the back half of 2019. This trend accelerated in March 2020 when rates were effectively cut to zero.

Click here to expand the image above
CDI values have showed some recovery in the past few quarters (with an average CDI value of 93 basis points year-to-date in 2022 as compared to 64 basis points for all of 2021). Despite the recent uptick, CDI values remain below the post-recession average of 1.29% in the period presented in the chart and meaningfully lower than long-term historical levels which averaged closer to 2.5% to 3.0% in the early 2000s. They are also markedly lower than one might expect, given the current cost of wholesale funding.
As shown above, reported CDI values have not increased in tandem with the recent increase in FHLB rates. The average CDI value increased just 25 basis points from September 2021 to September 2022, while the five-year FHLB advance increased a dramatic 228 basis points over the same period. In late-2018 the 5-year FHLB rate approximated the current, mid-September 2022 level, but the average CDI value at that time was 2.42% (compared to the third quarter 2022 average value of 0.75%). The CDI values in recent quarters are somewhat counterintuitive. There are likely three drivers for the relationship between recently reported CDI values and market interest rates:
Nineteen deals were announced in August and September 2022, and five of those deals provided either investor presentations or earnings calls containing CDI estimates. These CDI estimates ranged from 1.5% to 2.0%, which is more in line with the numbers we have observed in our valuation analyses. We expect CDI values to continue rising in concert with market interest rates. However, market interest rates are not the only driver of CDI value, and there are some potentially mitigating factors to CDI values in the near term.
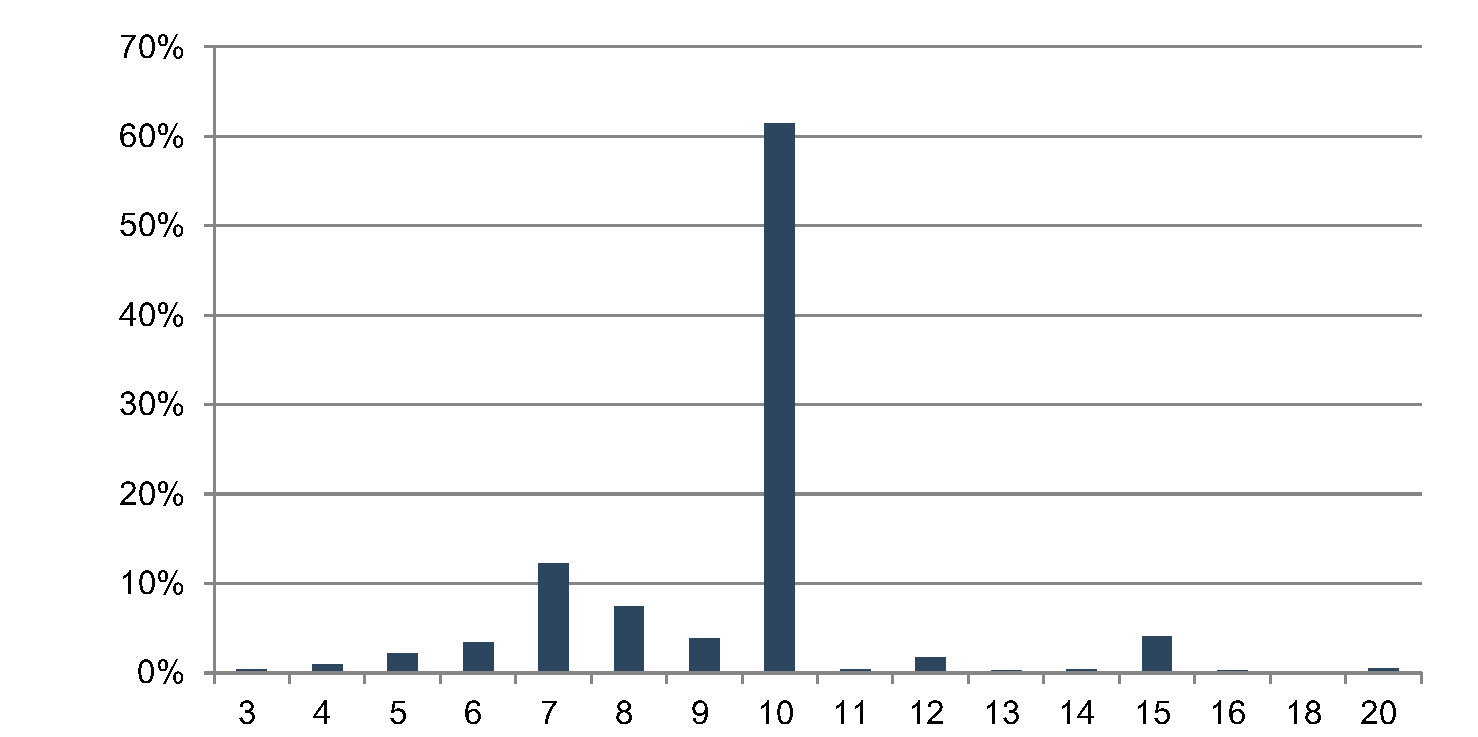
Core deposit intangible assets are related to, but not identical to, deposit premiums paid in acquisitions. While CDI assets are an intangible asset recorded in acquisitions to capture the value of the customer relationships the deposits represent, deposit premiums paid are a function of the purchase price of an acquisition.
Deposit premiums in whole bank acquisitions are computed based on the excess of the purchase price over the target’s tangible book value, as a percentage of the core deposit base. While deposit premiums often capture the value to the acquirer of assuming the established funding source of the core deposit base (that is, the value of the deposit franchise), the purchase price also reflects factors unrelated to the deposit base, such as the quality of the acquired loan portfolio, unique synergy opportunities anticipated by the acquirer, etc. As shown in Figure 4, deposit premiums paid in whole bank acquisitions have shown more volatility than CDI values. Deposit premiums in the range of 6% to 10% remain well below the pre-Great Recession levels when premiums for whole bank acquisitions averaged closer to 20%.
Additional factors may influence the purchase price to an extent that the calculated deposit premium doesn’t necessarily bear a strong relationship to the value of the core deposit base to the acquirer. This influence is often less relevant in branch transactions where the deposit base is the primary driver of the transaction and the relationship between the purchase price and the deposit base is more direct. Figure 5 (on the next page) presents deposit premiums paid in whole bank acquisitions as compared to premiums paid in branch transactions.
Deposit premiums paid in branch transactions have generally been less volatile than tangible book value premiums paid in whole bank acquisitions. Branch transaction deposit premiums averaged in the 3.0% to 7.5% range during 2020, up from the 2.0% to 4.0% range observed in the financial crisis. During 2021 and the first quarter of 2022, branch transaction deposit premiums averaged 2.5% to 5.25%. Unfortunately, none of the branch transactions completed in the second or third quarters of 2022 reported franchise premium data.
![]()
Click here to expand the image above
Some disconnect appears to exist between the prices paid in branch transactions and the CDI values recorded in bank M&A transactions. Beyond the relatively small sample size of branch transactions, one explanation might be the excess capital that continues to accumulate in the banking industry, resulting in strong bidding activity for the M&A opportunities that arise–even in situations where the potential buyers have ample deposits.
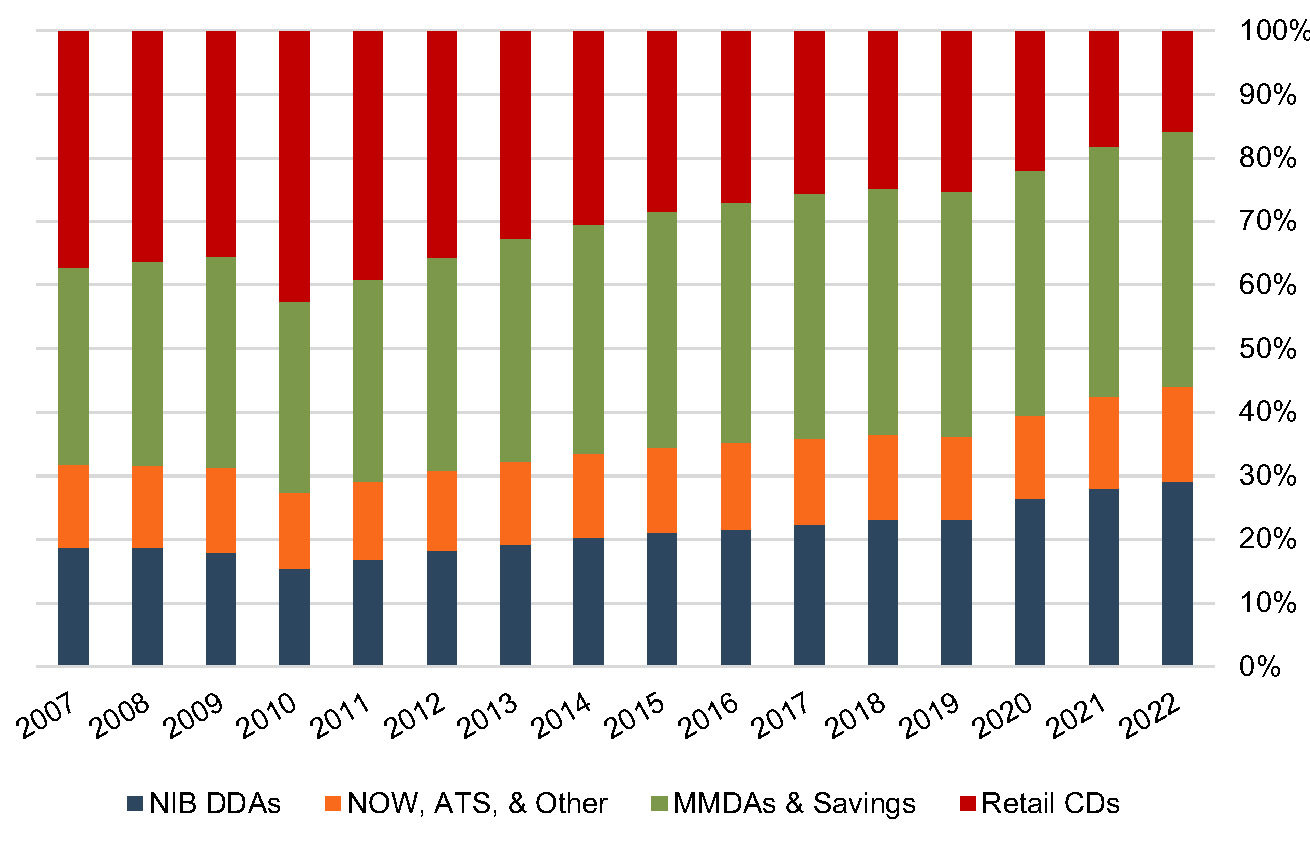
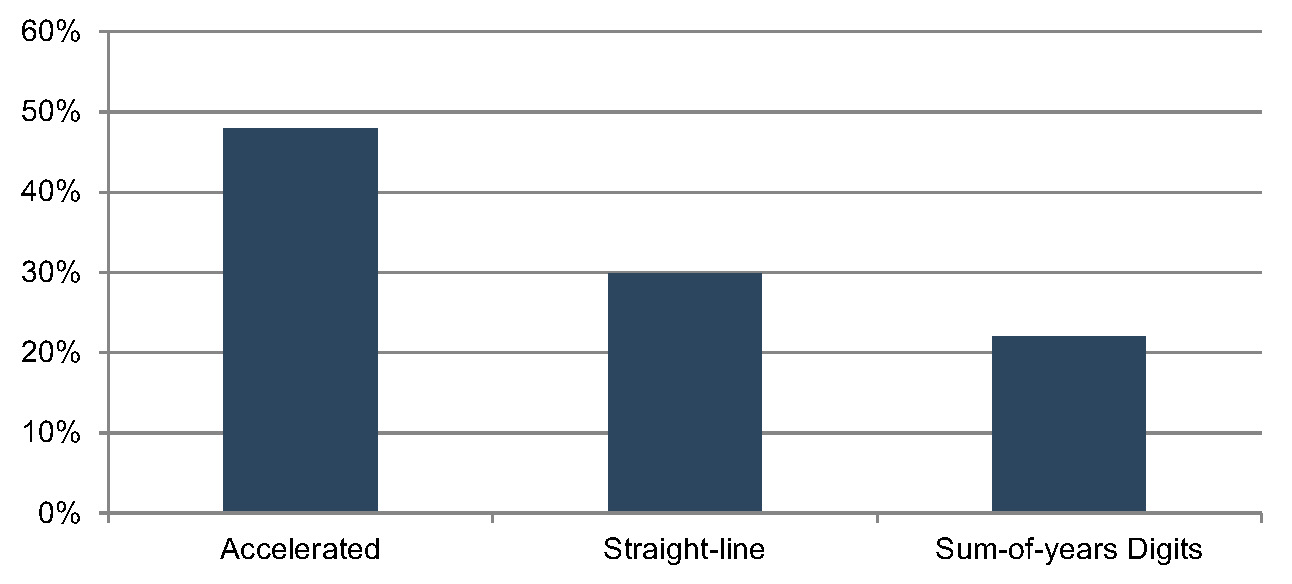
Based on the data for acquisitions for which core deposit intangible detail was reported, a majority of banks selected a ten-year amortization term for the CDI values booked. Less than 10% of transactions for which data was available selected amortization terms longer than ten years. Amortization methods were somewhat more varied, but an accelerated amortization method was selected in approximately half of these transactions.
Transactions Completed 2008 – September 25, 2022
For more information about Mercer Capital’s core deposit valuation services, please contact a member of our Depository Institution Services Team.


