Since Mercer Capital’s most recently published article on core deposit trends in September 2022, the banking industry has faced abysmal deal activity. The scarcity of transactions can largely be blamed on unfavorable deal math due to required balance sheet marks on underwater securities and loan portfolios. Compressed P/E ratios, credit quality concerns (especially for commercial real estate portfolios), regulatory headwinds, pressures on profitability, and uncertainty in the wake of several bank failures earlier in 2023, have also contributed to a quiet year from an M&A perspective. Although deal activity has been slow, we have seen an obvious uptick in core deposit intangible values relative to this time last year.
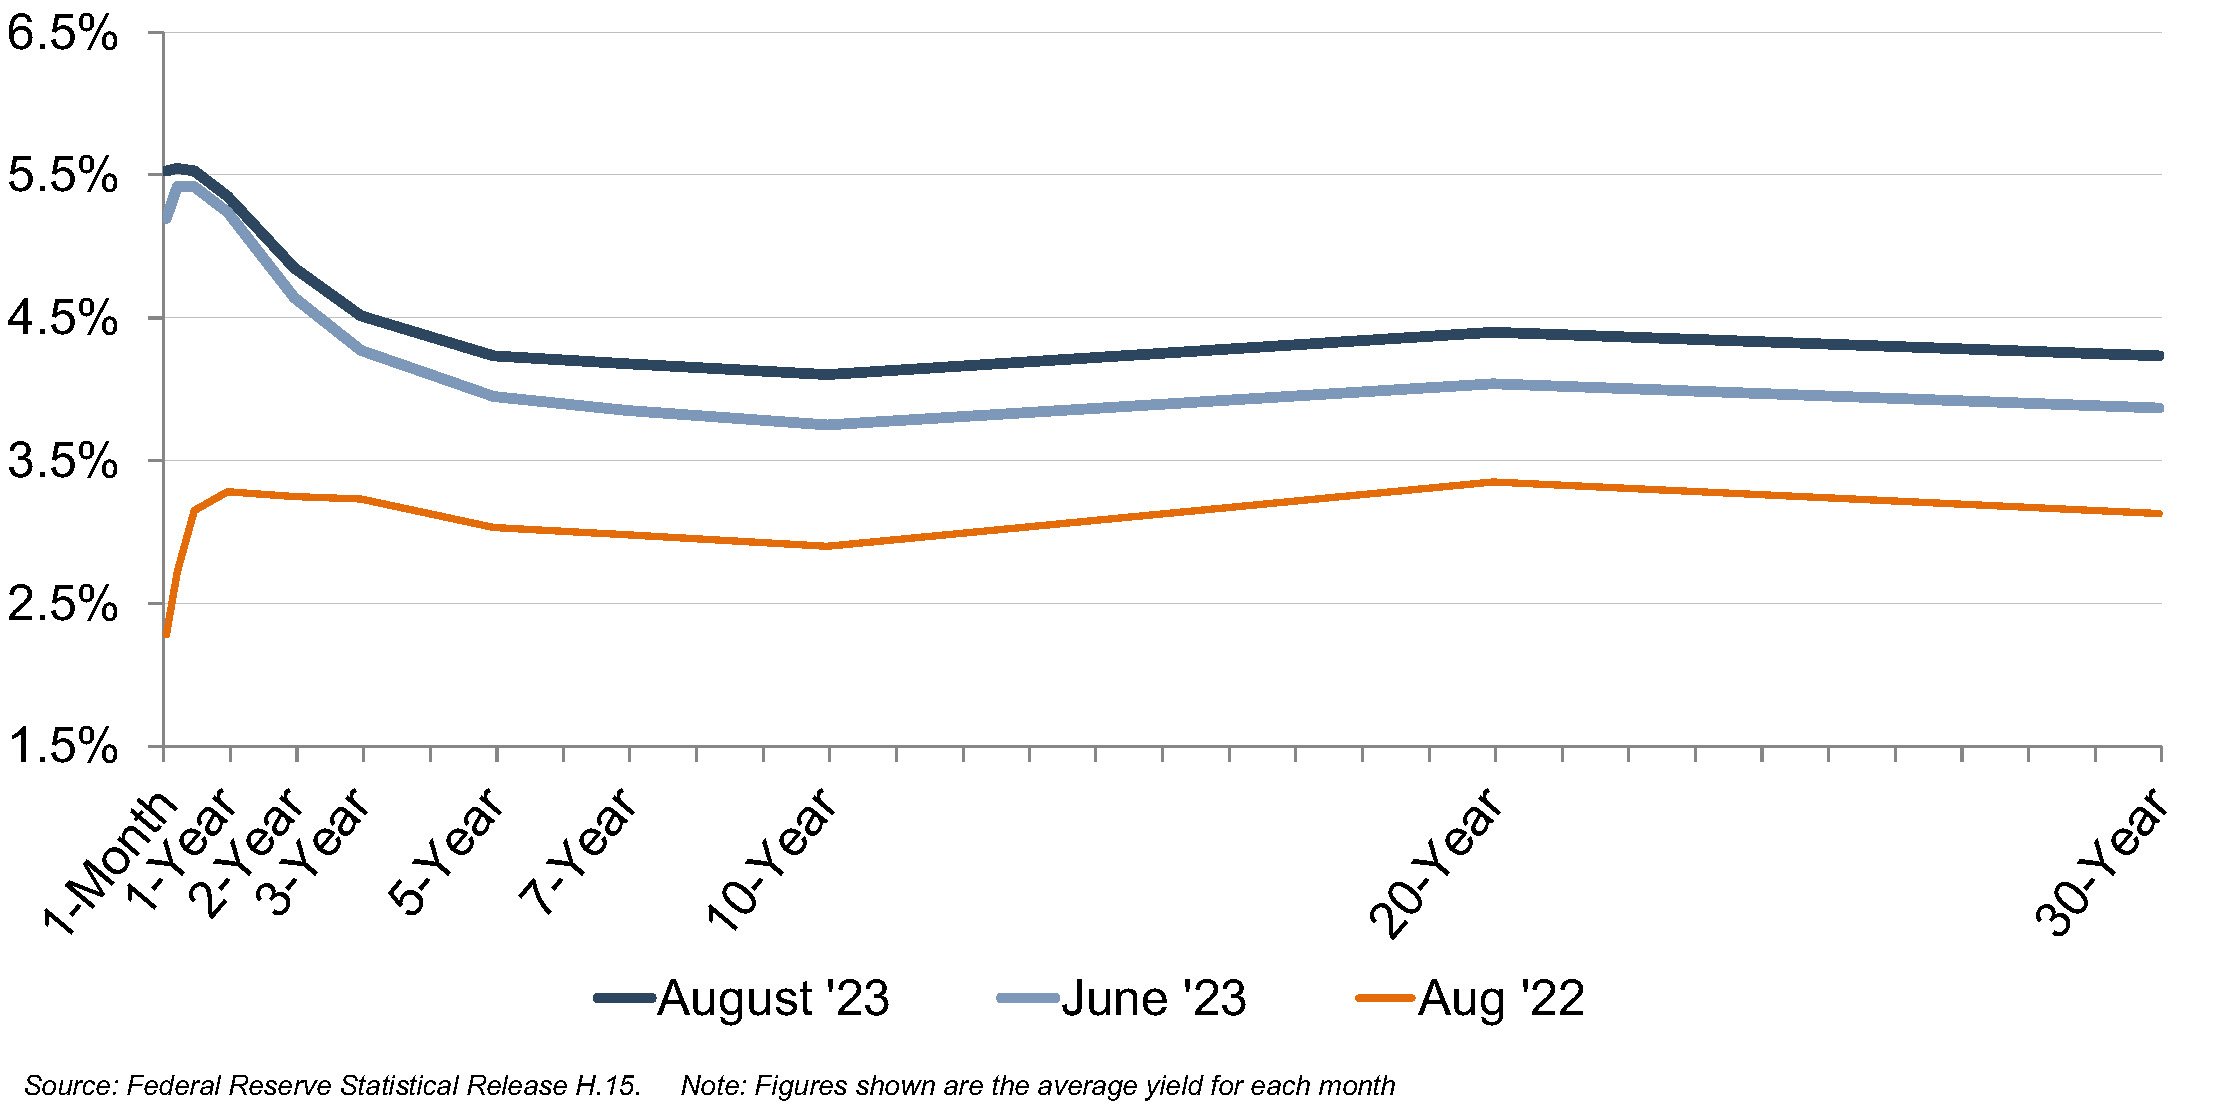
On July 26, 2023, the Federal Reserve increased the target federal funds rate by 25 basis points, capping off a collective increase of 100 basis points year-to-date and 525 basis points since March 2022. While many factors are pertinent to analyzing a deposit base, a significant driver of value is market interest rates.
Figure 1: U.S. Treasury Yield Curve
Trends In CDI Values
Using data compiled by S&P Capital IQ Pro, we analyzed trends in core deposit intangible (CDI) assets recorded in whole bank acquisitions completed from 2000 through mid-August 2023.CDI values represent the value of the depository customer relationships obtained in a bank acquisition.CDI values are driven by many factors, including the “stickiness” of a customer base, the types of deposit accounts assumed, the level of noninterest income generated, and the cost of the acquired deposit base compared to alternative sources of funding.For our analysis of industry trends in CDI values, we relied on S&P Capital IQ Pro’s definition of core deposits.1
In analyzing core deposit intangible assets for individual acquisitions, however, a more detailed analysis of the deposit base would consider the relative stability of various account types. In general, CDI assets derive most of their value from lower-cost demand deposit accounts, while often significantly less (if not zero) value is ascribed to more rate-sensitive time deposits and public funds. Non-retail funding sources such as listing service or brokered deposits are excluded from core deposits when determining the value of a CDI.
Figure 2, summarizes the trend in CDI values since the start of the 2008 recession, compared with rates on 5-year FHLB advances. Over the post-recession period, CDI values have largely followed the general trend in interest rates—as alternative funding became more costly in 2017 and 2018, CDI values generally ticked up as well, relative to post-recession average levels. Throughout 2019, CDI values exhibited a declining trend in light of yield curve inversion and Fed cuts to the target federal funds rate during the back half of 2019. This trend accelerated in March 2020 when rates were effectively cut to zero.
Figure 2: CDI as % of Acquired Core Deposits
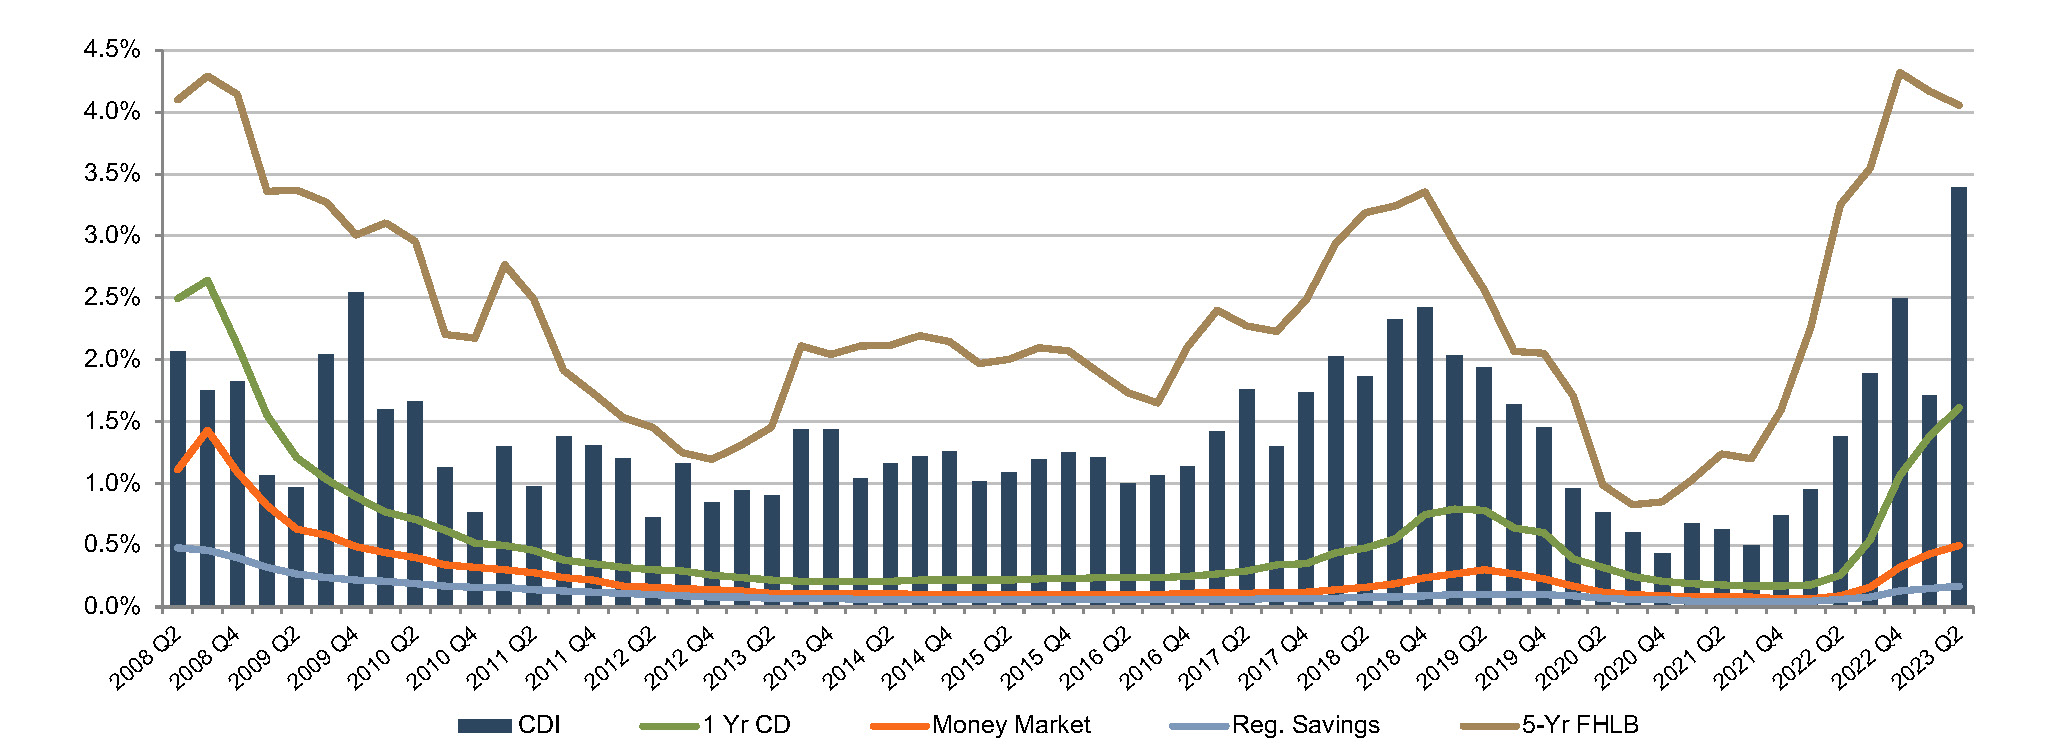
CDI values have increased meaningfully in the past few quarters (with an average CDI value of 171 and 339 basis points for the first and second quarters of 2023, respectively). This compares to 155 basis points for all of 2022 and 64 basis points for all of 2021. Recent values are above the post-recession average of 1.39%, and on par with longer-term historical levels which averaged closer to 2.5% to 3.0% in the early 2000’s.
As shown in Figure 2, reported CDI values have followed the general trend of the increase in FHLB rates. However, the averages from 2023 should be taken with a grain of salt. The chart is provided to illustrate the general directional trend in value as opposed to being predictive of specific indications of CDI value due to the following reasons:
The second quarter average of 3.39% represents the average of just three transactions with somewhat disparate indications of value (5.20%, 2.17%, and 2.81%). Although 24 deals were completed in the second quarter, 21 did not publicly report a core deposit intangible asset value at the time of closing.
For all three second quarter transactions where the CDI value was reported at closing, the value was not updated from the amount estimated by the buyer at the time of the deal’s announcement. Due to the timing lag necessary for completion of independent valuation work, the estimated core deposit intangible value is based on interest rates, deposit cost of funds, and market conditions effective at the time of the announcement of the deals in the fourth quarter of 2022. Since that time, forward interest rates and cost of funds have increased.
Even in times of more robust deal activity, CDI values should be calculated to reflect the individual characteristics of the subject deposit base as opposed to being defined by market averages.
Eleven deals were announced in July and the first half of August, and three of those deals provided either investor presentations or earnings calls containing CDI estimates. These CDI estimates ranged from 3.6% to 4.0%, which is in line with the numbers we have observed in our valuation analyses. We expect CDI values to continue rising in concert with market interest rates. However, market interest rates are not the only driver of CDI value, and there are some potentially mitigating factors to CDI values in the near term.
Figure 3: Median Cost of Funds as Compared to Target Federal Funds Rate
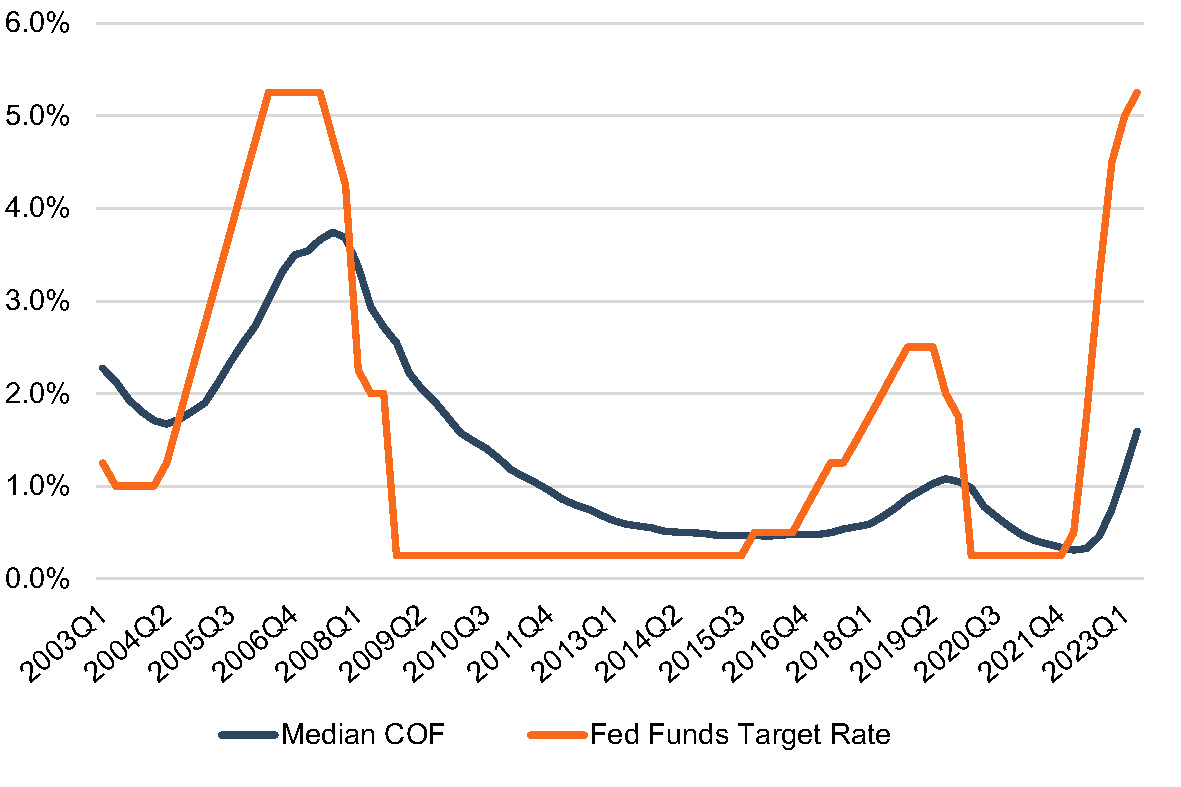
Figure 4: Cost of Funds by Asset Size – 2Q22 to 2Q23
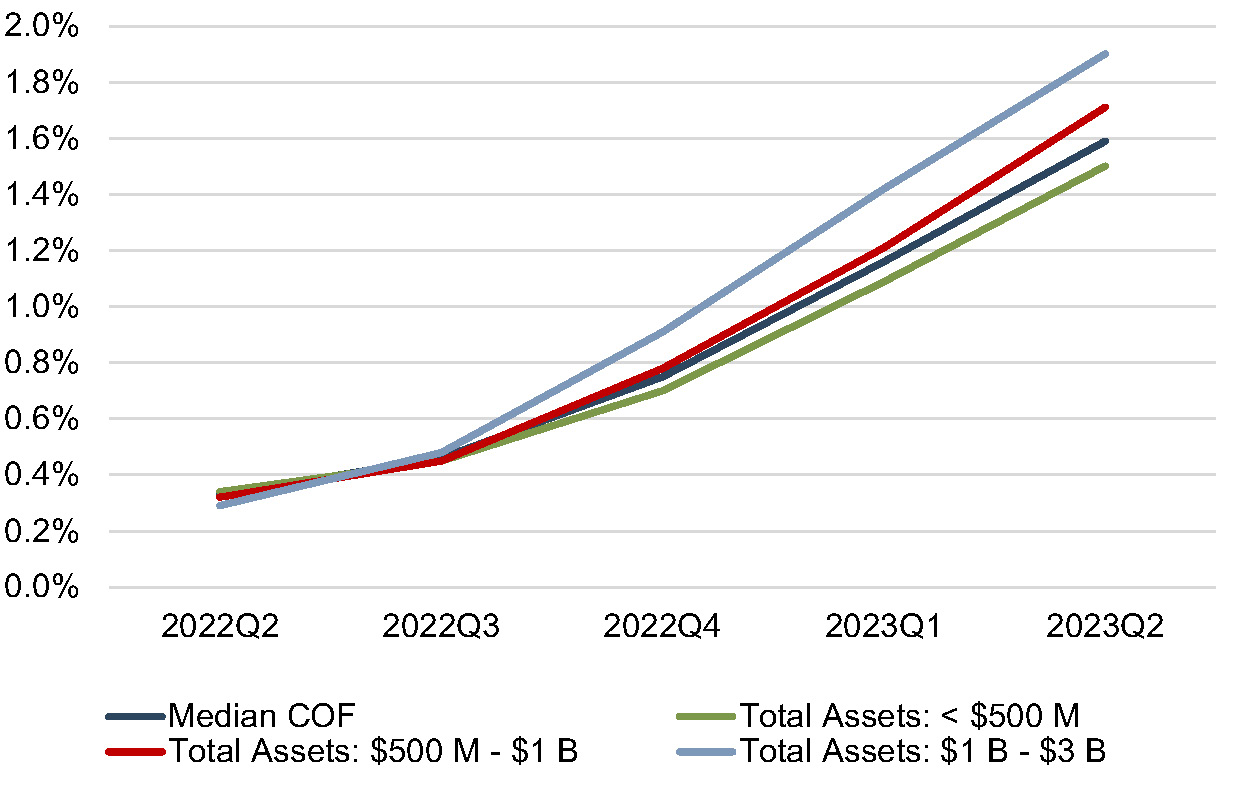
Rising Cost of Funds. Despite increases over the past several quarters, the median industry cost of funds remains well below the averages seen in 2006 and 2007 when the target Federal Funds rate was approximately equal to its current level (Figure 3). Rising deposit interest rates would lead to lower indications of CDI value. Larger banks have had a relatively higher deposit interest rate beta, as evidenced by Figure 4.
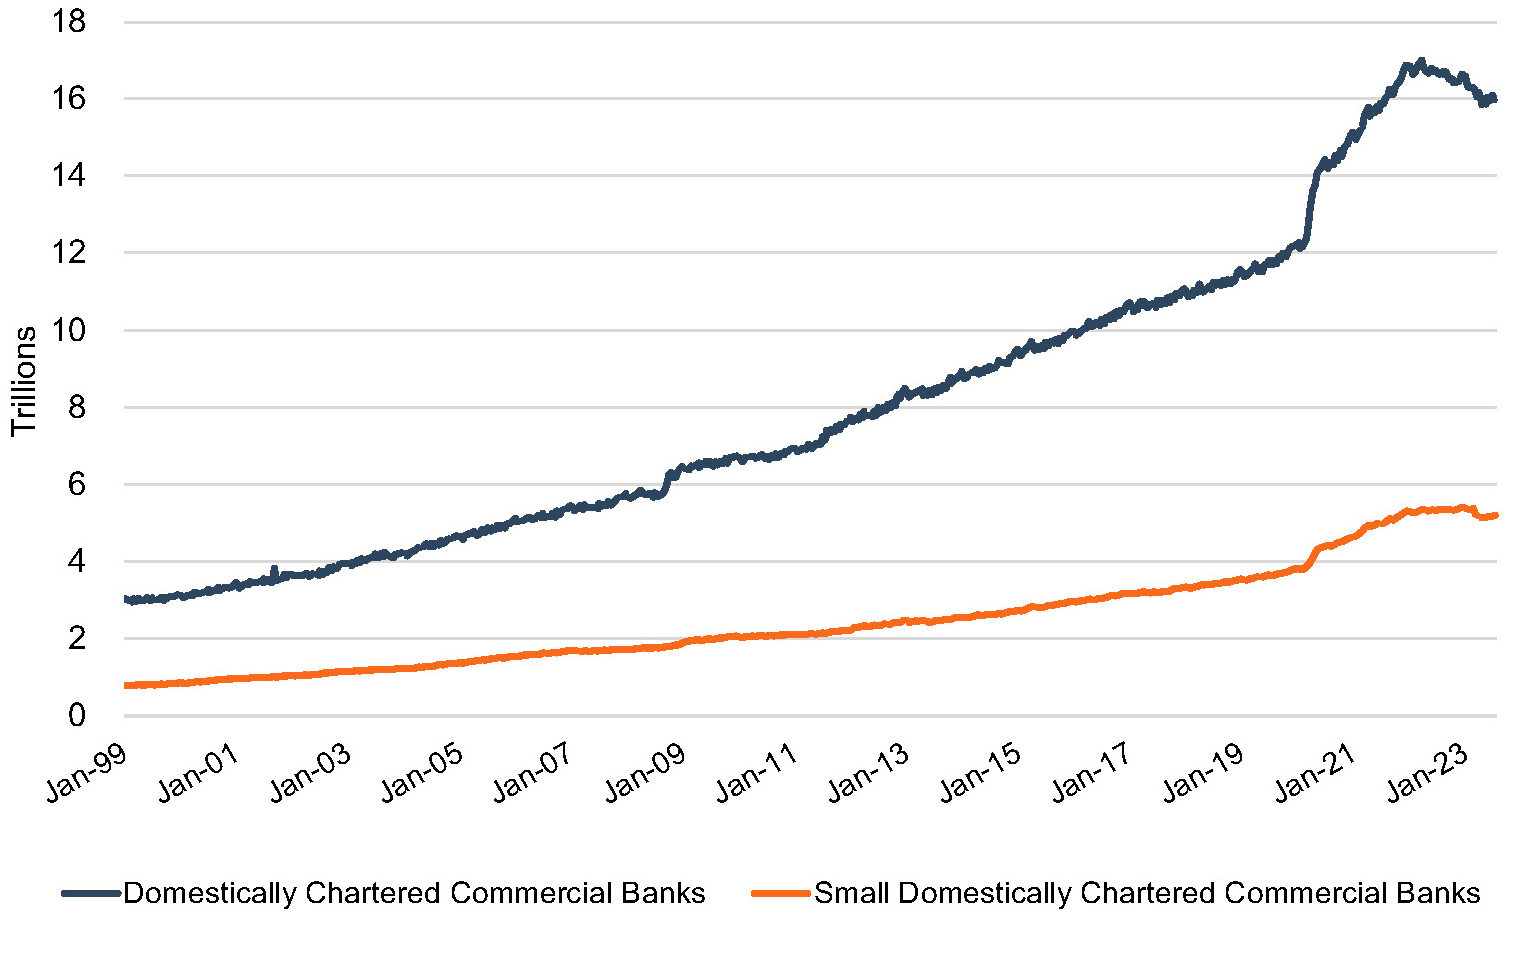
Deposit Levels. Since the beginning of the pandemic, banks have been inundated with deposits. It was initially expected that the increase in deposits would be transient in nature as the economy re-opened, PPP funds were spent or invested, and consumer confidence improved. However, deposit growth continued through 2021 for nearly all banks and into 2022 for some banks. As alternatives to deposit accounts like money market accounts at brokerage firms became more attractive, total industry deposits have finally begun to drop. In 2022, total industry deposits fell 1.1%, the largest annual decline on record.2 Industry deposits at the end of the second quarter of 2023 declined for the fifth consecutive quarter with deposit balances falling by approximately 3.0% and 0.9% in the first and second quarters, respectively. According to S&P Capital IQ Pro’s recent U.S. Bank Outlook Survey, less than half of respondents expect deposits to increase at their organization in the next 12 months. It is perhaps important to note that smaller banks (defined by the Federal Reserve as all banks outside of the top 25 banks in terms of asset size) have not lost deposits at the same rate as the overall banking industry. It remains to be seen whether deposit bases of community banks will be “stickier” long-term than industry averages. All else equal, higher deposit runoff assumptions lead to lower indications of CDI value.
Figure 5: Total Industry Deposits Per Federal Reserve H.8 Release
Uninsured Industry Deposits. One of my favorite Warren Buffet quotes is, “Only when the tide goes out do you discover who’s been swimming naked.” The deposit run on Silicon Valley Bank and its subsequent failure put a spotlight on the unprotected nature of many depositors. With 94% of its deposits uninsured, SVB appeared shockingly naked. According to the FDIC, uninsured deposits increased from approximately 18% of deposits in 1991 to approximately 47% of deposits in 2021. At the end of 2022, less than one percent of all deposit accounts had balances above the $250,000 deposit-limit threshold, but these deposit accounts comprised over 40% of banking industry deposits. While we haven’t historically placed explicit emphasis on the level of uninsured deposits as a detriment in evaluating CDI value, we have considered the magnitude of depositor concentrations and attempted to factor such concentrations into CDI value. Buyers are becoming more cognizant of who’s swimming naked, and from a valuation perspective, it is worth considering the risk inherent in a deposit base from a high ratio of uninsured deposits or other significant deposit concentrations. Whether the risk is accounted for with a higher runoff assumption, a higher discount rate, or even removing some concentrations of deposits from the analysis as “non-core” is arguable, but an analysis that ignores this entirely could be considered deficient.
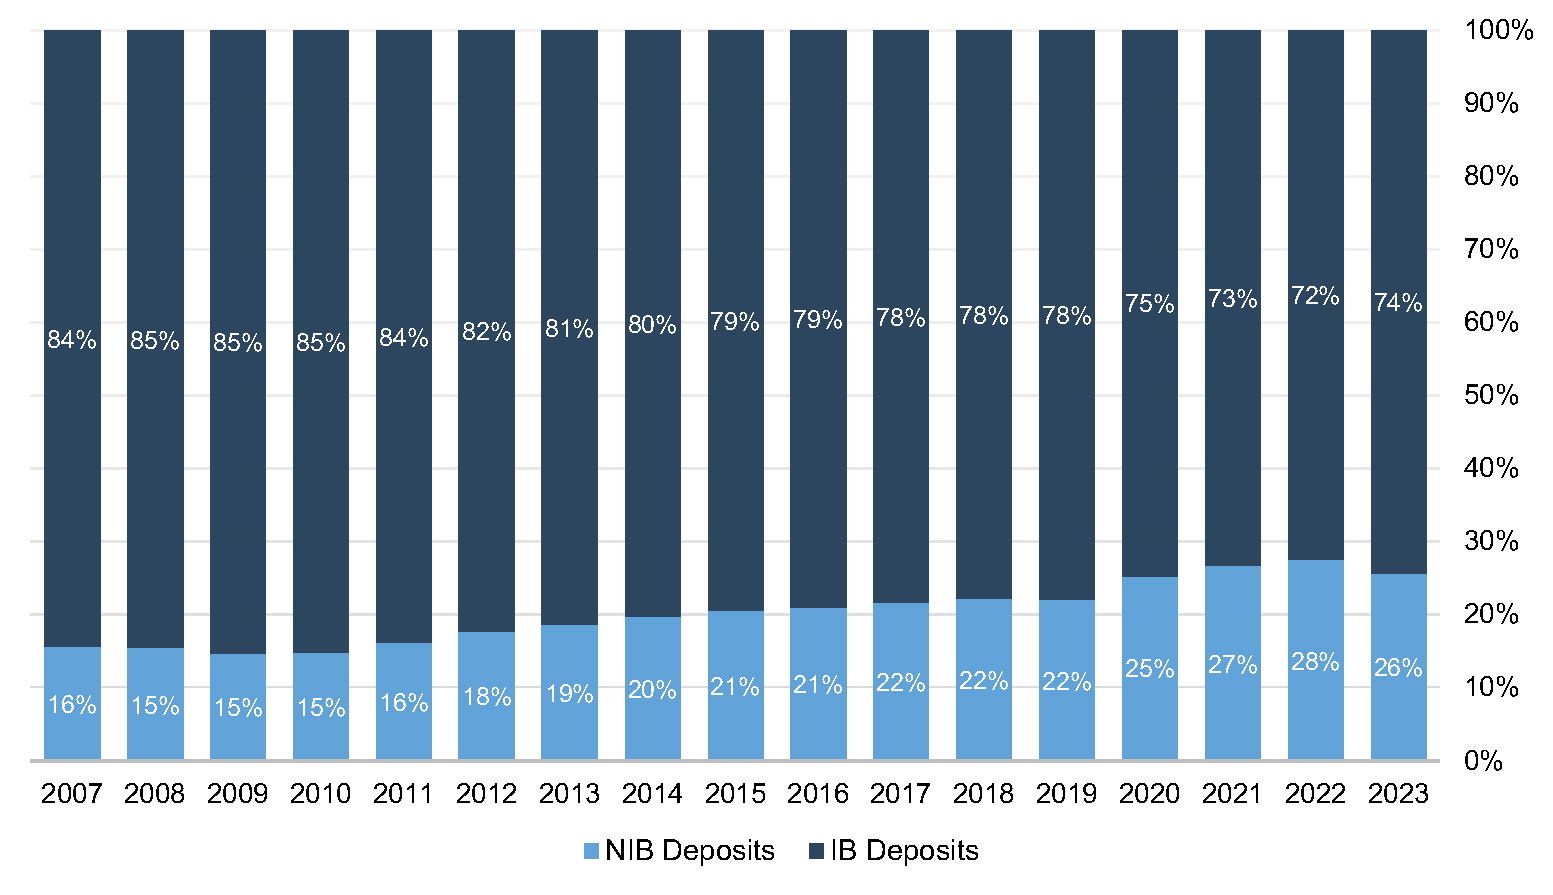
Deposit Mix and Deposit Beta. Over the past decade, nationwide average deposit mix has shifted in favor of noninterest bearing deposits. In 2023, we see this trend beginning to reverse. The deposit mix is likely to continue shifting in favor of interest-bearing deposits that have lower CDI values. Theoretically, noninterest-bearing deposits have an interest rate beta of zero. While that’s true, an evaluation of a deposit base must consider the likelihood that a dollar of non-interest-bearing demand deposits will remain a dollar of deposits that does not demand interest income.It isn’t enough to consider that interest rates will rise only for interest-bearing accounts. One must also factor in the likelihood that balances will shift into interest-bearing accounts. A remixing of deposit balances to historical norms is likely to intensify the effect of rising rates.
Figure 6: Deposit Mix Over Time
Uncertain Rate Outlook. While rates have risen substantially over the past 18 months, and may continue rising in the near-term, some market participants remain concerned that a zero rate environment will persist as the long-term norm. If this view is correct, which implicitly assumes that the Federal Reserve can choke inflation, CDI values may level off or decline.
Other Factors. More details within the deposit trial balance tend to provide more meaningful indications of depositor value – and this is especially important to consider on the front end of a deal. When possible, we like to see a customer relationship identifier, information on industry concentrations, more granular detail on account types, several years of deposit history, demographic details surrounding customer age and location, and average account balances over time. Admittedly, this level of detail is not always feasible due to data limitations, but more detail contributes to a more comprehensive “story” of the deposit base. Before you can value the core deposit intangible asset, you need to begin by ascertaining which accounts and balances are “core”.Furthermore, sometimes a particular relationship might be core, but some or most of its balances at a particular point in time might not be. In an environment where rising interest rates are yielding record-high CDI values, it is more important than ever to understand the underlying deposit base.
Service Charge Income and FDIC Assessments.Given push back from regulators and the public, the industry is facing pressure to reduce overdraft charges and other fees. Lower service charge income produces lower CDI values, all else equal.FDIC assessments related to an increased burden from bailouts would increase the expense burden of a deposit base and produce lower CDI values, all else equal. However, it appears that the burden of covering the Deposit Insurance Fund’s losses from the 2023 bank failures will fall upon the largest banks.
Trends In Deposit Premiums Relative To CDI Asset Values
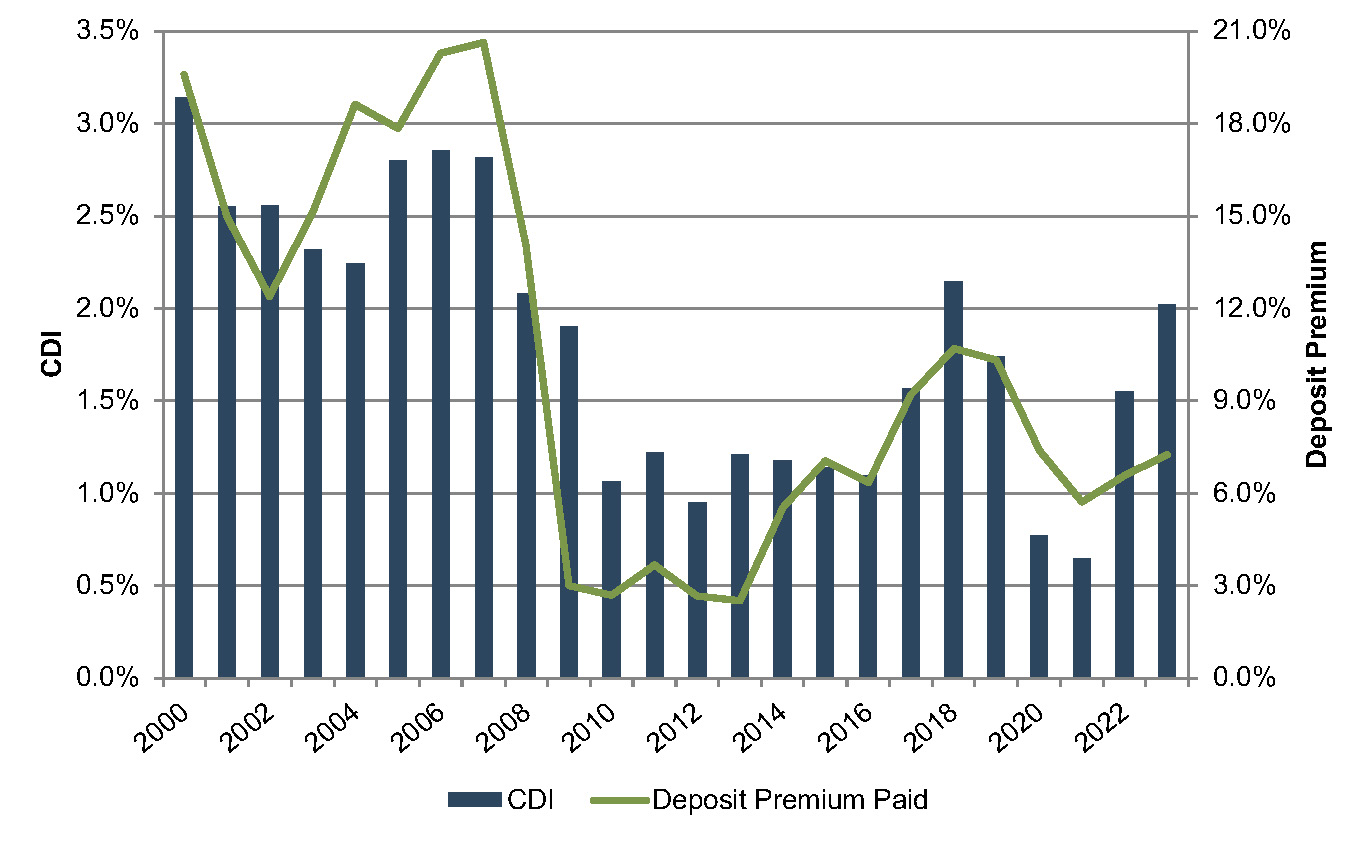
Core deposit intangible assets are related to, but not identical to, deposit premiums paid in acquisitions. While CDI assets are an intangible asset recorded in acquisitions to capture the value of the customer relationships the deposits represent, deposit premiums paid are a function of the purchase price of an acquisition. Deposit premiums in whole bank acquisitions are computed based on the excess of the purchase price over the target’s tangible book value, as a percentage of the core deposit base. While deposit premiums often capture the value to the acquirer of assuming the established funding source of the core deposit base (that is, the value of the deposit franchise), the purchase price also reflects factors unrelated to the deposit base, such as the quality of the acquired loan portfolio, unique synergy opportunities anticipated by the acquirer, etc. As shown in Figure 7, deposit premiums paid in whole bank acquisitions have shown more volatility than CDI values. Deposit premiums in the range of 6% to 10% remain well below the pre-Great Recession levels when premiums for whole bank acquisitions averaged closer to 20%.
Figure 7: CDI Recorded vs. Deposit Premium
Additional factors may influence the purchase price to an extent that the calculated deposit premium doesn’t necessarily bear a strong relationship to the value of the core deposit base to the acquirer. This influence is often less relevant in branch transactions where the deposit base is the primary driver of the transaction and the relationship between the purchase price and the deposit base is more direct. Figure 8 presents deposit premiums paid in whole bank acquisitions as compared to premiums paid in branch transactions.
Figure 8: Average Deposit Premiums Paid
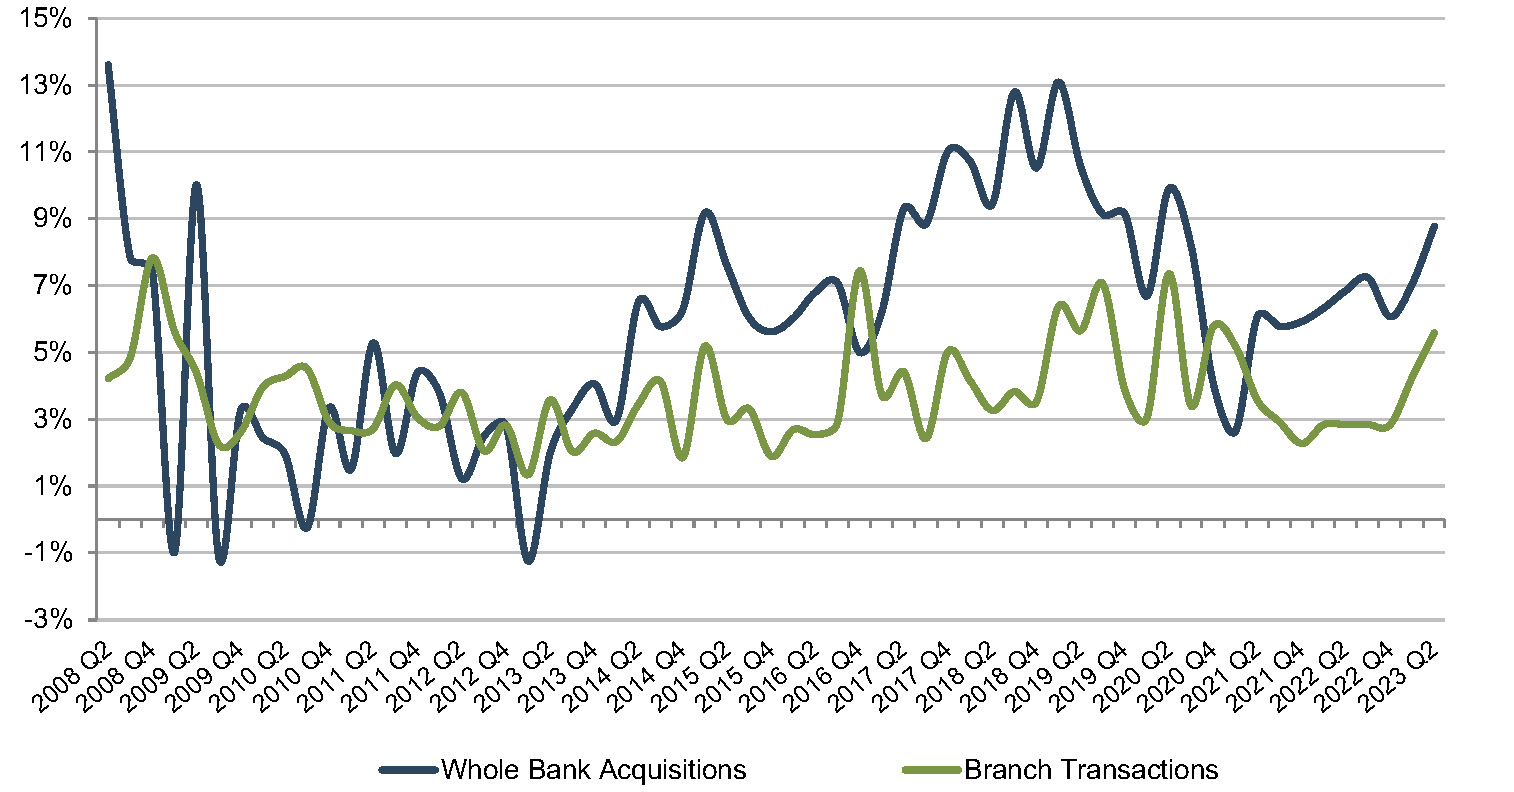
Deposit premiums paid in branch transactions have generally been less volatile than tangible book value premiums paid in whole bank acquisitions. Only four branch transactions with reported premium data have occurred year-to-date in 2023. For those transactions, the deposit premiums ranged from 2.0% to 6.0%. The lack of branch transactions, though, is indicative of their value. With high short-term funding costs and tight liquidity, few banks are willing to part with stable, low cost core deposits.
Accounting For CDI Assets
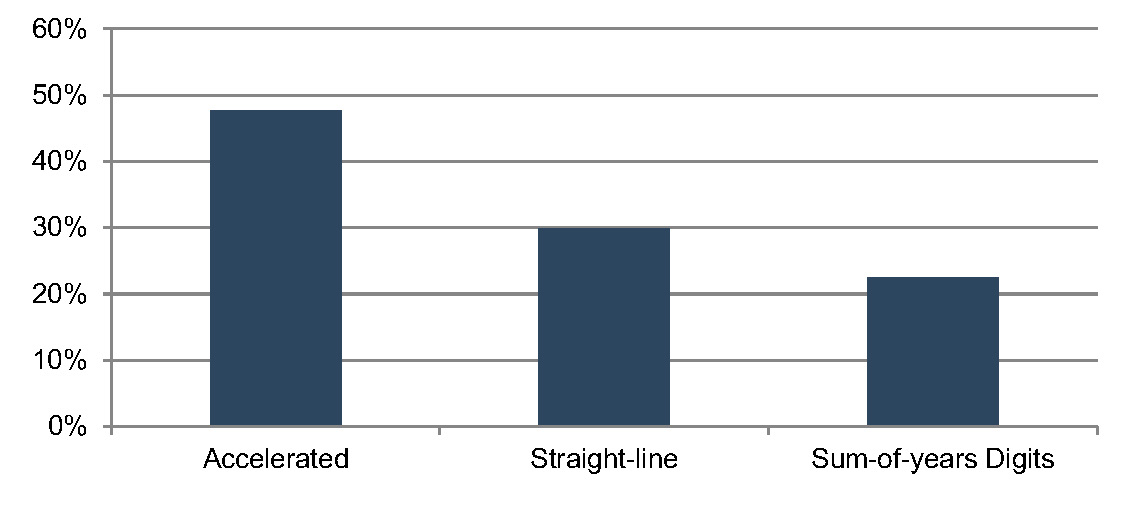
Based on the data for acquisitions for which core deposit intangible detail was reported, a majority of banks selected a ten-year amortization term for the CDI values booked. Less than 10% of transactions for which data was available selected amortization terms longer than ten years. Amortization methods were somewhat more varied, but an accelerated amortization method was selected in approximately half of these transactions.
Figure 9: Selected Amortization Term (Years)
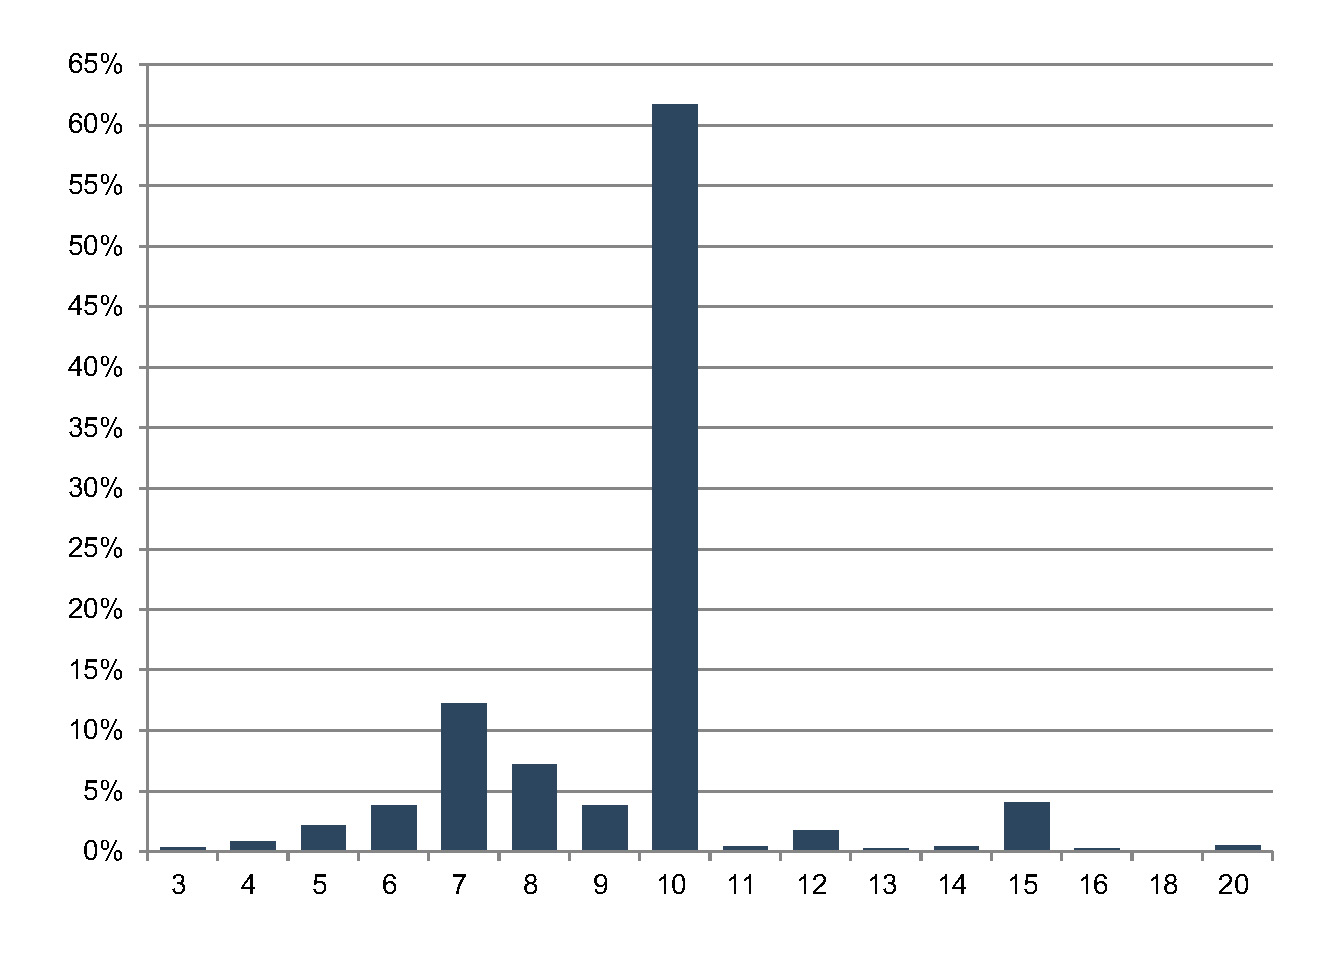
Figure 10: Selected Amortization Method
For more information about Mercer Capital’s core deposit valuation services, please contact us.
1 S&P Capital IQ Pro defines core deposits as, “Deposits in U.S. offices excluding time deposits over $250,000 and brokered deposits of $250,000 or less.”
2 Defined by the Federal Reserve as domestically chartered commercial banks.
Originally appeared in the August 2023 issue of Bank Watch.