Viewed from the prism of “fairness” in which a transaction is judged to be fair to shareholders from a financial point of view, many transactions are reasonable; some are very fair; and some are marginally fair. Transactions that are so lopsided in favor of one party should not occur absent a breach of corporate duties by directors (i.e., loyalty, care and good faith), bad advice, or other extenuating circumstances. Obtaining competent financial advice is one way a board exercises its duty of care in order to make an informed decision about a significant corporate transaction.
The primary arbiter of fairness is the value of the consideration to be received or paid relative to indications of value derived from various valuation methodologies. However, the process followed by the board leading up to the transaction and other considerations, such as potential conflicts, are also important in the context of “entire” fairness.
A tough fairness call can occur when a transaction price appears to be low relative to expectations based upon precedent transactions, recent trading history, management prognostications about a bright future, and/or when the value of the consideration to be received is subject to debate. The pending acquisition of commercial finance lender NewStar Financial, Inc. (“NewStar”; Nasdaq-NEWS) is an example where the acquisition price outwardly seems to be low, at least until other factors are considered.
NewStar Example
On October 16, 2017, NewStar entered into a merger agreement with First Eagle Holdings, Inc. (“First Eagle”) and an asset purchase agreement with GSO Diamond Portfolio Holdco LLC (“GSO”). Under the merger agreement, NewStar will be acquired by First Eagle for (a) $11.44 per share cash; and (b) non-transferable contingent value rights (“CVR”) that are estimated to be worth about $1.00 per share if the transaction closes before year-end and $0.84 per share if the transaction closes in 2018. The CVR reflects the tax benefit associated with the sale of certain loans and investments at a discount to GSO for $2.37 billion.
Also of note, the investment management affiliate of First Eagle is majority owned by an entity that is, in turn, partially owned by Corsair Capital LLC, which is the largest shareholder in NewStar with a 10.3% interest.
Acquisition Price
As shown in Figure 1, the acquisition price including all of the CVR equates to 83% of tangible book value (“TBV”), while the market premium is nominal. Although not relevant to the adequacy of the proposed pricing, NewStar went public in late 2006 at $17.00 per share then traded to around $20 per share in early 2007 before sliding to just about $1.00 per share in March 2009.
![]()
“Feel” is a very subjective term; nonetheless the P/TBV multiple that is well below 100%, when combined with the nominal market premium, feels light. NewStar is not a troubled lender. Non-performing assets the past few years have been in the vicinity of 3% of loans, while net charge-offs have approximated 1% other than 2015 when losses were negligible. Further, the implied haircut applied to the loans and investments that will be acquired by GSO is modest.
Transaction Multiples
While the P/TBV multiple for the transaction is modest, the P/E multiple is not at 26.5x (the latest twelve month (“LTM”) earnings) and 18.4x (the consensus 2018 estimate). The P/E could be described as full if NewStar were an average performing commercial bank and very full if it was a typical commercial finance company in which low teen P/Es are not unreasonable.
What the P/TBV multiple versus the P/E multiple indirectly states is that NewStar has a low ROE, which has been less than 5% in recent years. The culprit is a highly competitive market for leveraged loans, a high cost of funds absent cheap bank deposit funding and perhaps excess capital. Nonetheless, management’s projections incorporated into the recently filed proxy statement project net income and ROE will double from $20 million/3% in the LTM period ended September 30 to $41 million/6% in 2020.
In spite of a doubling of projected net income, the present value (assuming NewStar is worth 18.4x earnings in 2020 discounted to September 30 at a discount rate of 13%) is about $507 million, or about the same as the current transaction value to shareholders. Earnings forecasts are inherently uncertain, but one takeaway is that the P/TBV multiple does not appear so light in the context of the earnings forecast.
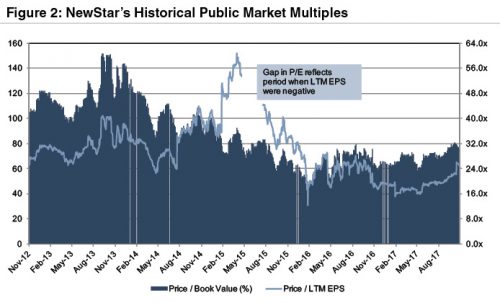
Additional perspective on the transaction multiples is provided in Figure 2 in which NewStar’s P/TBV multiple based upon its public market price consistently has been below 100% the last several years while the P/E has been around 20x or higher due to weak earnings.
Performance and Timing
As for the lack of premium there outwardly did not appear to be wide-spread expectation that a transaction was imminent (as was thought possible in 2013 when Bloomberg reported the company was shopping itself). There were no recent media reports; however, the shares fell by 17% between May 2–May 19 following a weak first quarter earnings report. The shares subsequently rebounded 19% between June 6–June 14. Both the down and then up moves were not accompanied by heavy volume. Trading during most of this time frame fell below the approximate 100 thousand daily average shares.
Measured from June 14–October 17, the day after the announcement, NewStar’s shares rose about 10% compared to 8% for the SNL Specialty Finance Index. Measured from May 19, when the shares bottomed following the weak first quarter results the shares rose 34% compared to 12% for the index through October 17. The market premium relative to recent trading was negligible, but it is conceivable some premium was built into the shares for the possibility of a transaction given the sharp rebound during mid-June when negotiations were occurring.
Other Support for the Transaction
Further support for the transaction can be found in the exhaustive process that led to the agreements as presented in the proxy statement. The proxy confirmed the Bloomberg story that the board moved to market the company in 2013. Although its investment bankers contacted 60 potential buyers, only two preliminary indications of value were received, in part because U.S. banking regulators tightened guidelines in 2013 related to leverage lending by commercial banks. The two indications were later withdrawn.
During 2016 discussions were held with GSO regarding a going-private transaction, in addition to meetings with over 20 other parties to solicit their interest in a transaction. By the spring of 2017, consideration of a going-private transaction was terminated. Discussions then developed with First Eagle/GSO, Party A and Party B that eventually led to the announced transaction. Given the experience of trying to sell NewStar in 2013 and go private in 2016, the board elected not to broaden the marketing, calculating the most likely bidders would be alternative asset managers (vs. banks with a low cost of funding).
Fairness considerations about the process were further strengthened through a “go-shop” provision in the merger agreement that provided for a 30-day “go-shop” period in which alternative offers could be solicited. If a superior offer emerged and the agreements with First Eagle and GSO were terminated a modest termination fee of $10 million (~2.5%) would be owed. Conversely, if NewStar terminates because GSO cannot close, then a $25 million termination fee will be owed to NewStar.
The go-shop provision was activated, but to no avail. More than 50 parties were contacted and seven other unsolicited inquiries were received. NewStar entered into confidentiality agreements with 22 of the parties, but no acquisition proposals were received.
Financial Advisors
Other elements of the agreements that are notable for a fairness opinion include the use of two financial advisors, financing, and director Thornburgh, who was recused from the deliberations given his association with 10% shareholder Corsair, which holds, with Blackstone, a majority interest in First Eagle. Financing was not a condition to close on the part of the buyers because GSO secured $2.7 billion of debt and equity capital to finance the asset purchase. First Eagle will use excess funds from the asset purchase and existing available cash to fund the cash consideration to be paid at closing to NewStar shareholders. While two financial advisors cannot make an unfair deal fair, the use of two here perhaps gave the board additional insight that was needed given the four-year effort to sell, take the company private, or affect some other corporate action to increase value.
The Lesson from the NewStar Example
While the transaction price for NewStar seems low, there are other factors at play that bear consideration. When reviewing a transaction to determine if it is fair from a financial viewpoint, a financial advisor has to look at the entire transaction in context. Some shareholders will, of course, focus on one or two metrics to support a view that is counter to the board’s decision.
Conclusion
Every transaction has its own nuances and raison d’etre whether the price “feels right” or not. Mercer Capital has significant experience helping boards sort through valuation, process and other issues to determine what is fair (or not) to shareholders from a financial point of view. Please call if we can help your board make an informed decision.
Originally published in Mercer Capitals Portfolio Valuation: Private Equity Marks Newsletter: Fourth Quarter 2017