After the twin shocks of rapidly rising interest rates in 2022 and regional bank failures in 2023, community and regional bank stocks finally staged a recovery in 2024. The S&P Small Cap Bank index appreciated by 15% in 2024 (see Figure 1) but nevertheless remains 4% below the level at year-end 2021. Mid-cap and large-cap banks outperformed small-cap banks, which is attributable to expectations of better net interest margin performance, M&A opportunities, and capital markets activity among the largest banks.
Figure 1
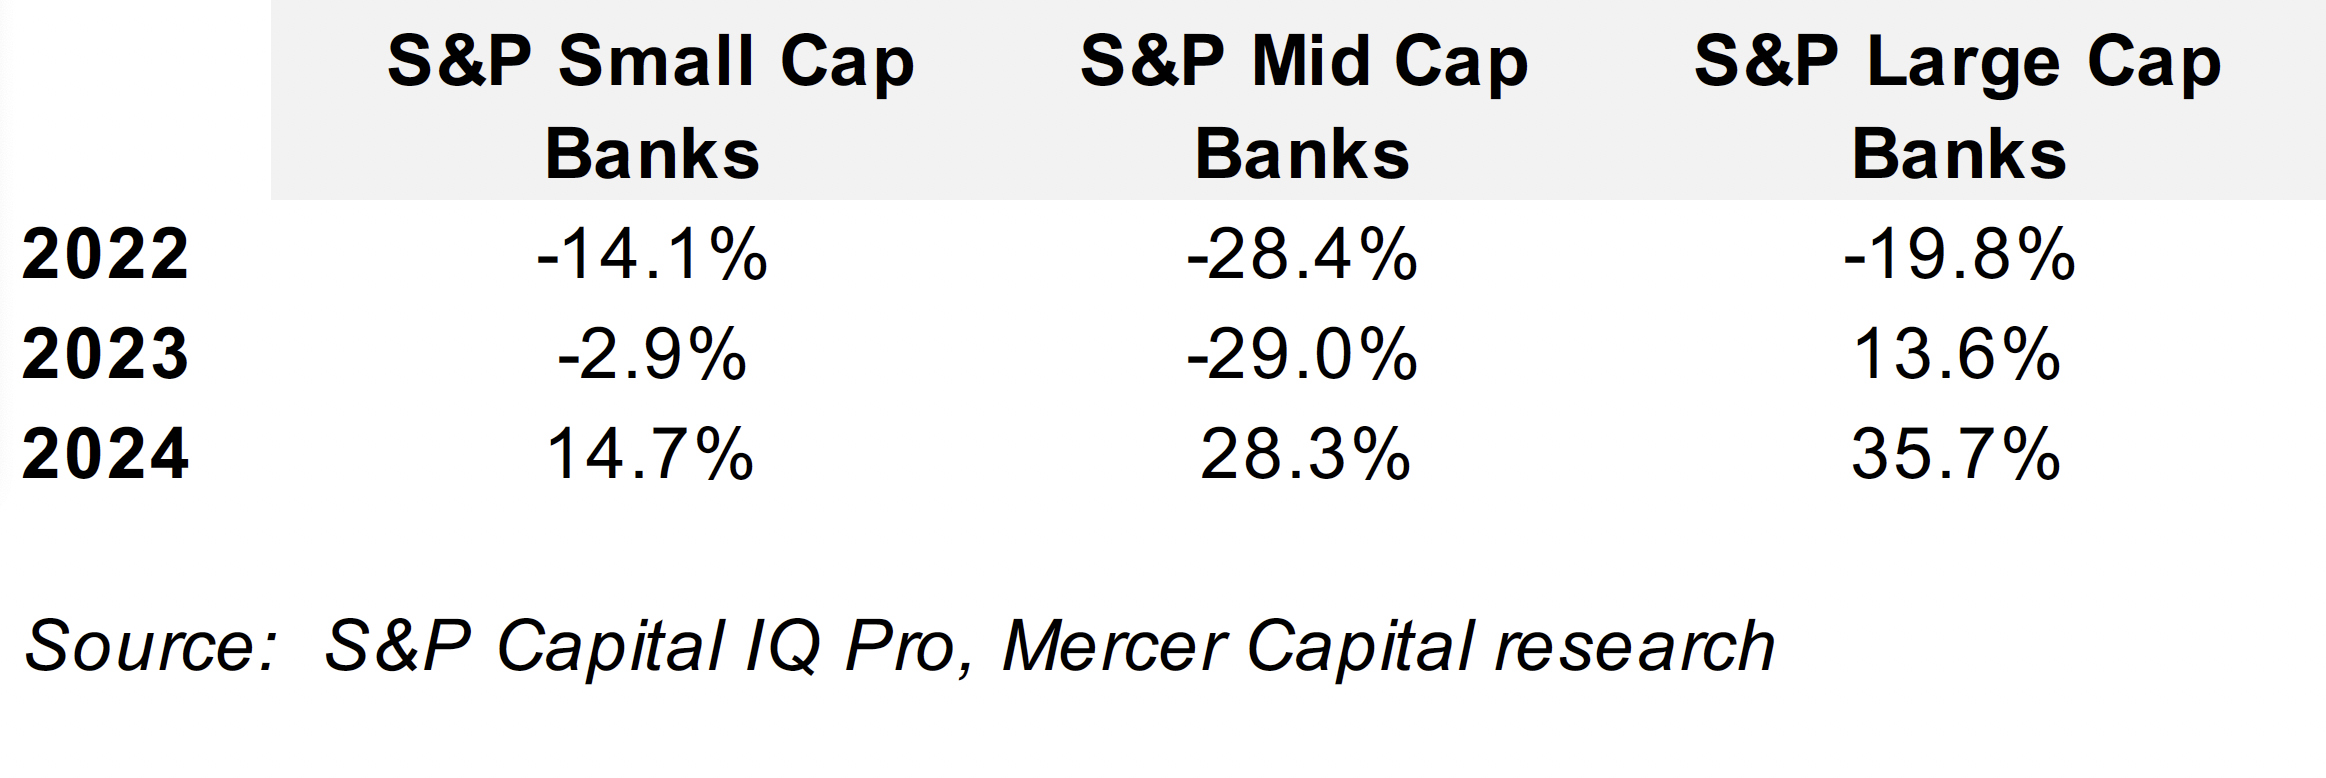
Figure 2 provides a stratification of bank stock price changes. In our year-end 2023 bank stock performance recap, we noted that 36% of banks experienced year-over-year stock price appreciation in 2023. This improved to 74% of banks in 2024. The median bank reported share price appreciation of 12% in 2024. Index returns occasionally can be biased by unusual factors influencing component companies, such as the bank failures in 2023. Focusing on the change in share price performance for the median bank provides another perspective.
Figure 2
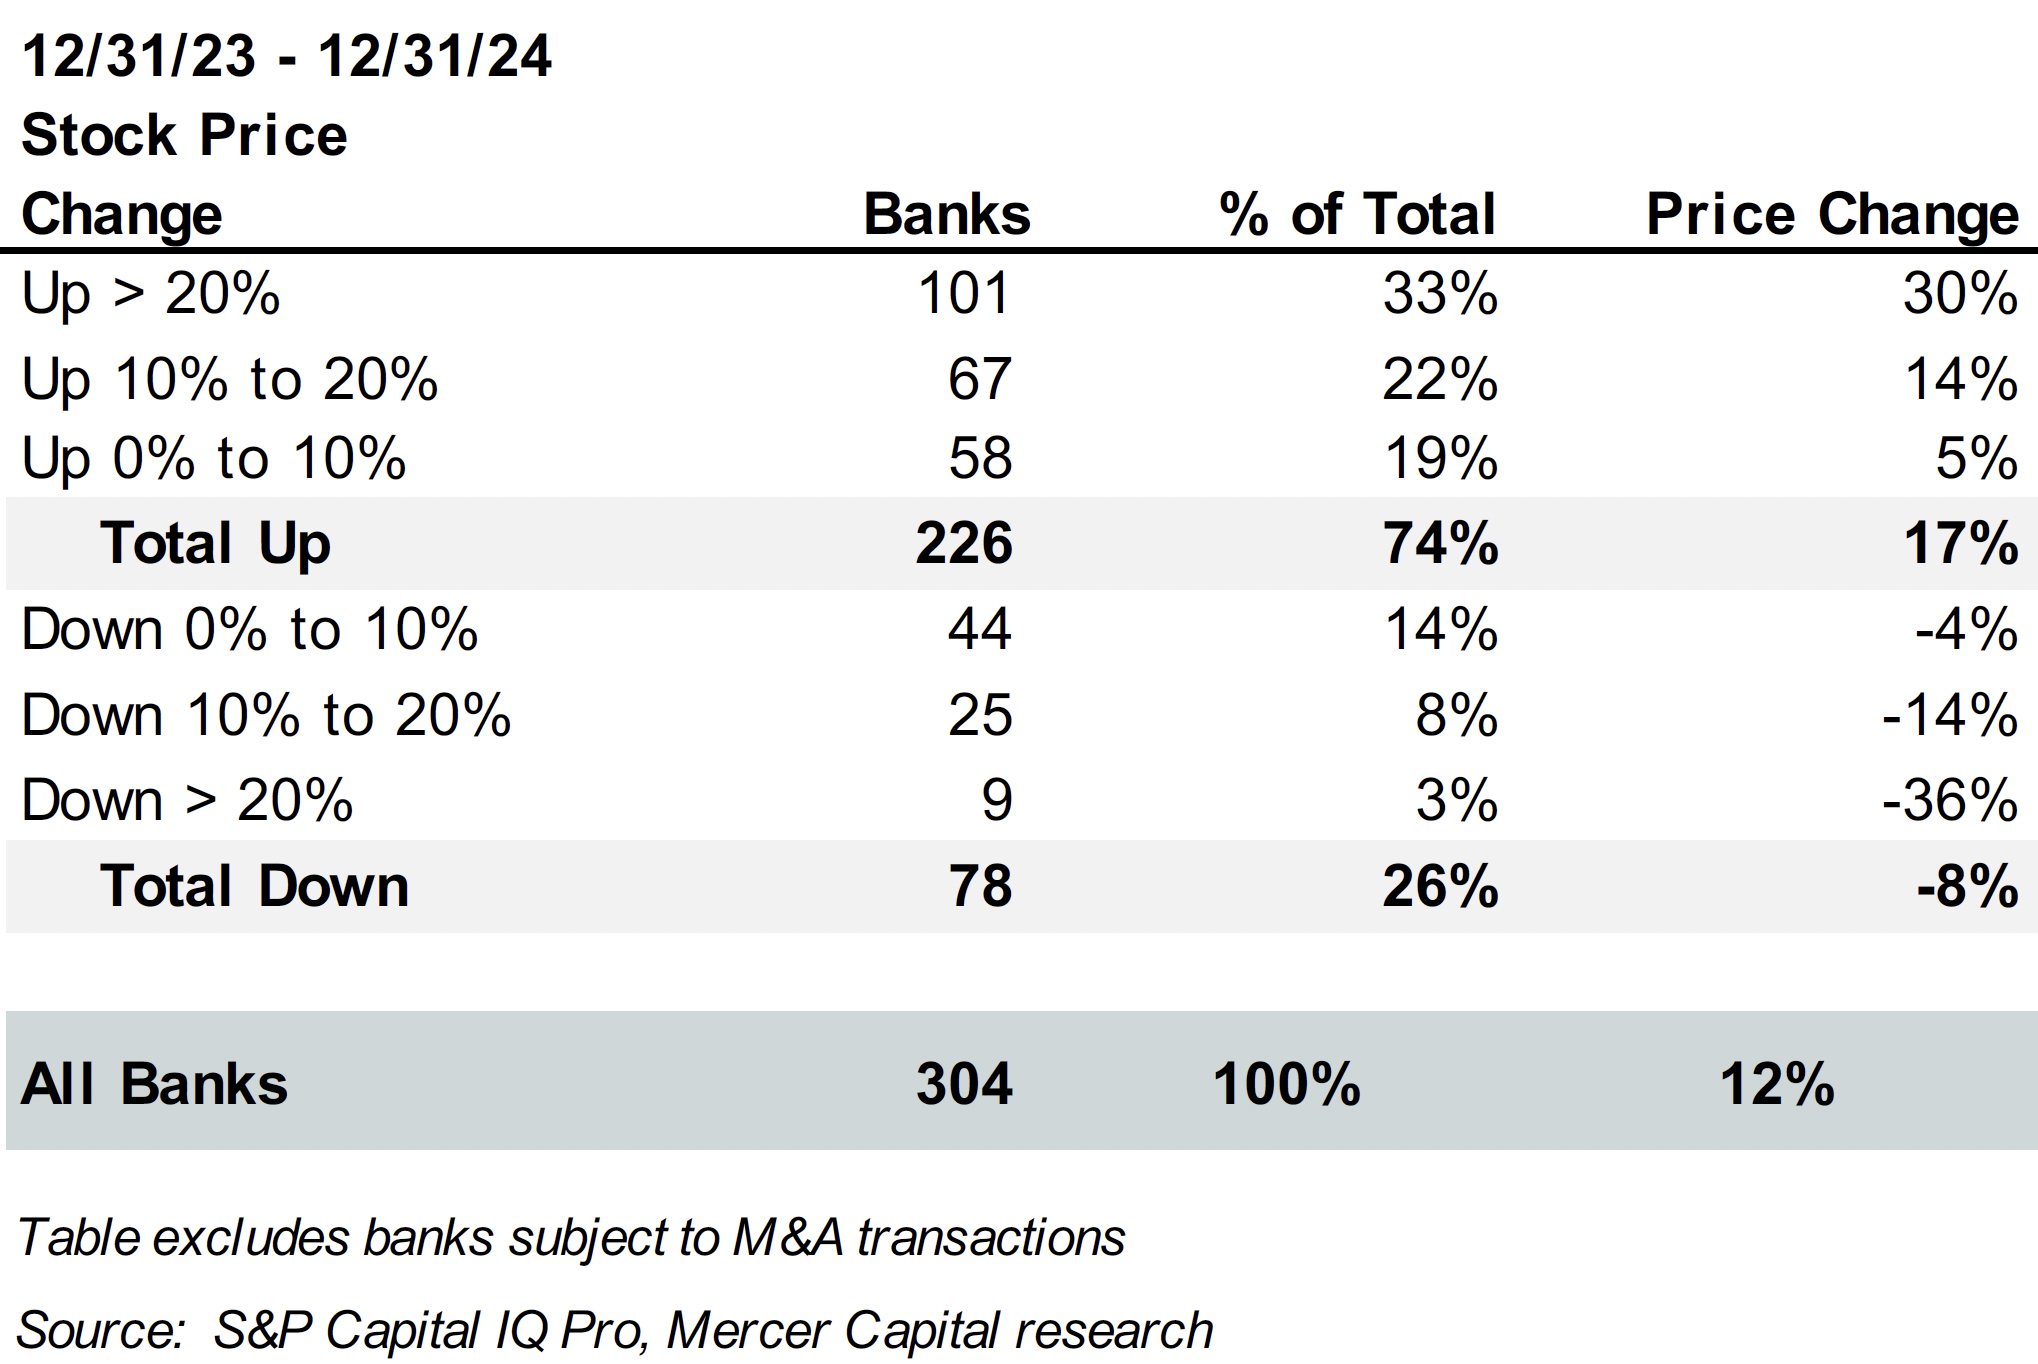
Figure 3 illustrates stock price performance in 2024, as stratified by asset size. Nearly all banks with assets over $100 billion (95% of all such banks) reported positive share price appreciation in 2024, with a median appreciation of 28%. For the very largest banks, this reflects the strength of their capital markets businesses, which performed well in 2024 due to both a strong backdrop for trading and capital raising while M&A advisory was better vs 2023 but not booming. The outlook for 2025 assumes the deregulatory inclination of the Trump Administration will support the large banks’ consumer units and M&A advisory fees as corporate M&A presumably increases.
Figure 3
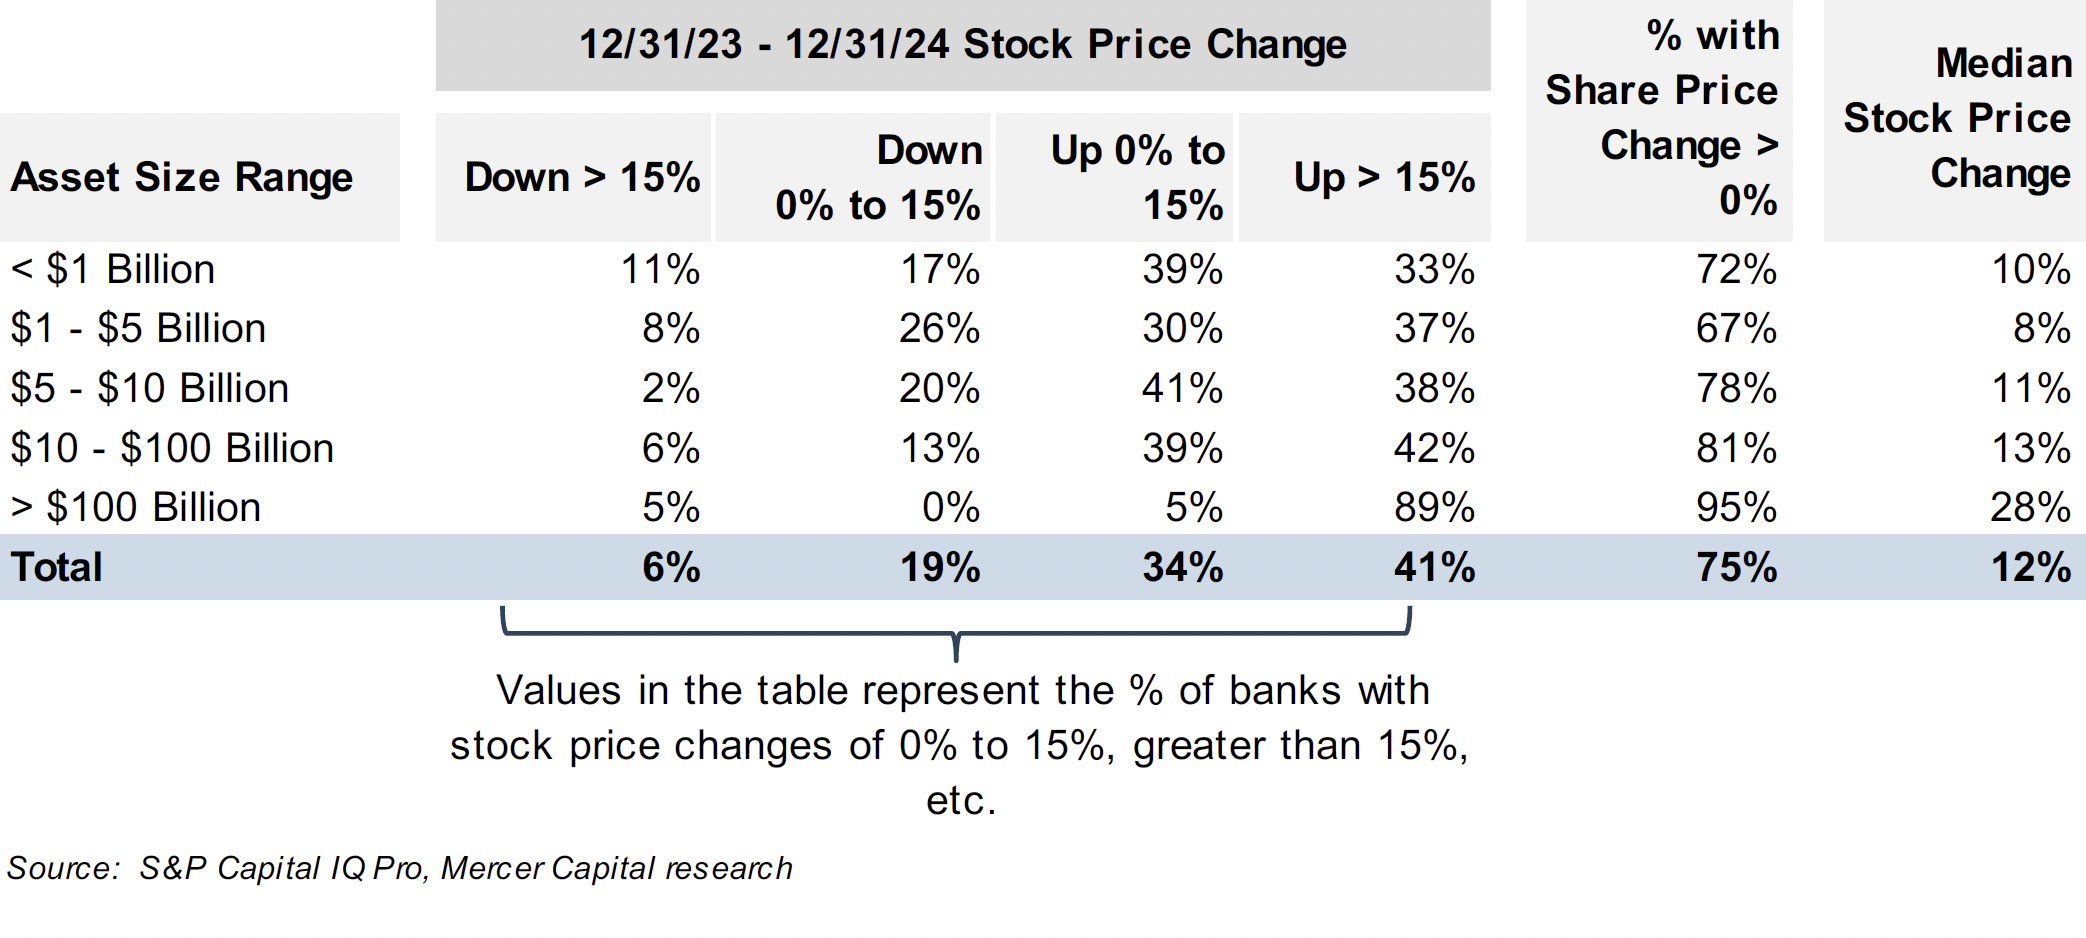
Banks with assets below $5 billion reported weaker performance, with approximately 70% reporting higher stock prices at year-end 2024 and a median share price change of 8% to 10%. Margin compression remained a challenge for many banks in this group, and many are burdened with low yielding assets that will constrain their 2025 net interest margin and return on assets.
Figure 4 repeats the analysis in Figure 3 but covers the entire rising rate cycle, beginning from year-end 2021. Despite significant capital accumulation over this period, the median bank reported a share price change of exactly 0%. It is notable that this period of weak performance occurred in the absence of significant credit costs. In one sense, bank investors are fortunate, as adding higher credit costs to a period marked by significant NIM pressure would have been much more stressful.
Figure 4
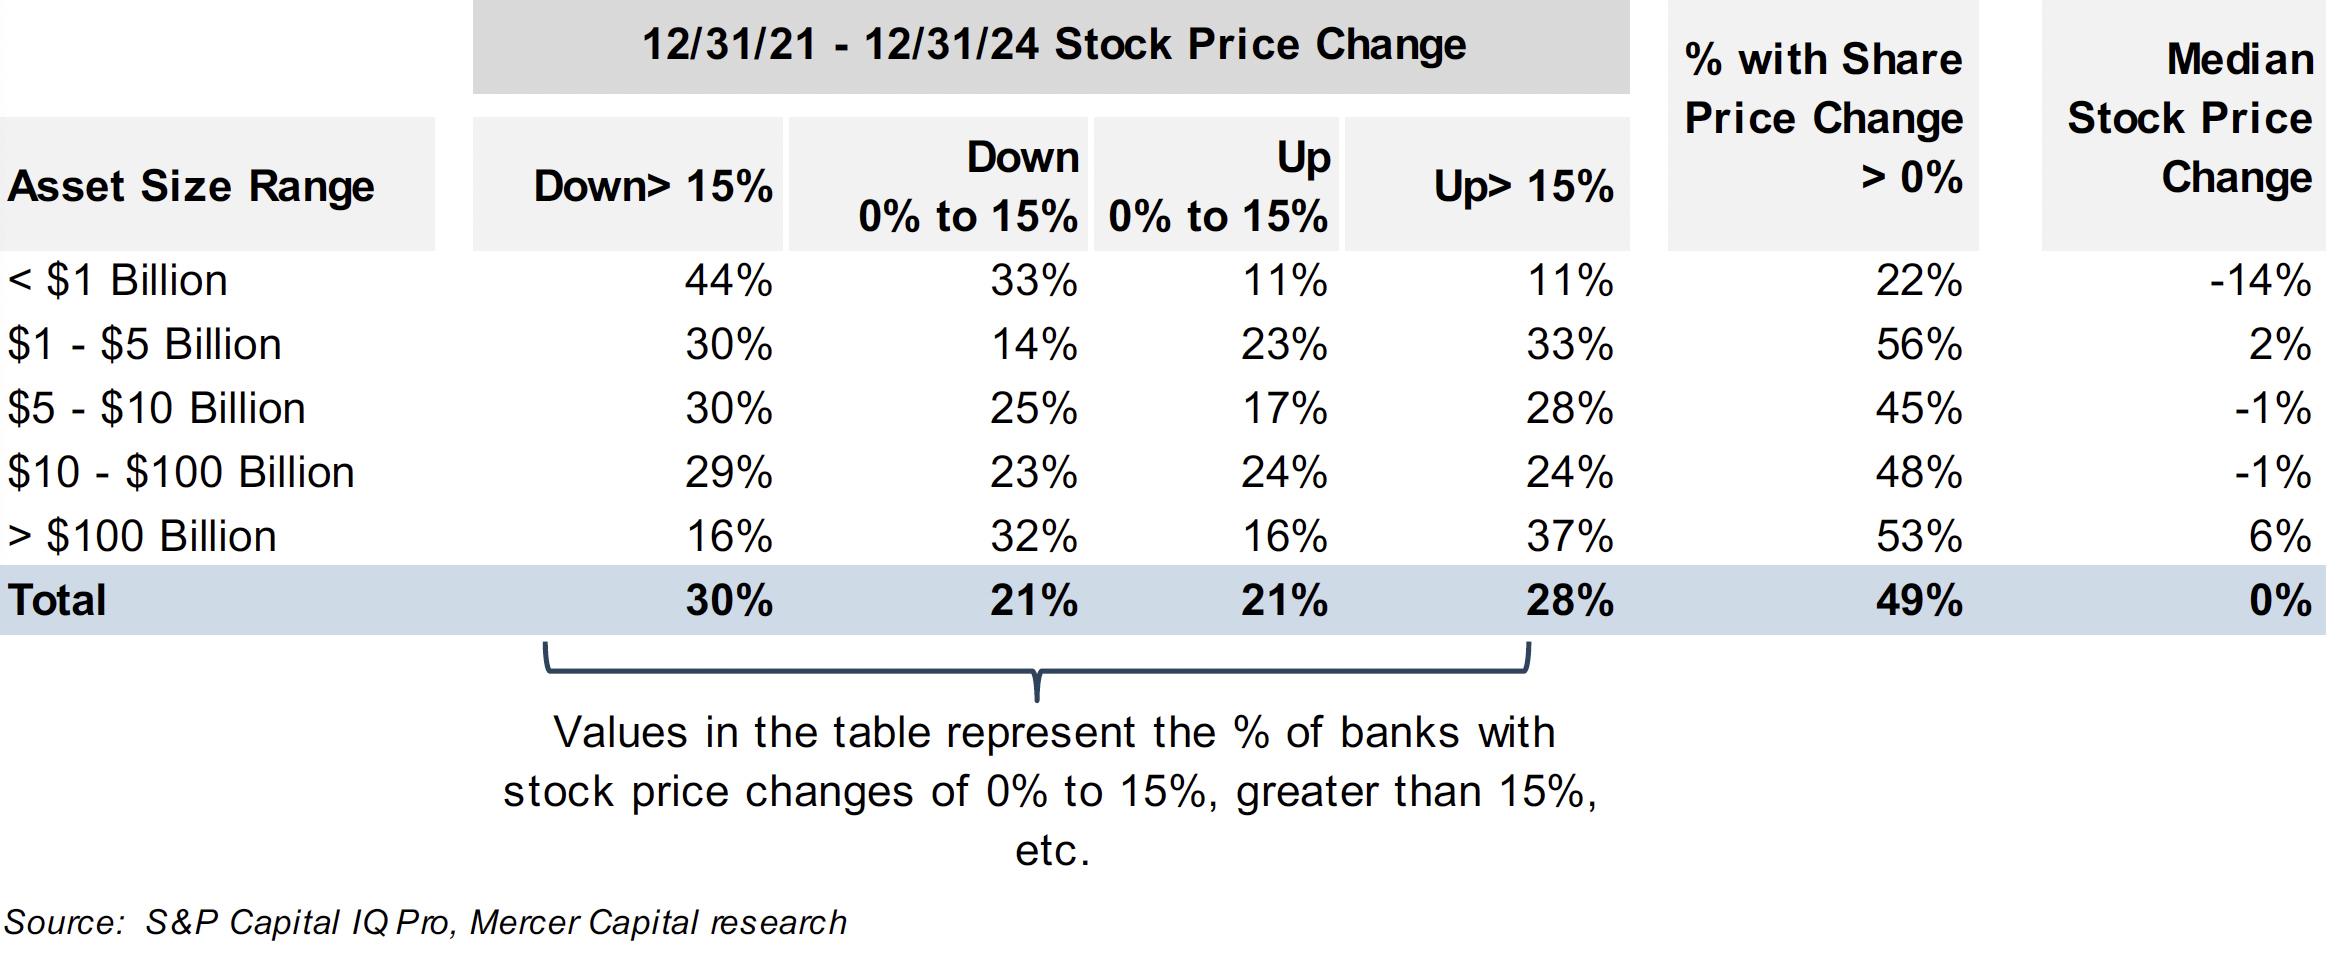
The weakest performance was among banks with assets of less than $1 billion, which reported a median share price change of negative 14% from 2021 to 2024. Some of these banks may face pressure from investors to consider strategic alternatives.
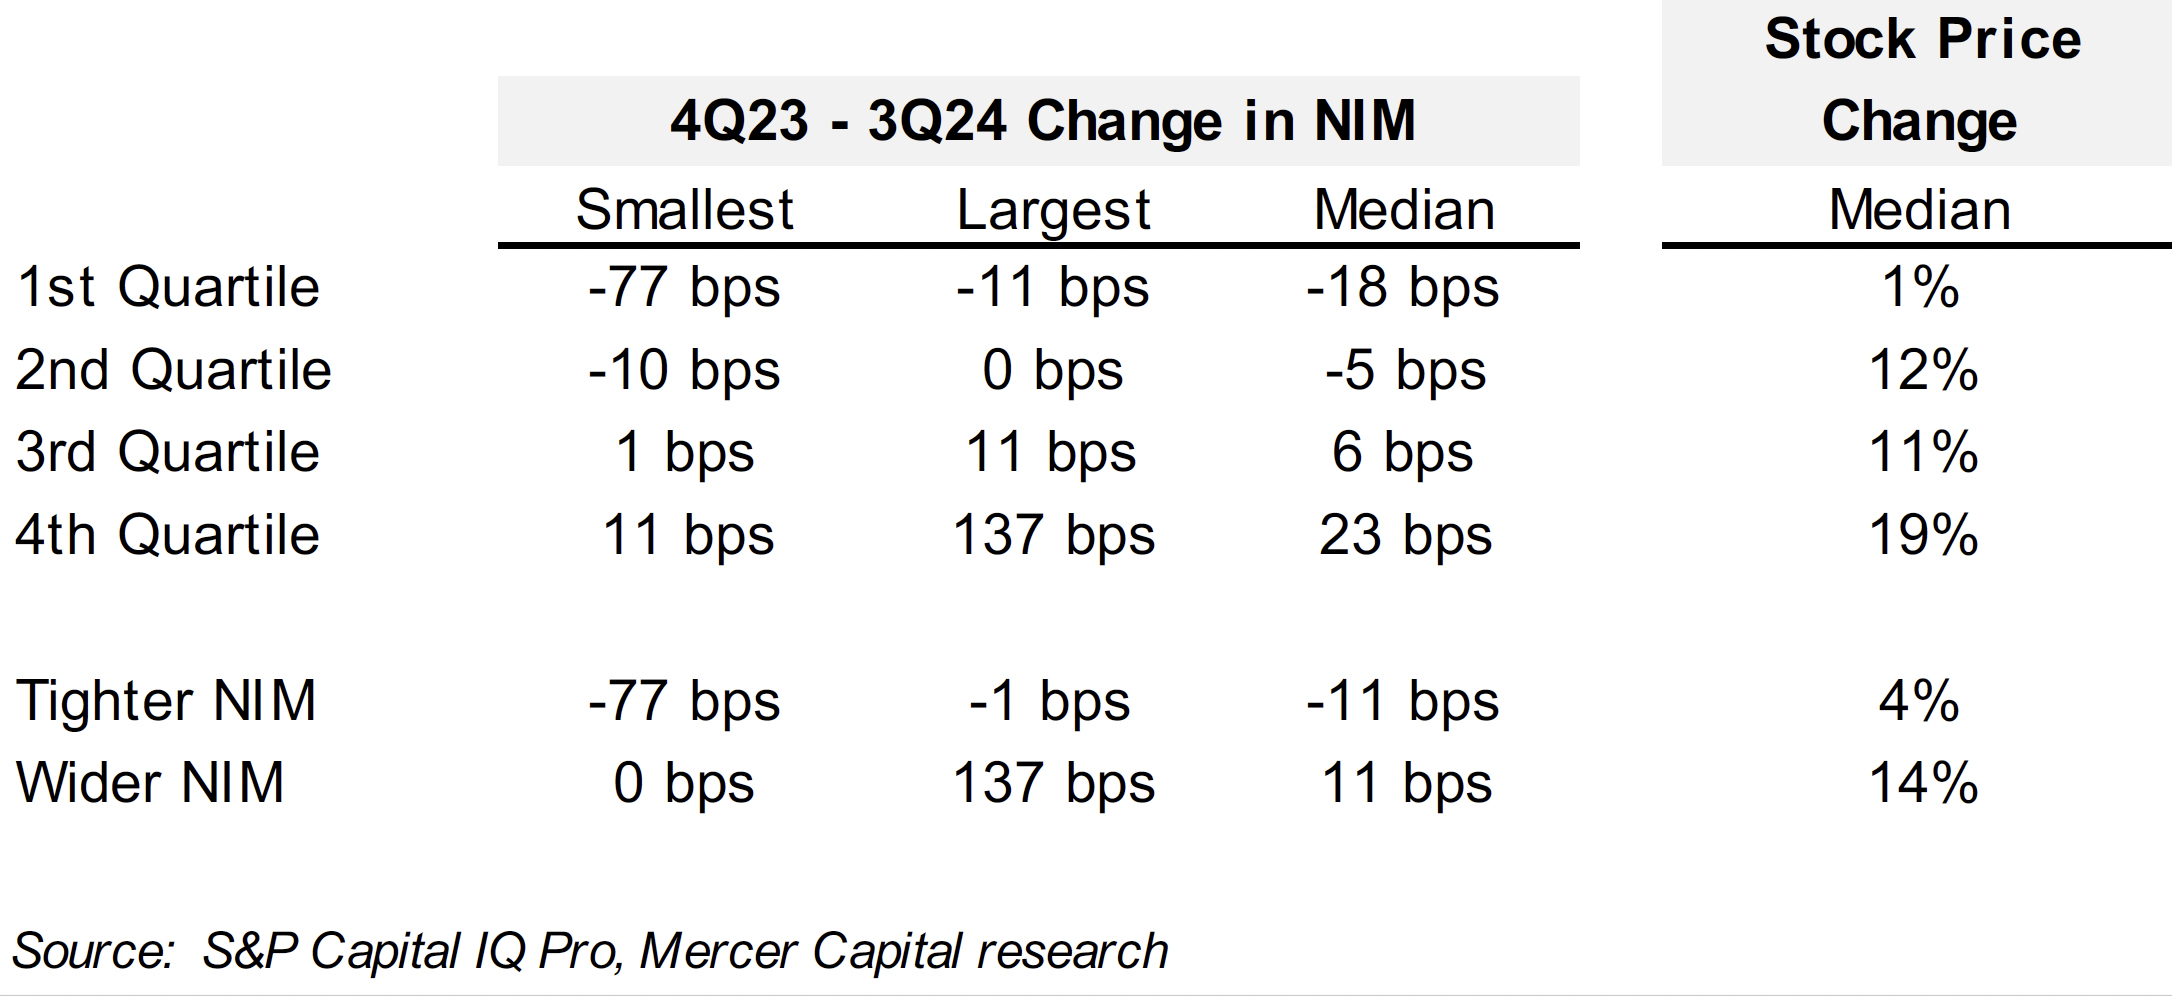
We have noted in prior years the correlation between net interest margin management and share price performance. This trend continued in 2024, with share prices rising by only 4% for banks with NIM compression between the fourth quarter of 2023 and third quarter of 2024 versus 14% for banks with NIM expansion (see Figure 5).
Figure 5
Analysts expect EPS to decline by 8% in 2024, relative to the prior year (see Figure 6), but are much more optimistic for 2025 and 2026. The estimates do not appear far-fetched, assuming a few basis points of net interest margin expansion, expense control, and low credit costs. Some bugaboos remain, though. Short-term rates may remain higher for longer, limiting NIM expansion for banks with higher funding costs and substantial legacy fixed rate assets. Credit issues remain a concern for low rate loans, with maturities and repricing dates moving ever closer. While boosting earning asset yields, maturities and repricings of loans from the 2020 and 2021 vintages may come at the cost of higher credit costs. This effect may become more evident, if it occurs at all, in 2025 as the loans from the 2020 vintage with five year terms mature or reprice.
Figure 6
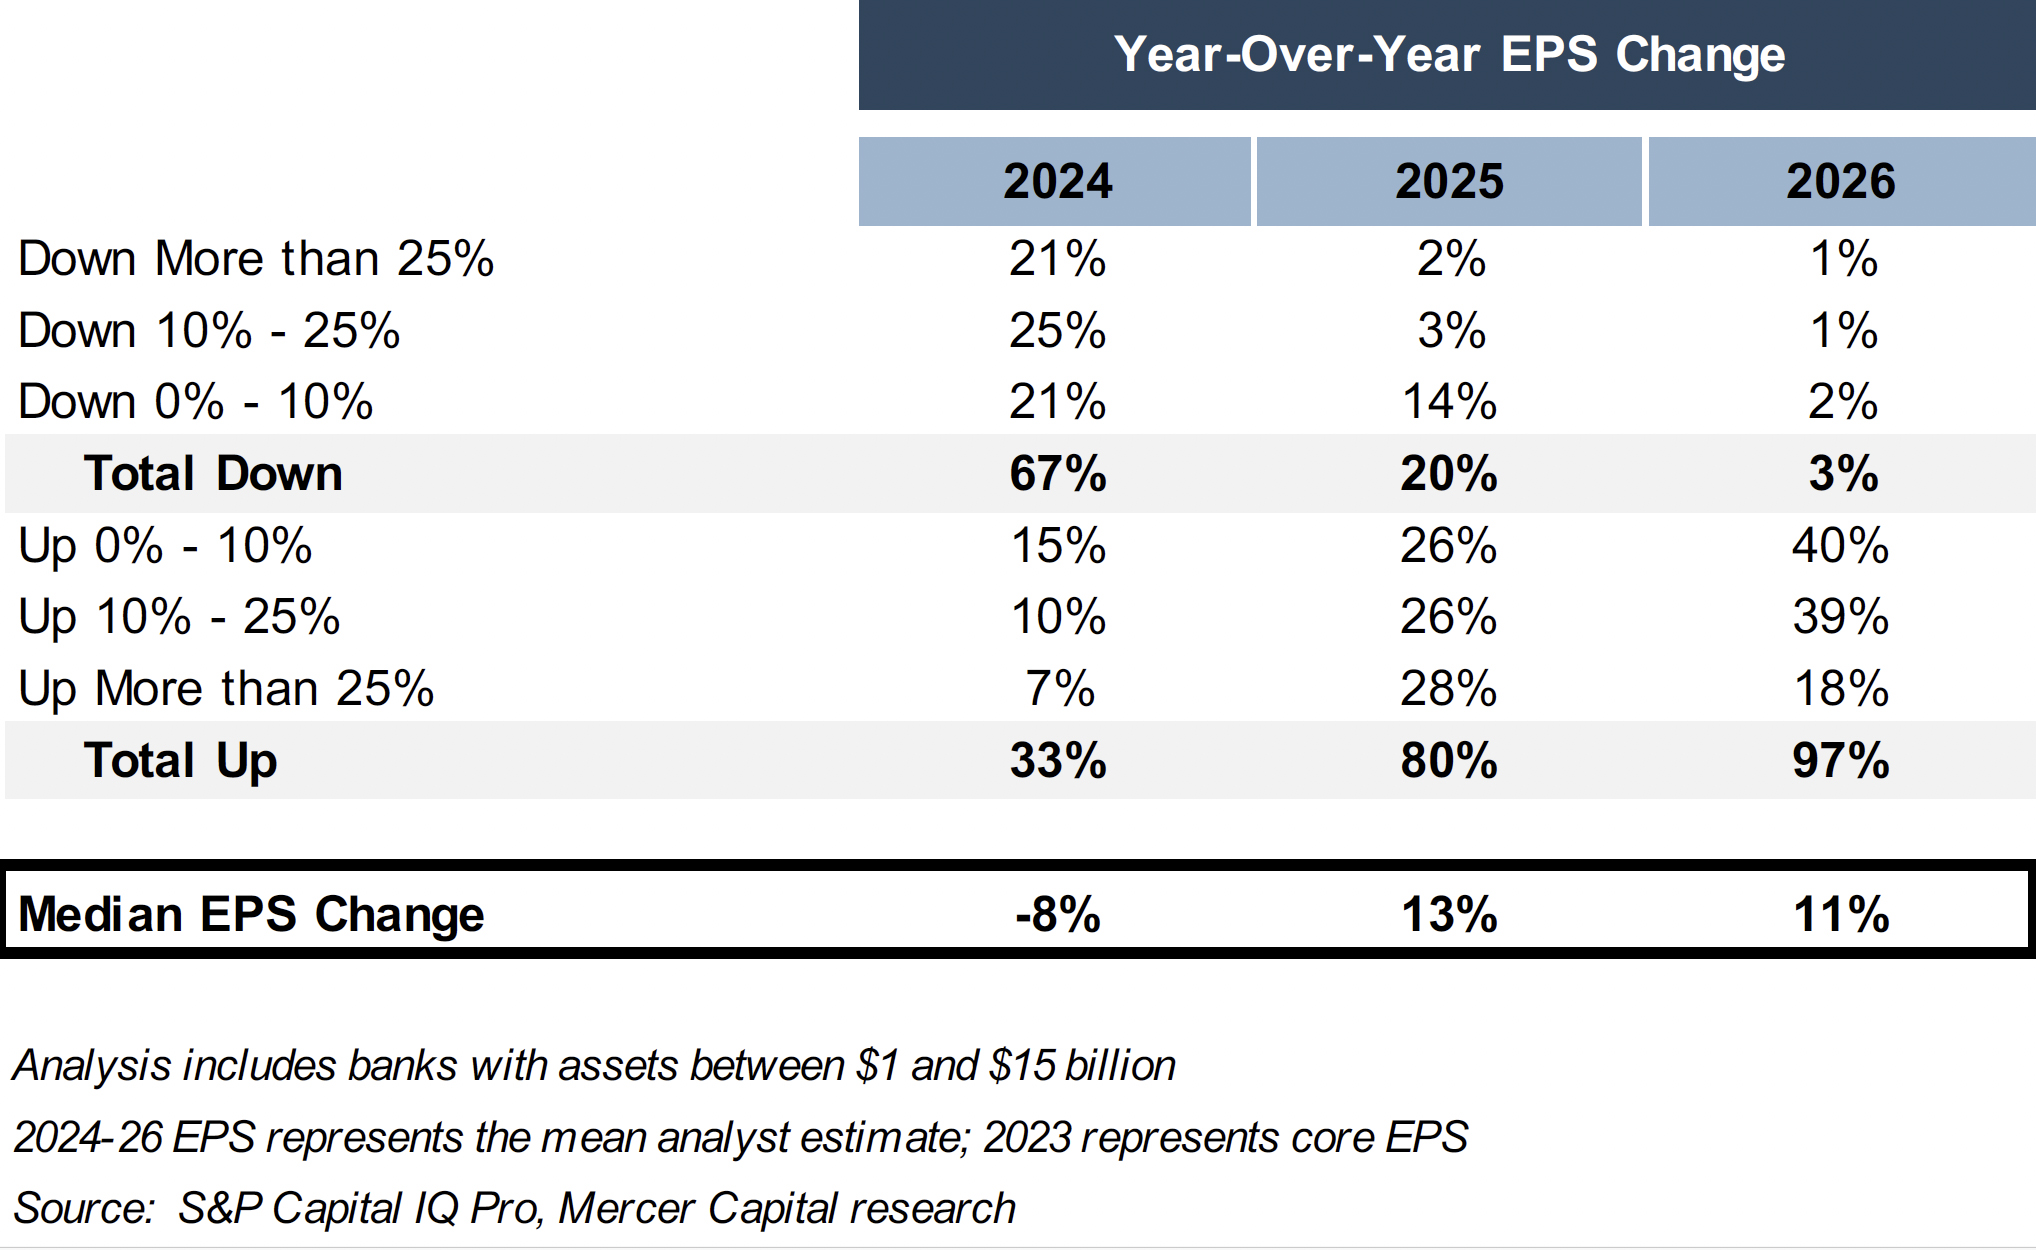
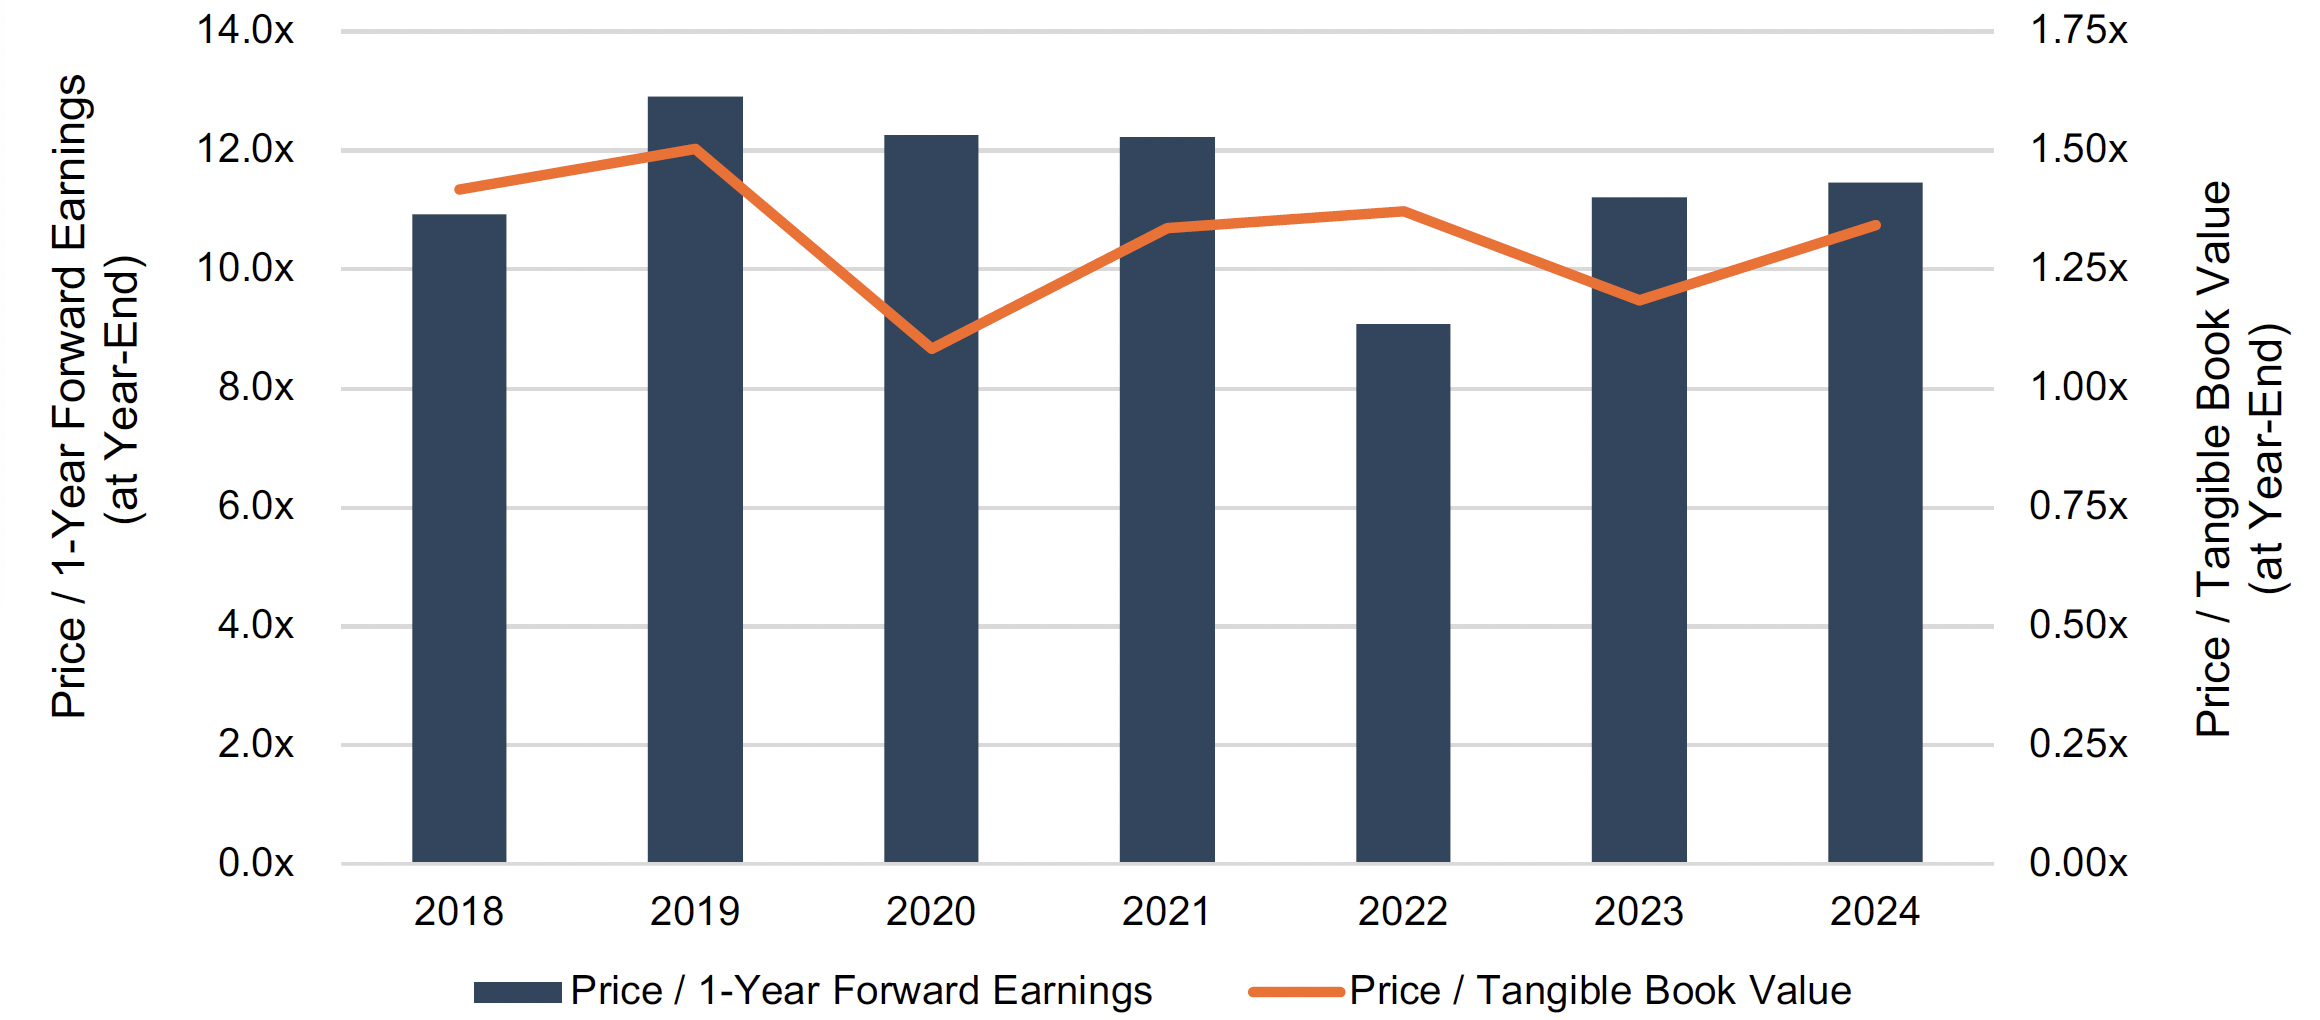
Figure 7 illustrates historical price/one-year forward earnings and price/tangible book value multiples. The median P/E multiple was 11.5x at year-end 2024, which is consistent with the long-term average. Although the effect of Trump’s deregulatory policies on bank valuations is unquantifiable, the market data would suggest that future bank stock returns will be driven by EPS growth rather than P/E multiple expansion.
Figure 7
An inflection point occurred in 2024, with both net interest margins and stock prices reaching a base from which expansion can occur. With NIM expansion proving a tailwind, for the banks in our analysis, EPS growth in 2025 should be positive for the first time since 2022. However, many banks remain burdened with excessive assets originated in the 2020 and 2021 vintages, which will restrain the normalization in return on assets towards historical levels. While credit costs are expected to remain benign, analysts’ EPS estimates contain little cushion in the event of asset quality deterioration. Finally, broad market indices, such as the NYSE or Nasdaq, are richly valued. A pull back in these indices may drag down bank stock prices too.