Since Mercer Capital’s most recently published article on core deposit trends in September 2024, deal activity in the banking industry is showing some signs of improvement. There were 77 deals announced in the first and second quarters of 2025 as compared to 65 during the same period of 2024. It is possible that transactions will pick up further due to a less stringent regulatory environment in the Trump administration. Additionally, funding pressure has eased significantly over the last two years, and mark-to-market adjustments on loans and deposits are declining. Despite short-term interest rates declining from their peak, we have seen a marginal uptick in core deposit intangible values in the most recent deal announcements.
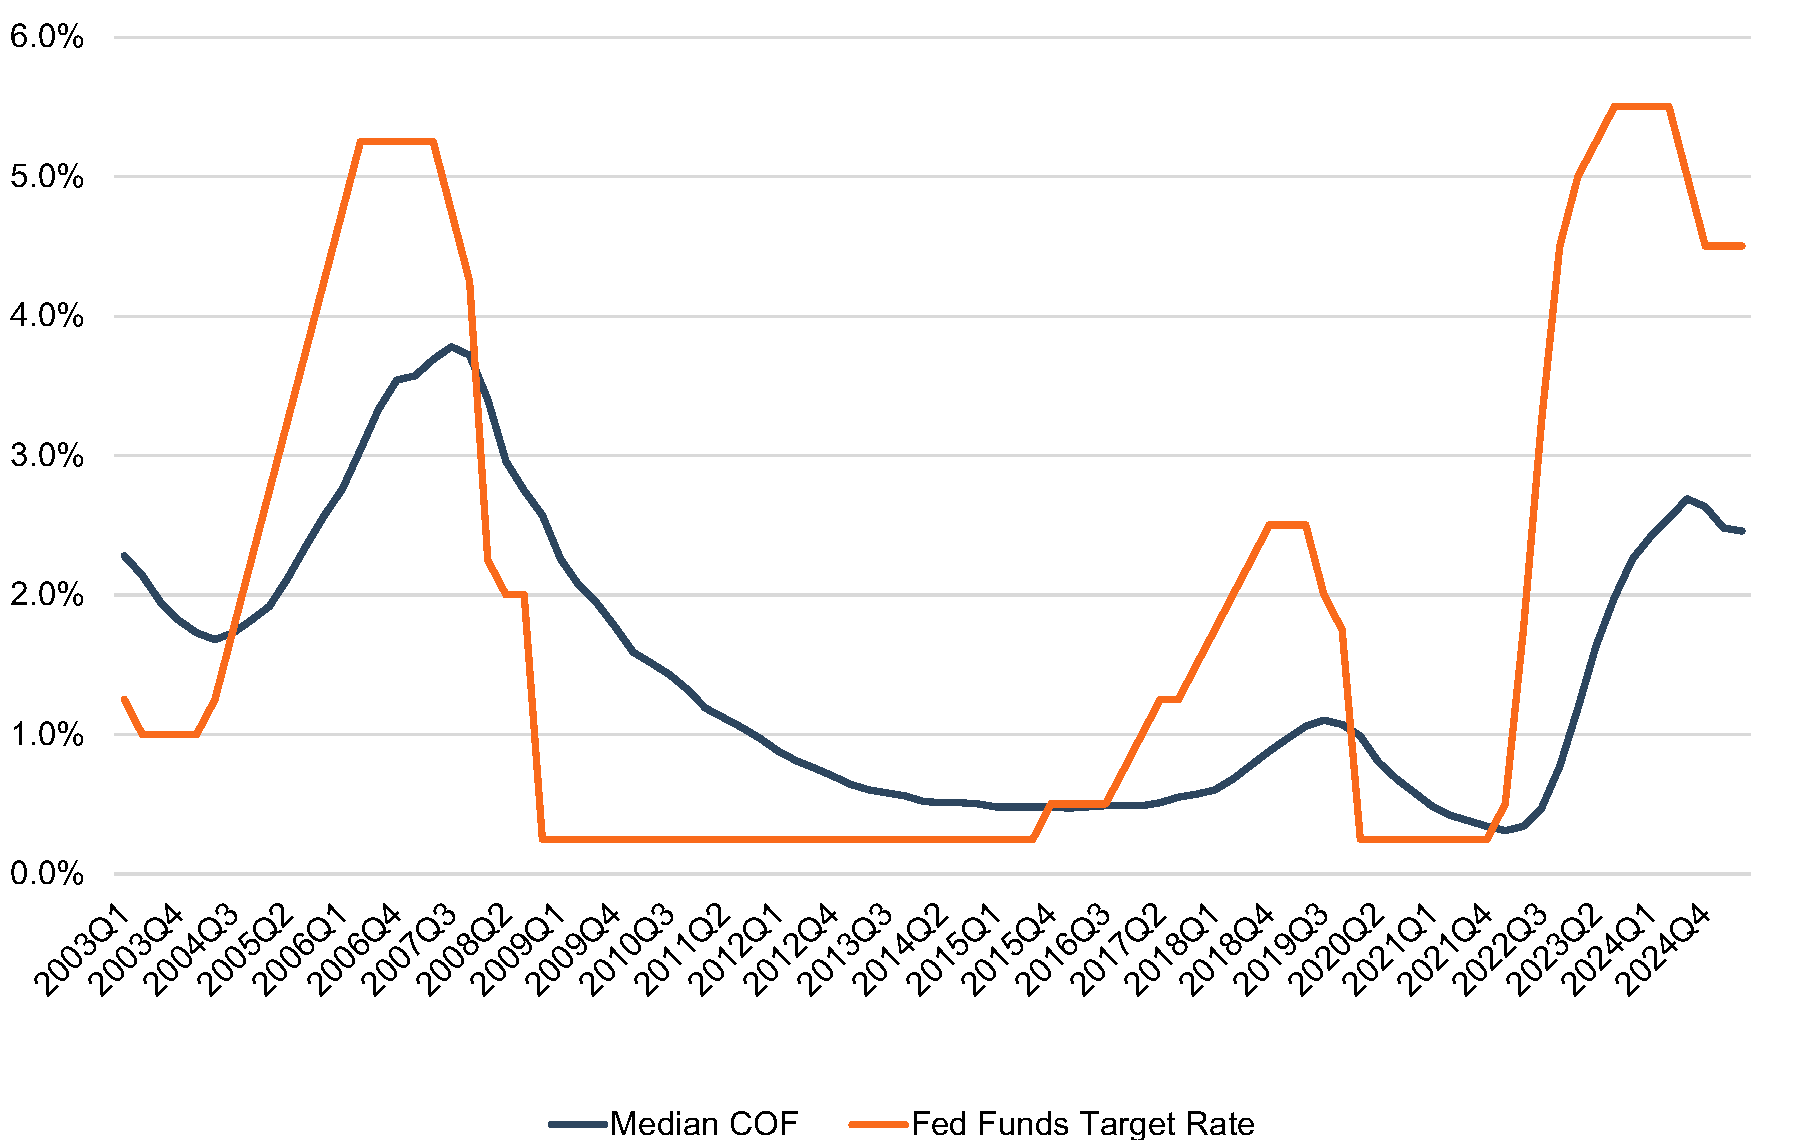
While many factors are pertinent to analyzing a deposit base, a significant driver of value is market interest rates. All else equal, lower market rates lead to lower core deposit values. In its September 2024 meeting, the Federal Reserve reduced the target federal funds rate by 50 basis points. This was the first downward adjustment since the FOMC began increasing rates in March 2022. In its third and fourth quarter 2024 meetings, the Federal Reserve reduced the target federal funds rate by 25 basis points at each meeting. After several quarters of steady rates, an additional 25 basis point reduction occurred in the September 2025 meeting. These cuts left the benchmark federal funds rate in a range between 4.00% and 4.25%.
 Source: Federal Reserve Summary of Economic Projections
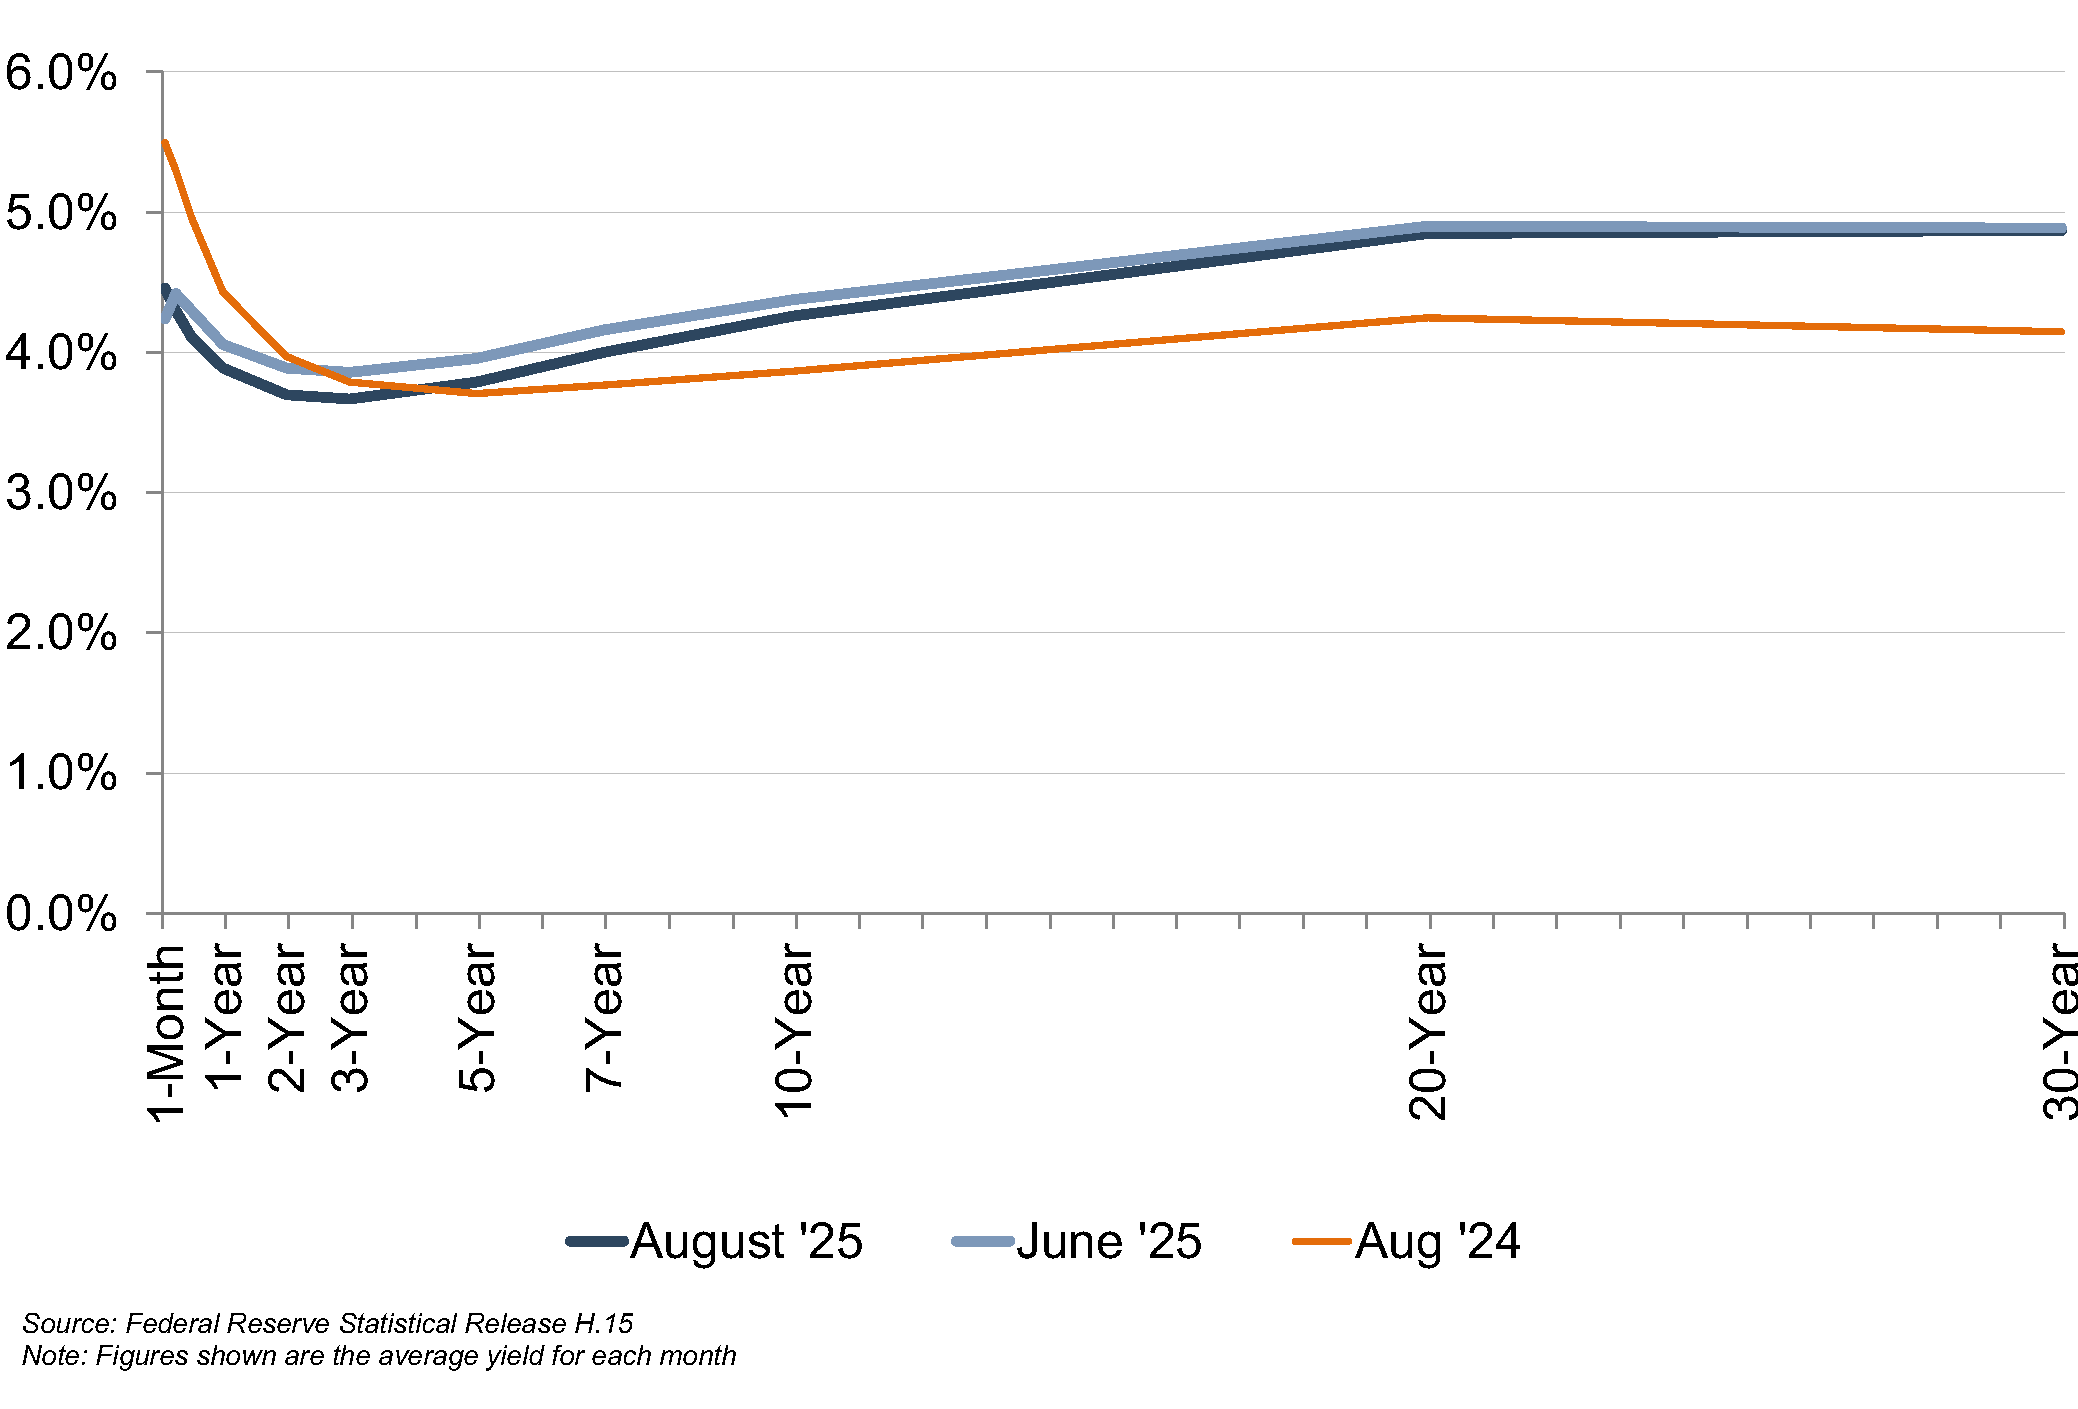
As shown in Figure 1, on the previous page, the yield curve for U.S. Treasuries has shifted downward relative to last year at this time for terms of less than five years, and the market expects further downward movement in short-term rates in the near-term.
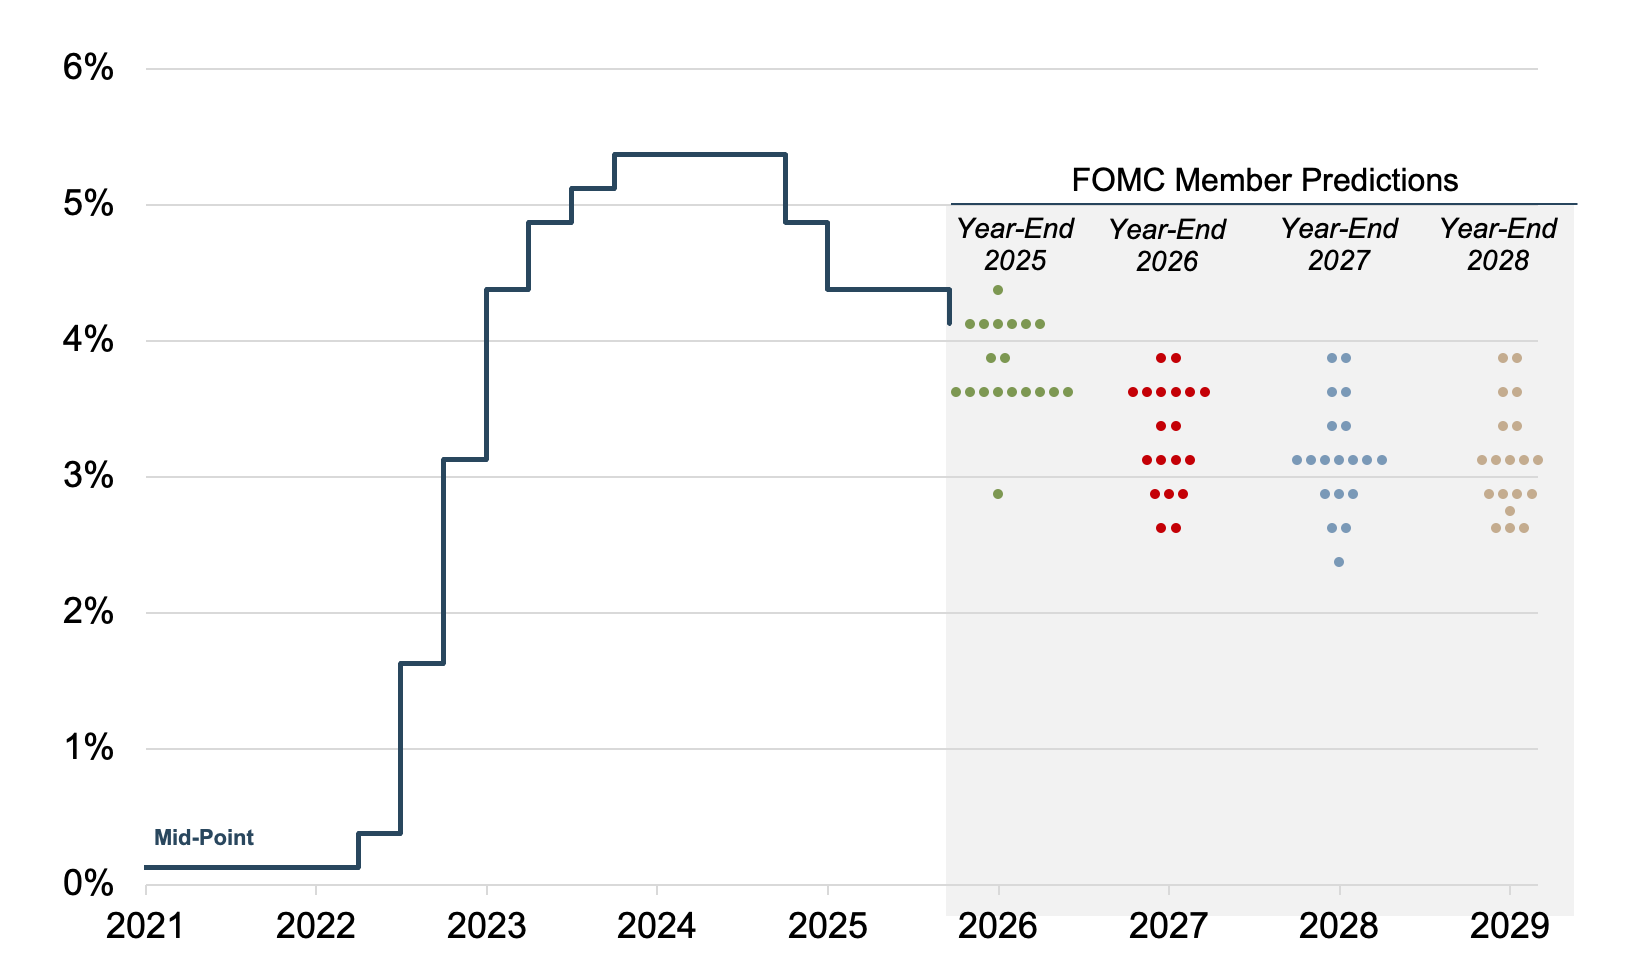
The Federal Reserve’s “dot plot”, presented in Figure 2, on the previous page, exhibits a wide dispersion of expectations for the near term, especially for 2026. Although the magnitude of future adjustments to the target rate is unclear, the expectation is clearly for lower rates.
Using data compiled by S&P Global Market Intelligence, we analyzed trends in core deposit intangible (CDI) assets recorded in whole bank acquisitions completed from 2000 through mid-September 2025. CDI values represent the value of the depository customer relationships obtained in a bank acquisition. CDI values are driven by many factors, including the “stickiness” of a customer base, the types of deposit accounts assumed, the level of noninterest income generated, and the cost of the acquired deposit base compared to alternative sources of funding. For our analysis of industry trends in CDI values, we relied on S&P Global Market Intelligence definition of core deposits. In analyzing core deposit intangible assets for individual acquisitions, however, a more detailed analysis of the deposit base would consider the relative stability of various account types. In general, CDI assets derive most of their value from lower-cost demand deposit accounts, while often significantly less (if not zero) value is ascribed to more rate-sensitive time deposits and public funds. Non-retail funding sources such as listing service or brokered deposits are excluded from core deposits when determining the value of a CDI.
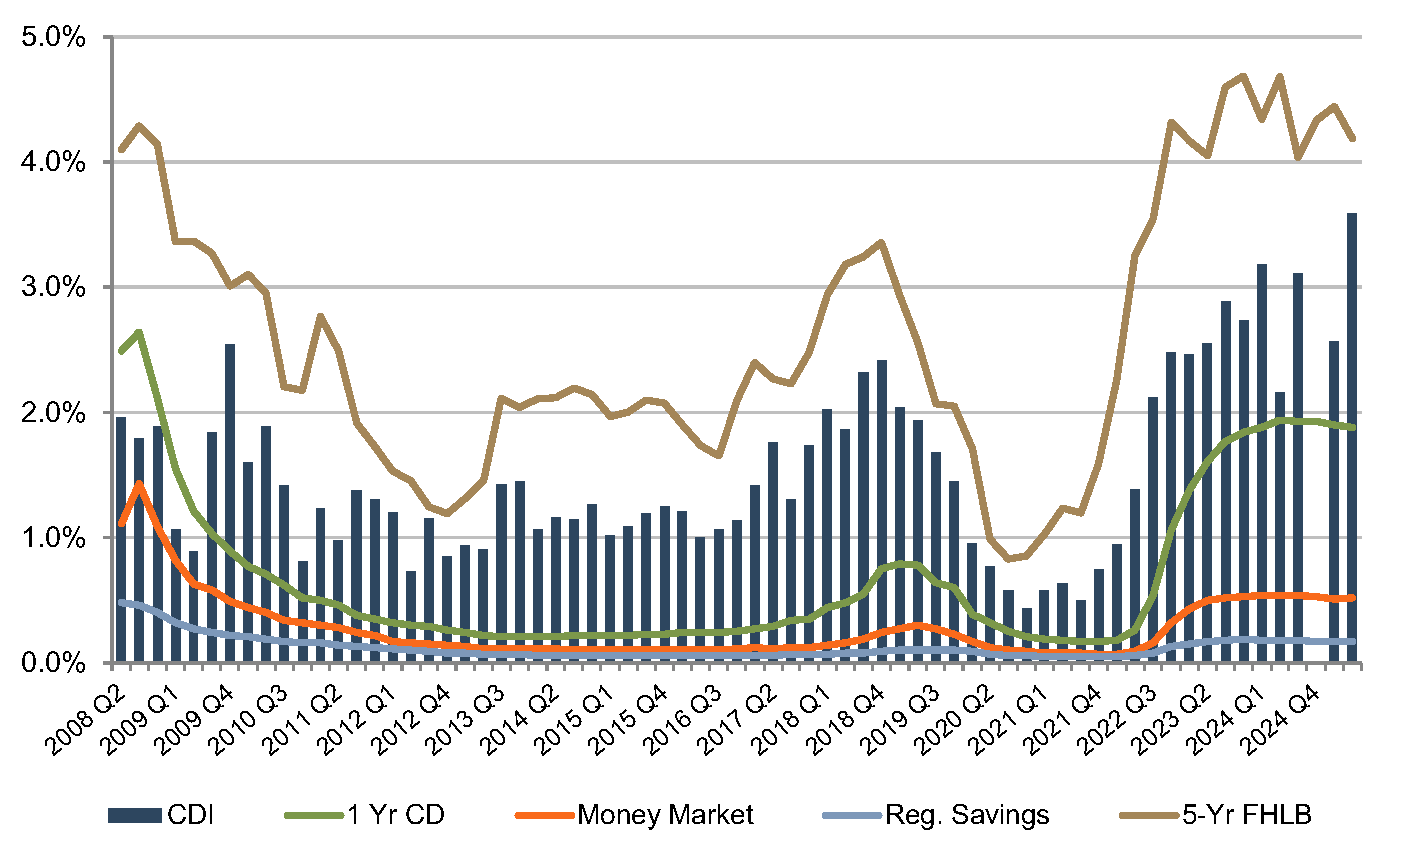
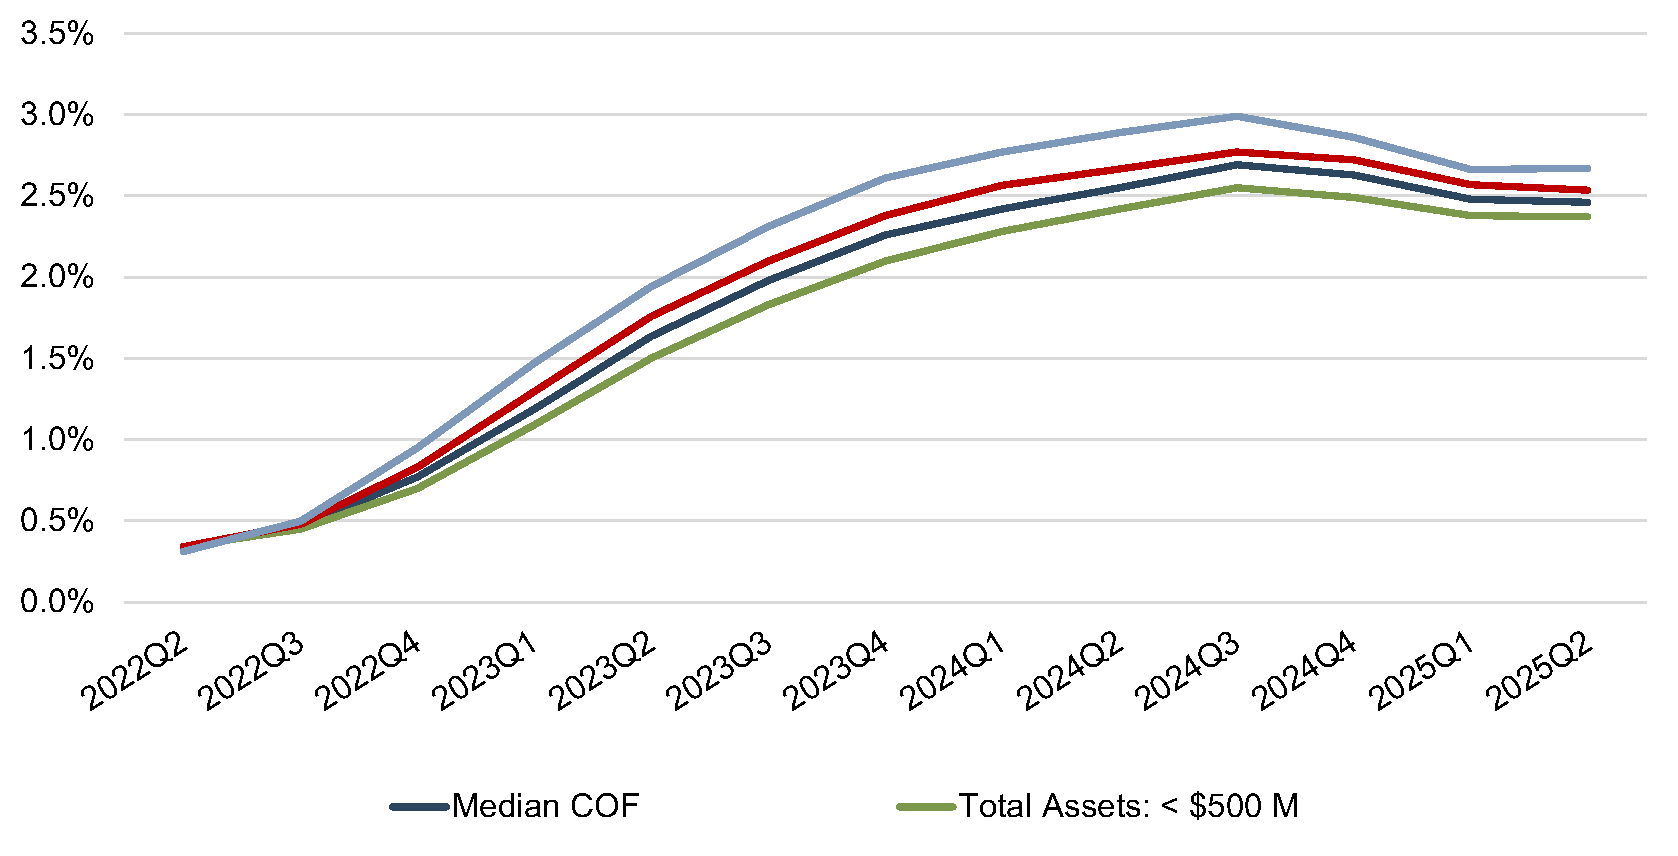
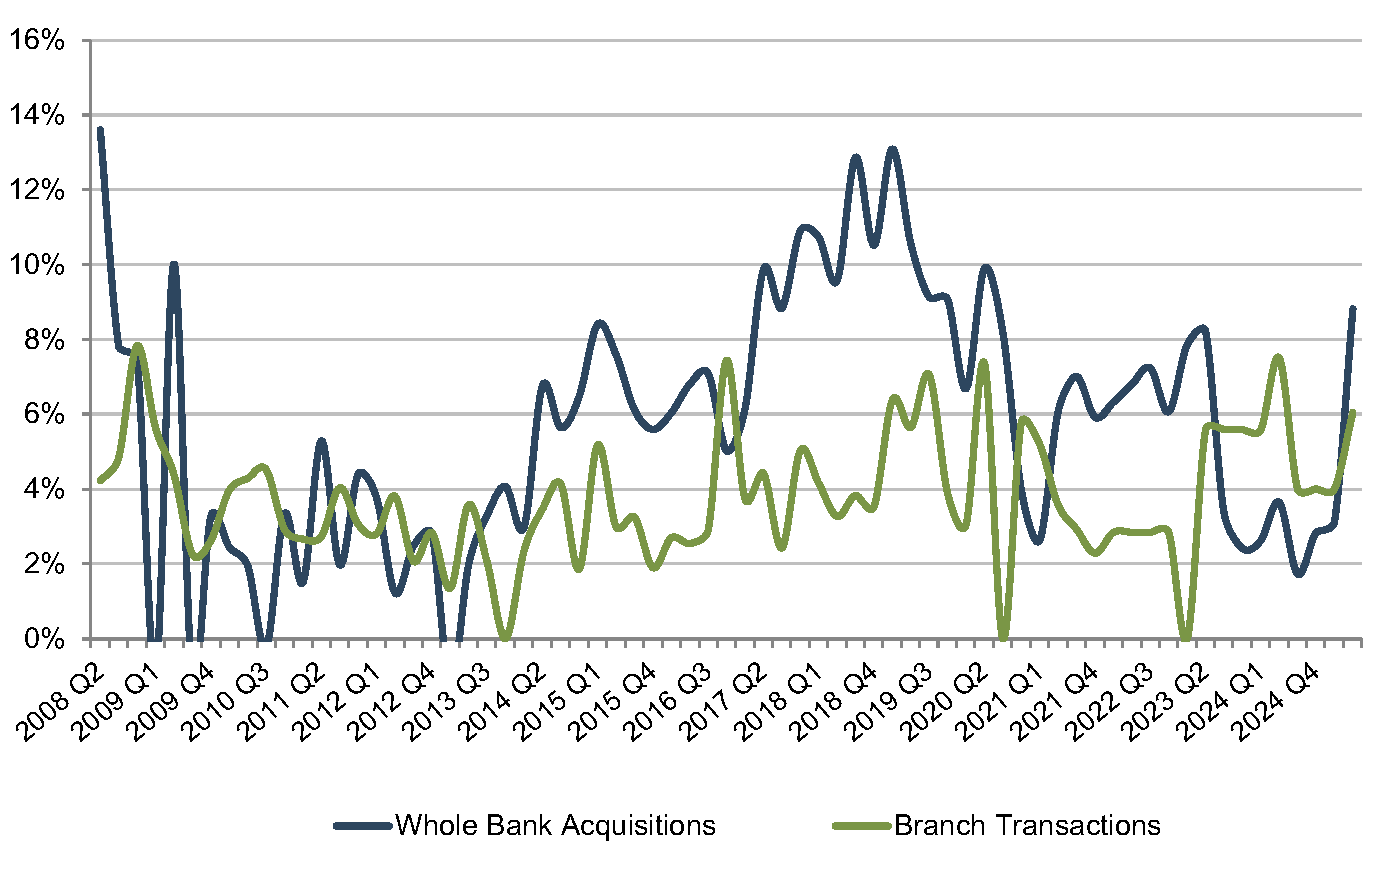
Figure 3 summarizes the trend in CDI values since the start of the 2008 recession, compared with rates on 5-year FHLB advances. Over the post-recession period, CDI values have largely followed the general trend in interest rates—as alternative funding became more costly in 2017 and 2018, CDI values generally ticked up as well, relative to post-recession average levels. Throughout 2019, CDI values exhibited a declining trend in light of yield curve inversion and Fed cuts to the target federal funds rate during the back half of 2019. This trend accelerated in March 2020 when rates were effectively cut to zero.
 Source: S&P Global Market Intelligence Cap IQ Pro
CDI values have been somewhat flat compared to last year, averaging 2.47% through mid-September 2025. Excluding one transaction with an unusually low core deposit intangible ratio, the average is closer to 2.70%. This compares to a 2.73% average for all of 2024, 2.58% for 2023, 1.60% for 2022 and 0.63% for 2021. Recent values are above the post-recession average of 1.53%, and on par with longer-term historical levels which averaged closer to 2.5% to 3.0% in the early 2000s.
As shown in Figure 3, reported CDI values have followed the general trend of the increase in FHLB rates. However, the averages should be taken with a grain of salt. The chart is provided to illustrate the general directional trend in value as opposed to being predictive of specific indications of CDI value due the following factors:
Forty-four deals were announced in July, August, and the first half of September, and 13 of those deals provided either investor presentations or earnings calls containing CDI estimates. Excluding two outliers with an average estimated CDI value of 1.3%, these CDI estimates ranged from 2.0% to 3.9% with an average of 3.0%. However, the CDI premiums cited in investor presentations can be somewhat difficult to compare, as acquirers may use different definitions of core deposits when calculating the CDI premiums reported to investors. For example, some acquirers may include CDs in the calculation, while other buyers may exclude CDs or include only certain types of CDs.
Generally, we expect CDI values to fall in concert with falling market interest rates. How fast they decline could depend on several factors:
 Source: S&P Global Market Intelligence Cap IQ Pro
 Source: S&P Global Market Intelligence Cap IQ Pro
 Source: S&P Global Market Intelligence Cap IQ Pro
 Source: S&P Global Market Intelligence Cap IQ Pro
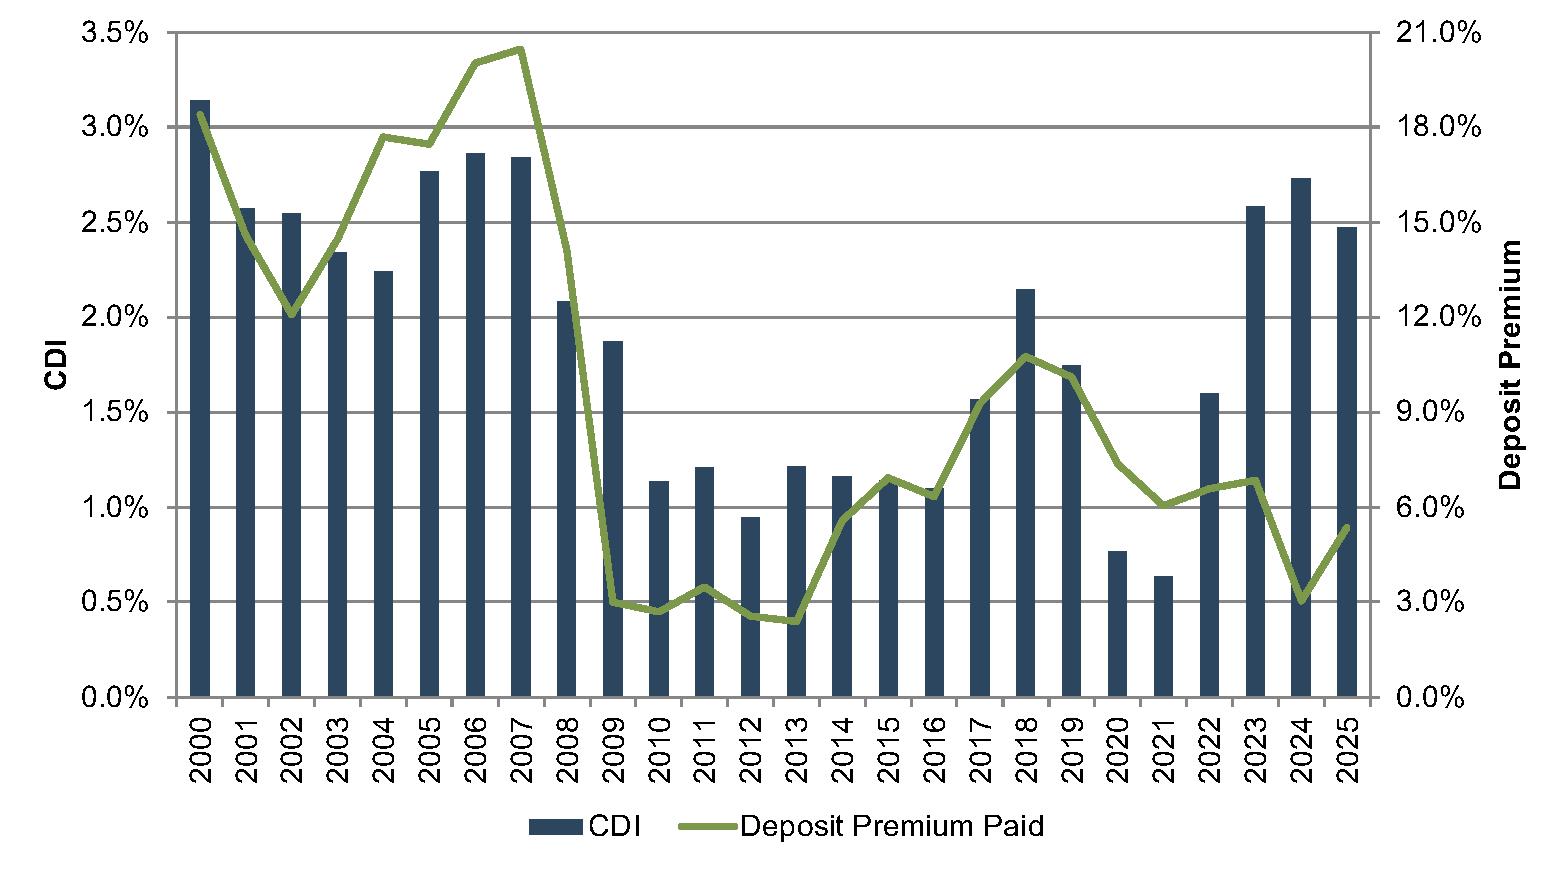
Core deposit intangible assets are related to, but not identical to, deposit premiums paid in acquisitions. While CDI assets are an intangible asset recorded in acquisitions to capture the value of the customer relationships the deposits represent, deposit premiums paid are a function of the purchase price of an acquisition. Deposit premiums in whole bank acquisitions are computed based on the excess of the purchase price over the target’s tangible book value, as a percentage of the core deposit base.
While deposit premiums often capture the value to the acquirer of assuming the established funding source of the core deposit base (that is, the value of the deposit franchise), the purchase price also reflects factors unrelated to the deposit base, such as the quality of the acquired loan portfolio, unique synergy opportunities anticipated by the acquirer, etc. As shown in Figure 8, deposit premiums paid in whole bank acquisitions have shown more volatility than CDI values. Deposit premiums were in the range of 6% to 10% from 2015 to 2023, although this remained well below the pre-Great Recession levels when premiums for whole bank acquisitions averaged closer to 20%. Net interest margin pressure—caused by assets originated at low rates during the pandemic and deposits that proved more rate sensitive than expected—resulted in deposit premiums in 2024 falling to levels last seen in the Great Financial Crisis. That is, low cost core deposits proved valuable in 2024, but CDI values in whole bank transactions were diminished by mark-to-market adjustments on the asset side of the balance sheet, which also resulted from the higher rate environment. In 2025, net interest margin pressure has subsided, and deposit premiums have increased.
 Source: S&P Global Market Intelligence Cap IQ Pro
Additional factors may influence the purchase price to an extent that the calculated deposit premium doesn’t necessarily bear a strong relationship to the value of the core deposit base to the acquirer. This influence is often less relevant in branch transactions where the deposit base is the primary driver of the transaction and the relationship between the purchase price and the deposit base is more direct. Figure 9, on the next page, presents deposit premiums paid in whole bank acquisitions as compared to premiums paid in branch transactions.
 Source: S&P Global Market Intelligence Cap IQ Pro
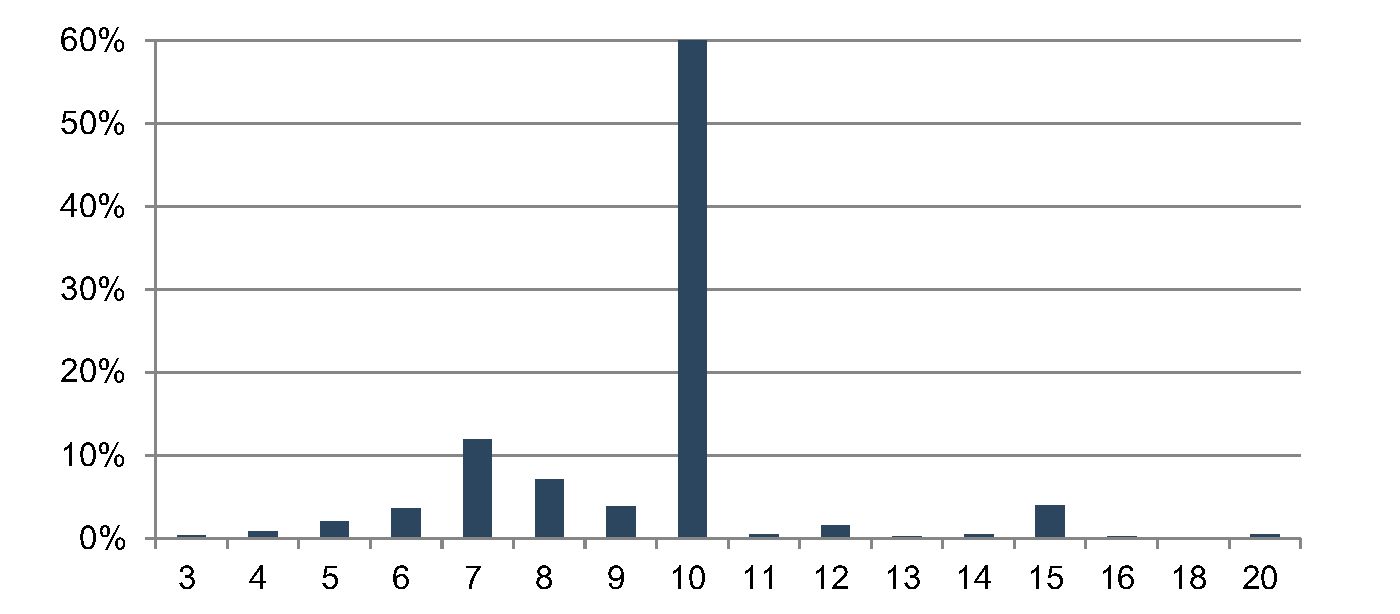 Source: S&P Global Market Intelligence Cap IQ Pro
Deposit premiums paid in branch transactions have generally been less volatile than tangible book value premiums paid in whole bank acquisitions. Only three branch transactions with reported premium data have occurred year-to-date in 2025. For those transactions, the deposit premiums were 7.0%, 4.6%, and 7.5%. The same number of branch transactions with reported premium data occurred in 2024, and the premiums were similar. The lack of branch transactions, though, is indicative of their value. With high short-term funding costs and tight liquidity, few banks have been willing to part with stable, low cost core deposits.
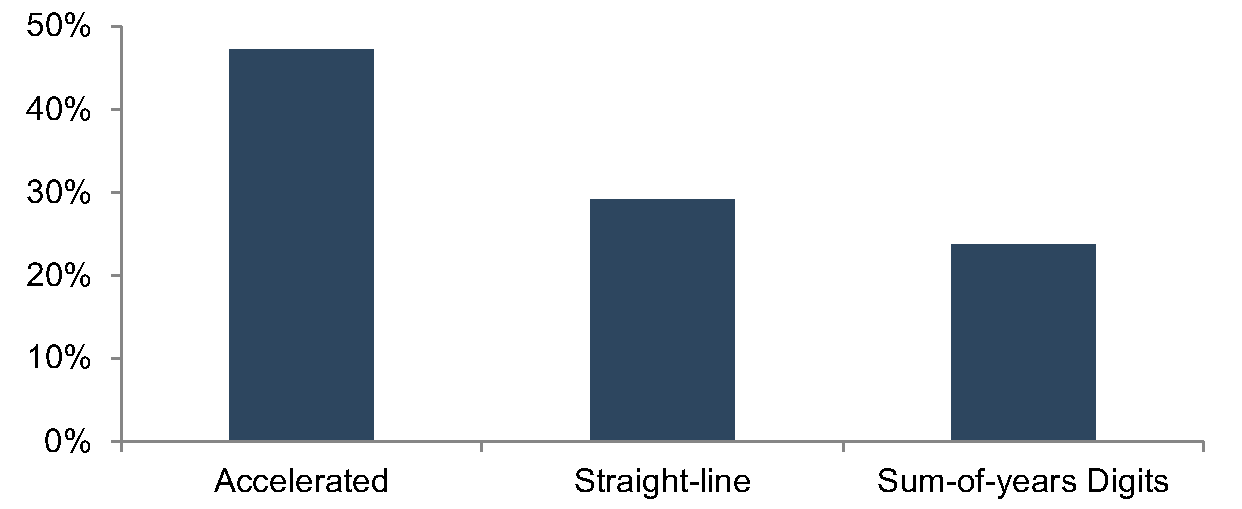
Based on the data for acquisitions for which core deposit intangible detail was reported, a majority of banks selected a ten-year amortization term for the CDI values booked. Less than 10% of transactions for which data was available selected amortization terms longer than ten years. Amortization methods were somewhat more varied, but an accelerated amortization method, including the sum-of-the-years digits method, was selected in approximately two-thirds of these transactions.
Core deposit intangible values are influenced by many factors, and each institution’s deposit base is unique. Mercer Capital has deep experience analyzing CDI values and advising financial institutions in transactions and strategic decisions. Contact us to discuss how we can help your organization navigate these trends.