A Review of Bank Stock Performance in August 2011: The “New Normal?” and Other Observations
Bank stocks ended a particularly volatile month in August 2011 on something of a good note, which masked the intra-month volatility. Looking forward, does this greater stock price volatility represent a “new normal,” as banks face an environment marked by greater macroeconomic risk?
Three bank stock indices we track performed as follows in August, relative to the S&P 500:
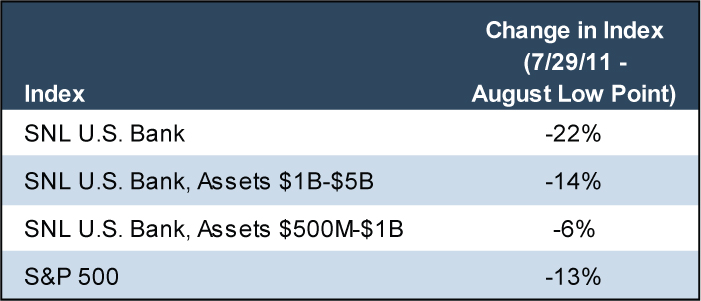
While the deterioration in market values evident in the table above is substantial, the declines are even more significant when measured at points earlier in the month. Table 2 indicates the compression in market values between July 29, 2011 and the lowest point observed for each index in August1:
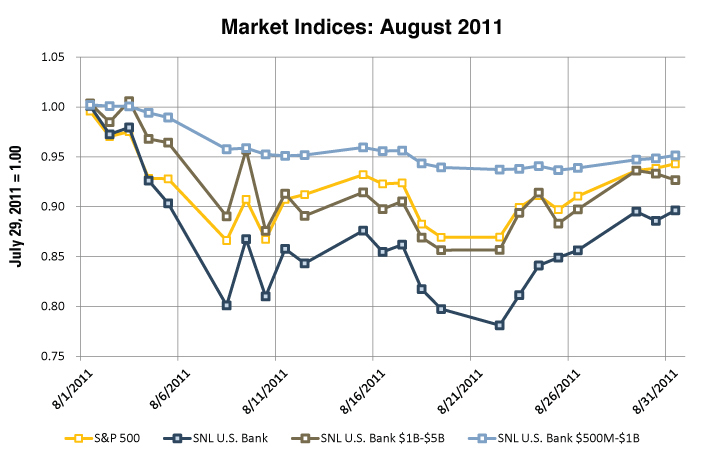
For example, the aggregate SNL Bank Index declined by 22% between July 29, 2011 and its August 22nd low, although subsequent gains cut this loss to 10% by month-end. Chart 1 provides daily observations for the four indices during August 2011.
The volatile performance appeared to be driven by various factors:
- Rising concern about a weakening global economic outlook and potential “double dip” recession in the U.S.;
- The inability of European governments to develop a successful strategy for managing their sovereign debt crisis, coupled with rising fears about a potential debt default by Spain and/or Italy;
- Concerns about the financial and reputational impact on larger banks of their entanglements with various issues and litigation related to securitized residential mortgages. This led to concerns that some banks (particularly Bank of America) may need to raise additional capital on dilutive terms (which Bank of America did via a preferred stock offering to Berkshire Hathaway); and,
- The U.S. debt downgrade by Standard & Poors.
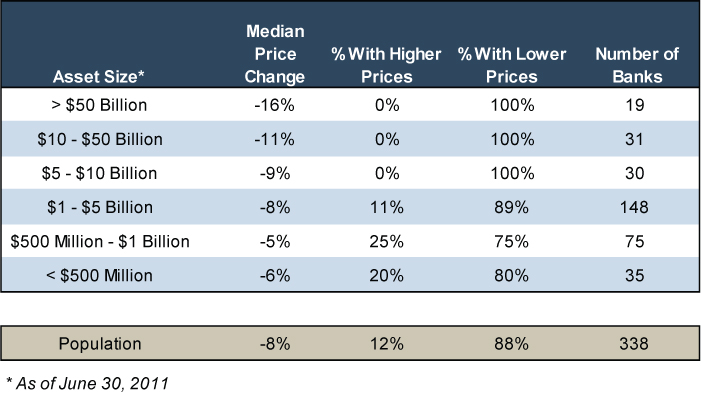
While these general factors affected most stocks in August, we attempted to isolate which factors most affected the performance of publicly traded banks in August. The following table shows the performance of banks in August stratified by asset size.
At August 31, 2011, no banks with assets exceeding $5 billion reported a higher stock price than at July 29, 2011, and larger banks generally reported weaker performance than smaller banks. This reflects several factors:
- The larger banks are more exposed to the lingering effects, such as lawsuits and loan repurchase demands, of residential mortgages originated at the peak of the real estate market;
- The larger banks may have direct exposure, albeit reportedly limited, to the sovereign debt of struggling European nations and entities located therein;
- The larger banks tend to be held more widely among various index funds, as compared to the smaller banks, which may create more selling pressure in a market where investors sell stocks in favor of safer alternatives; and,
- The smaller banks tend to trade less actively and often are less correlated with the broader equity market. Further, some of the smaller banks trade at very low nominal stock prices, due to their asset quality problems and capital shortfalls, and month-to-month movements in their stock price can be exaggerated and analytically less meaningful.
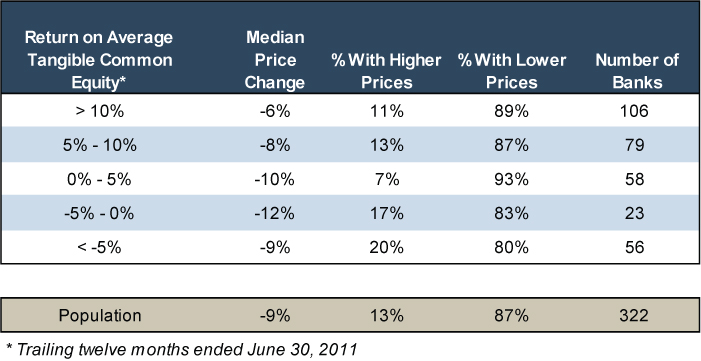
We also examined the relationship between August 2011 stock market performance and return on tangible common equity. As indicated in the following table, banks with stronger profitability generally performed better, as measured by the median change in their respective stock prices, providing some evidence that investors were more apt to avoid banks with lower profitability, since such banks may have less wherewithal to manage more distressed economic conditions.
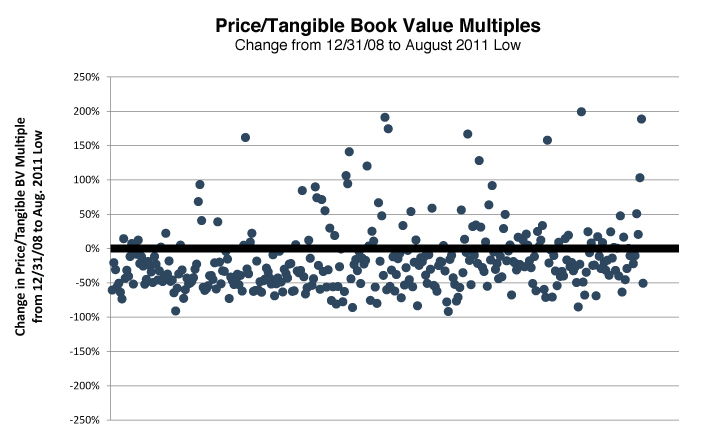
Given the depths to which some bank stocks fell in August, we thought it interesting to compare the price/tangible book value multiples, measured based on each bank’s lowest stock price during the month, to the price/tangible book value multiples observed as of December 31, 2008, which represents a proxy for the timing of most distressed period of the financial crisis. This analysis indicates the following:
- Only 80 banks had a higher price/tangible book value multiple at their August 2011 low than at December 31, 2008, which represents 24% of the population of actively traded banks. That is, despite the improving trends in credit quality and rising earnings, more than 75% of the publicly traded banks had lower price/tangible book value multiples at some point in August 2011 than at year-end 2008;
- The trend towards lower price/tangible book value multiples was not limited to smaller banks for which the effects of the weaker economic conditions were often not immediately evident in 2008. Even larger banks, such as Bank of America, JPMorgan Chase, and Wells Fargo reported lower price/tangible book value multiples.
For perspective, the chart below plots the changes in the price/tangible book value multiples reported by the publicly traded banks between December 31, 2008 and their respective August 2011 lows.
Endnotes
1 These low points occurred on August 8th for the S&P 500; August 19th for the SNL Bank Index comprised of banks with between $1 and $5 billion of assets; August 22nd for the aggregate SNL Bank Index; and August 25th for the SNL Bank Index comprised of banks with between $500 million and $1 billion of assets.
Originally published in Mercer Capital’s Bank Watch 2011-09, released September 15, 2011

