At this time last year, bank M&A could be described as “on the runway” as economic activity accelerated following the short, but deep recession in the spring. Next year, activity should gain altitude. Most community banks face intense earnings pressure as PPP fees end, operating expenses rise with inflation, and core NIMs remain under pressure unless the Fed can hike short-term policy rates more than a couple of times. Good credit quality is supportive of activity, too.
Should and will are two different verbs, however.
One wildcard that will impact activity and pricing is the public market multiples of would be acquirers. Consideration for all but the smallest sellers often includes the issuance of common shares by the buyer. When bank stocks trade at high multiples, sellers obtain “high” prices though less value than when public market multiples are low and sellers receive low(er) prices though more value.
If bank stock prices perform reasonably well in 2022, after a fabulous 2021 in which the NASDAQ Bank Index increased 40% through December 28, then activity probably will trend higher as more community banks look to sell. MOEs may be easier to negotiate, too. If bank stocks are weak for whatever reason, then activity probably will slow.
As of December 17, 2021, there have been 206 announced bank and thrift deals compared to 117 in 2020. During the halcyon pre-COVID years, about 270 transactions were announced each year during 2017-2019.
As a percent of charters, acquisition activity in 2021 accounted for about 4% of the number of banks and thrifts as of January 1. Since 1990, the range is about 2% to 4%, although during 2014 to 2019 the number of banks absorbed each year exceeded 4% and topped 5% in 2019. As of September 30, there were 4,914 bank and thrift charters compared to 9,904 as of year-end 2000 and about 18,000 charters in 1985 when a ruling from the U.S. Supreme Court paved the way for national consolidation.
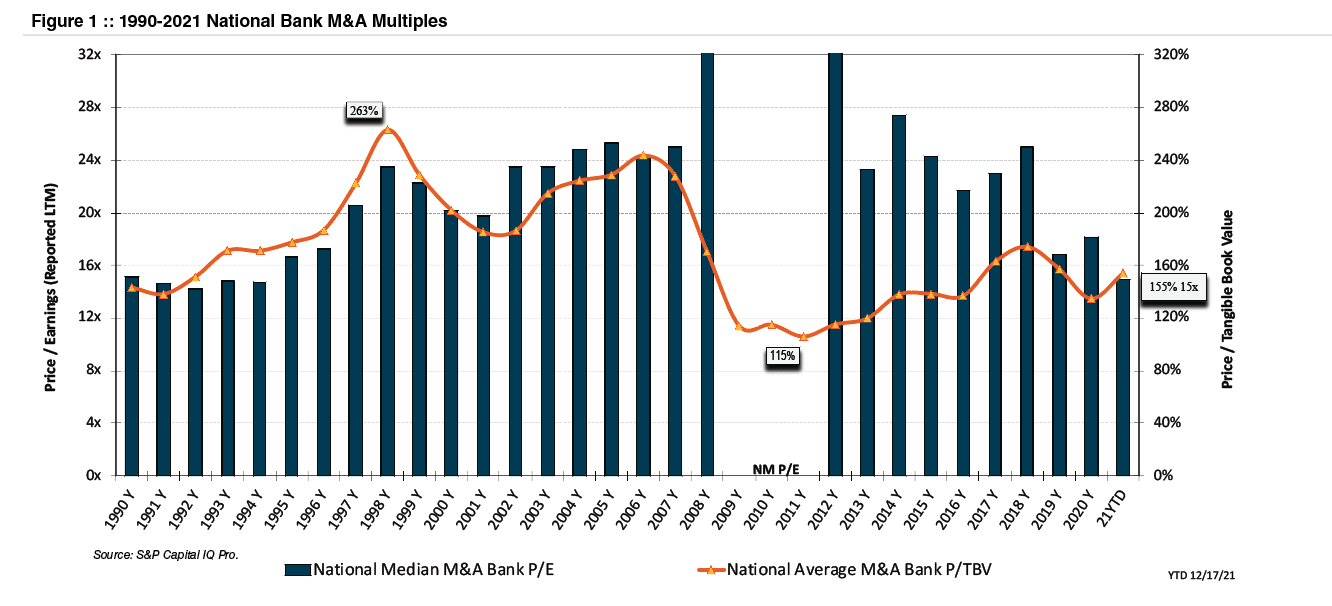
Pricing—as measured by the average price/tangible book value (P/TBV) multiple—improved in 2021. As always, color is required to explain the price/earnings (P/E) multiple based upon reported earnings.
The national average P/TBV multiple increased to 155% from 135% in 2020, although deal activity was light in 2020. As shown in Figure 1, the average transaction multiple since the Great Financial Crisis (GFC) peaked in 2018 at 174% then declined to 158% in 2019 as the Fed was forced to cut short-term policy rates three times during 3Q19 in an acknowledgment that the December and probably September 2018 hikes were ill-advised.
Earnings—rather than tangible book value — drive pricing as do public market valuations of acquirers who issue shares as part of the seller consideration. Nonetheless, drawing conclusions based upon unadjusted reported earnings sometimes can be misleading.
As an example, the national median P/E for banks that agreed to be acquired in 2018 approximated 25x, in part, because many banks that are taxed as C corporations wrote down deferred tax assets at year-end 2017 following the enactment of corporate tax reform. Plus, forward earnings reflected a reduction in the maximum federal tax rate to 21% from 35%.
Also, the median P/E in 2021 fell to about 15x from 17x in 2019 and 2020 in part because the earnings of many sellers included substantial PPP-related income that will largely evaporate after this year.
Buyers focus on the pro forma earnings multiple with all expense savings in addition to EPS accretion and the amount of time it takes to recoup dilution to tangible BVPS. Our take is that most deals entail a P/E based upon pro forma earnings with fully phased-in expense saves of 7x to 10x unless there are unusual circumstances.
Click here to expand the image above
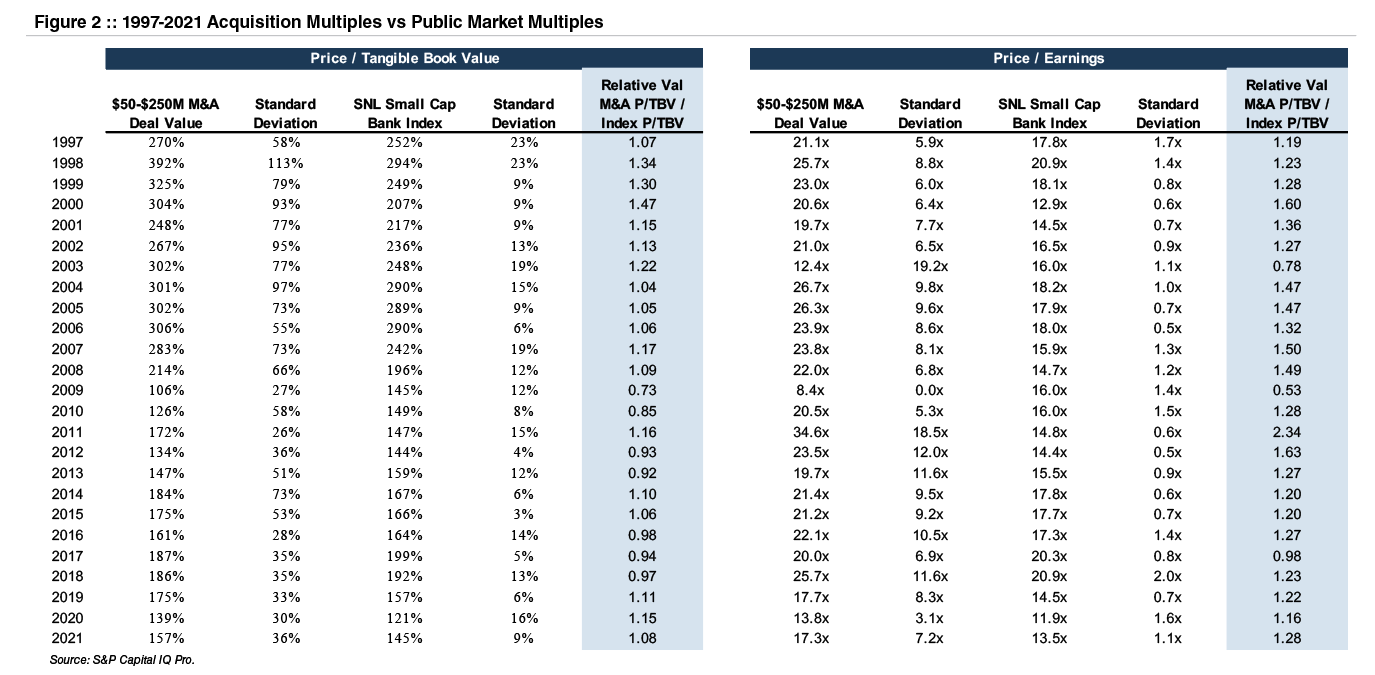
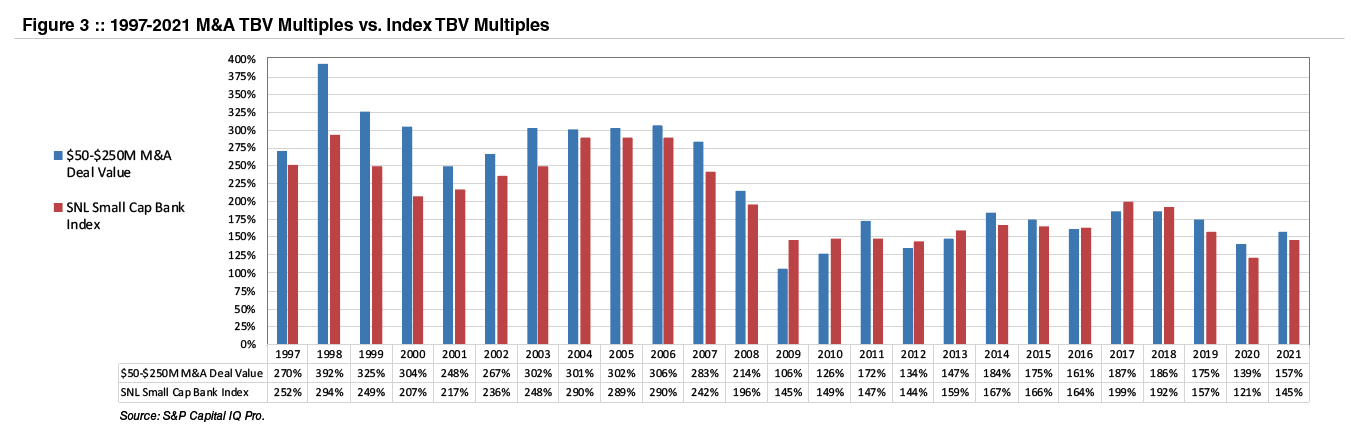
Figure 2 compares the annual average P/TBV and P/E for banks that were acquired for $50 million to $250 million since 1997 with the SNL Small Cap Bank Index average daily multiple for each year. Among the takeaways are the following:
Click here to expand the image above
Click here to expand the image above
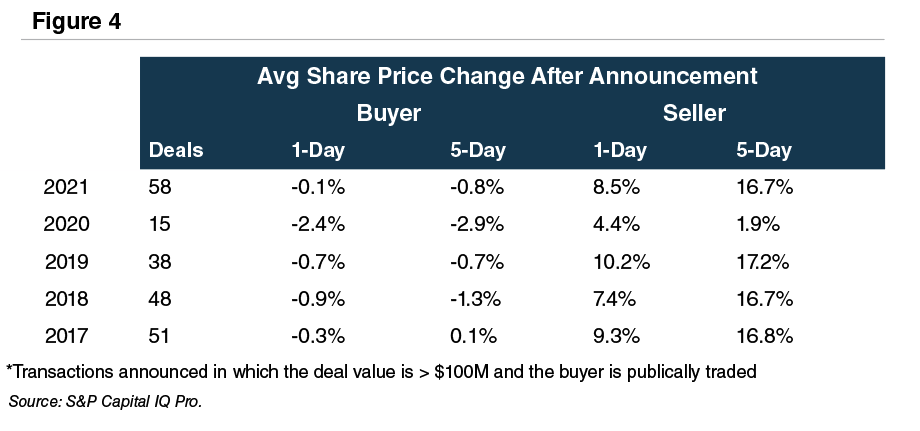
Public market investors often focus on what can be referred to as icing vs the cake in the form of acquisition premiums relative to the pre-announcement prices. Investors tend to talk about acquisition premiums as an alpha generator, but long-term performance (or lack thereof) of the target is what drives shareholder returns. Sometimes the market is suprised by acquisitions with an outsized premium, but in recent years premiums often have been modest.
As shown in Figure 4, the average one-day premium for transactions announced in 2021 that exceeded $100 million in which the buyer and seller were publicly traded was about 9%, a level that was comparable to the prior few years excluding 2020. For buyers, the average day one reduction in price was less than 1%, though there are exceptions when investors question the pricing (actually, the exchange ratio). For instance, First Interstate (NASDAQ: FIBK) saw its shares drop 7.4% after it announced it would acquire Great Western for about $2 billion on September 16, 2021.
M&A entails a lot of moving parts of which “price” is only one. It is especially important for would be sellers to have a level-headed assessment of the investment attributes of the acquirer’s shares to the extent merger consideration will include the buyer’s common shares. Mercer Capital has roughly 40 years of experience in assessing mergers, the investment merits of the buyer’s shares, and the like. Please call if we can help your board in 2022 assess a potential strategic transaction.