At this time last year, we thought bank M&A would be described as a second year of “gaining altitude” after 2020 was spent on the tarmac following the short, but deep recession in the spring of 2020. Our one caveat was that bank stocks would have to avoid a bear market following a strong performance in 2021 because bear markets are not conducive to bank M&A.
The caveat was correct. Bear markets developed in both bank stocks and fixed income that included the most deeply inverted U.S. Treasury curve since the early 1980s. Among the data points:
The outlook for deal making in 2023 is challenged by significant interest rate marks (i.e., unrealized losses in fixed-rate assets), credit marks given a potential recession, soft real estate values, and the bear market for bank stocks that has depressed public market multiples. For larger deals, an additional headwind is the significant amount of time required to obtain regulatory approval.
However, core deposits are more attractive for acquirers than in a typical year given rising loan-to-deposit ratios, the high cost of wholesale borrowings and an inability to sell bonds to generate liquidity given sizable unrealized losses. A rebound in bank stocks and even a modest rally in the bond market that lessens interest rate marks could be the catalysts for an acceleration of activity in 2023 provided any recession is shallow.
As of December 28, 2022, there have been 167 announced bank and thrift deals compared to 216 in 2021 and 117 in 2020. During the halcyon pre-COVID years, about 270 transactions were announced each year during 2017-2019.
As a percentage of charters, acquisition activity in 2022 accounted for 3.5% of the number of banks and thrifts as of January 1. Since 1990, the range is about 2% to 4%, although during 2014 to 2019 the number of banks absorbed each year exceeded 4% and topped 5% in 2019. As of September 30, there were 4,746 bank and thrift charters compared to 4,839 as of year-end 2021 and about 18,000 charters in 1985 when a ruling from the U.S. Supreme Court paved the way for national consolidation.
Also notable was the lack of many large deals. Toronto-Dominion’s (NYSE: TD) pending $13.7 billion cash acquisition of First Horizon (NYSE: FHN) represents 61% of the $23 billion of announced acquisitions this year compared to $78 billion in 2021 when divestitures of U.S. operations by MUFG and BNP and several larger transactions inflated the aggregate value.
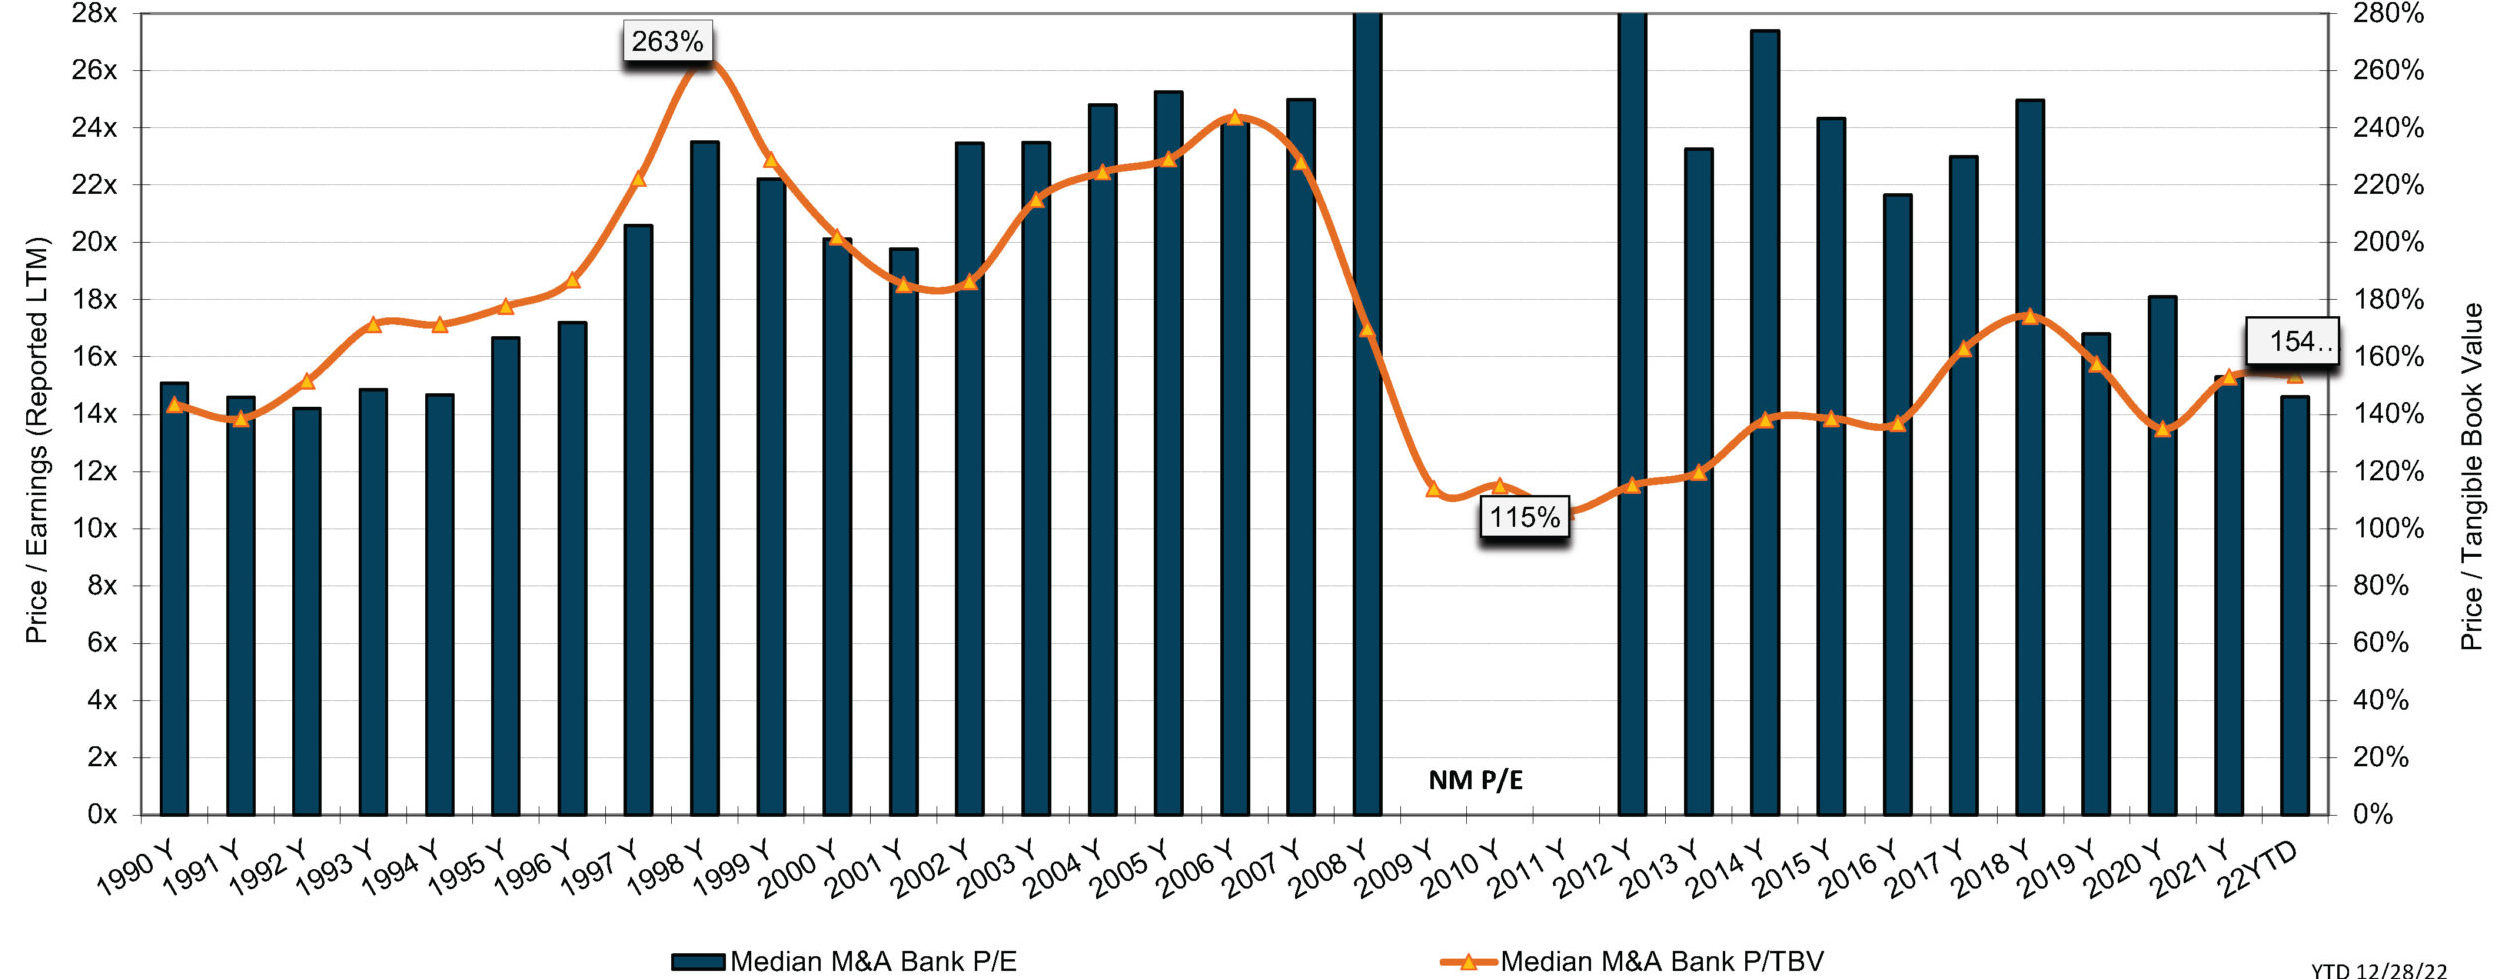
Pricing—as measured by the average price/tangible book value (P/TBV) multiple—was unchanged compared to 2021. As always, color is required to explain the price/earnings (P/E) multiple based upon reported earnings.
The median P/TBV multiple was 154% in 2022. As shown in Figure 1, the average transaction multiple since the Great Financial Crisis (GFC) peaked in 2018 at 174% then declined to 134% in 2020 due to the impact of the short but deep recession on economic activity and markets.
The median P/E in 2022 eased slightly to 14.6x from 15.3x in 2021; however, buyers focus on pro forma earnings with fully phased-in expense saves that often are on the order of 7x to 8x unless there are unusual circumstances. Accretion in EPS is required by buyers to offset day one dilution to TBVPS and to recoup the increase in TBVPS that would be realized on a stand-alone basis as investors expect TBVPS payback periods not to exceed three years.
Click here to expand the image above
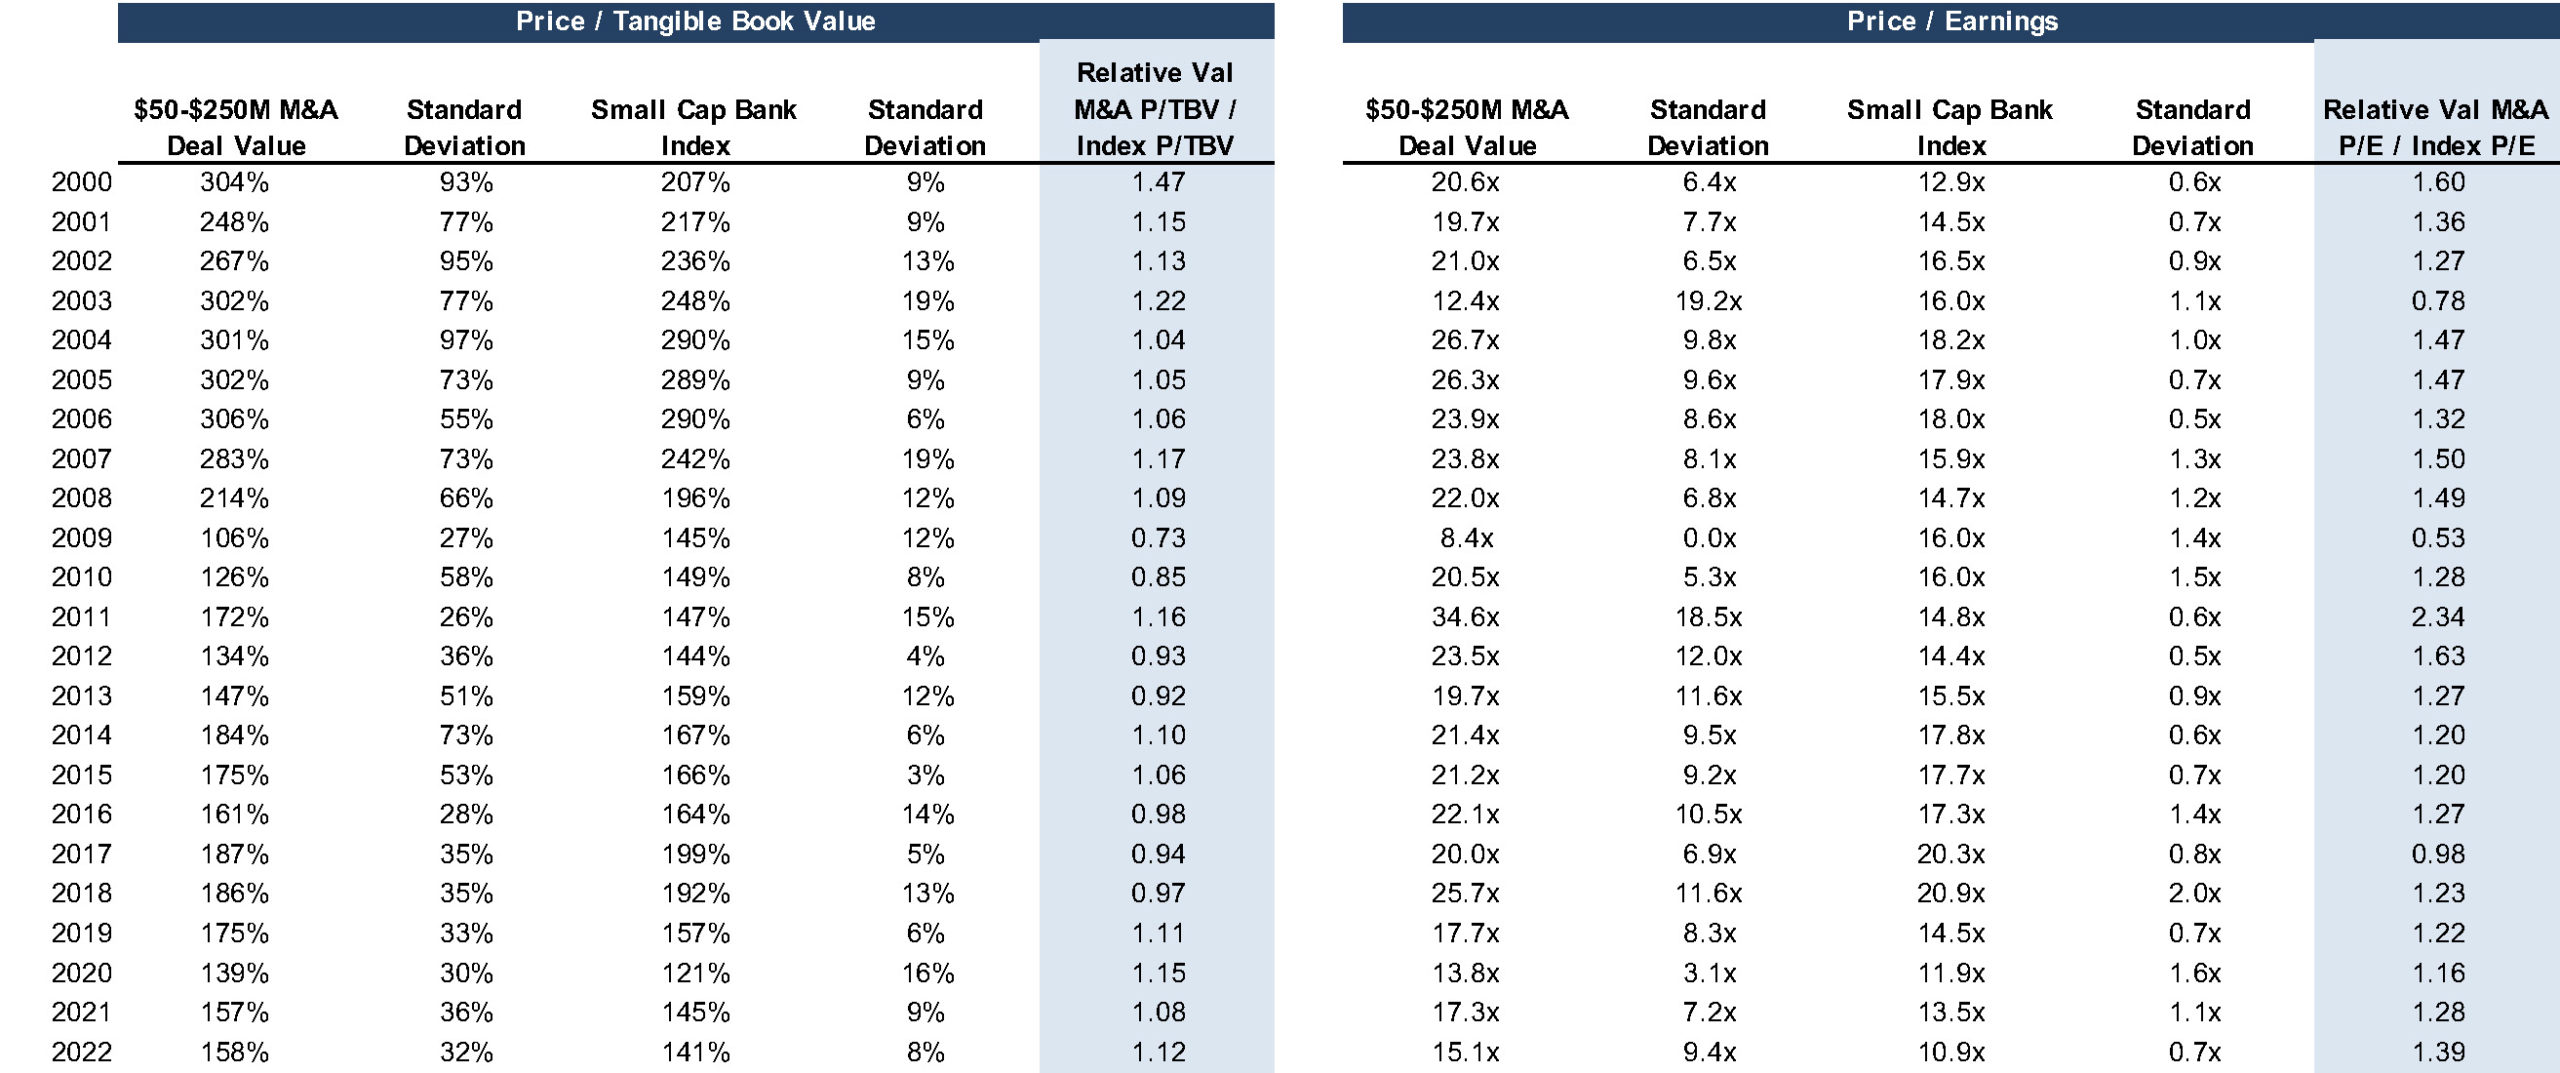
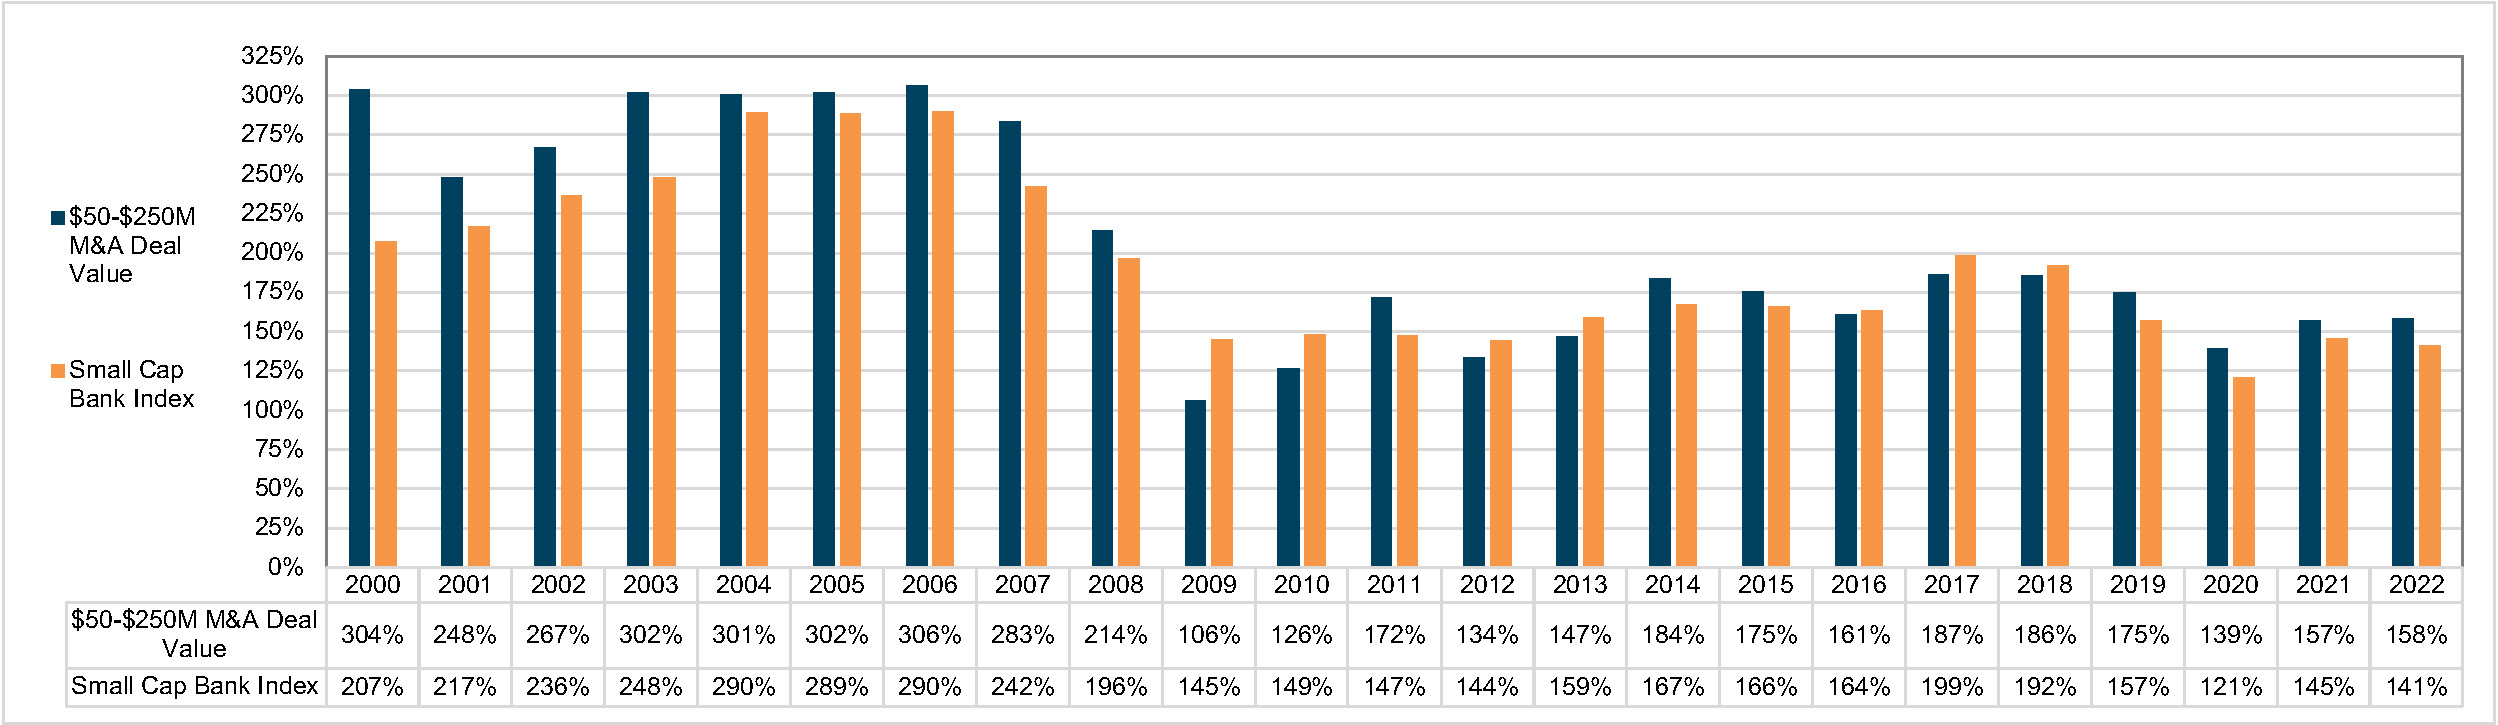
Figure 2 compares the annual average P/TBV and P/E for banks that were acquired for $50 million to $250 million since 2000 with the average daily public market multiple each year for the SNL Small Cap Bank Index.1 Among the takeaways are the following:
Click here to expand the image above
Click here to expand the image above
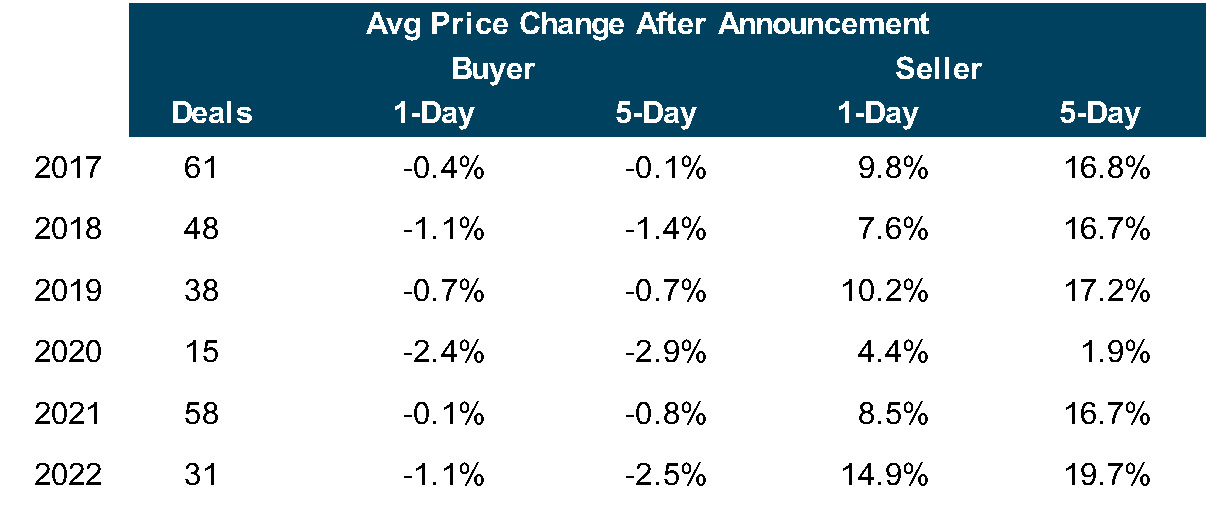
Investors often focus on what can be referred to as icing vs the cake in the form of acquisition premiums relative to public market prices. Investors tend to talk about acquisition premiums as an alpha generator, but long-term performance (or lack thereof) of the target is what drives shareholder returns.
As shown in Figure 4, the average five-day premium for transactions announced in 2022 that exceeded $100 million in which the buyer and usually the seller were publicly traded was about 20%, a level that is comparable to recent years other than 2020. For buyers, the average reduction in price compared to five days prior to announcement was 2.5%. There are exceptions, of course, when investors question the pricing (actually, the exchange ratio), day one dilution to TBVPS and earn-back period. For instance, Provident Financial (NASDAQ: PFS) saw its shares drop 12.5% after it announced it would acquire Lakeland Bancorp (NASDAQ: LBAI) for $1.3 billion on September 27, 2022.
M&A entails a lot of moving parts of which “price” is only one. It is especially important for would be sellers to have a level-headed assessment of the investment attributes of the acquirer’s shares to the extent merger consideration will include the buyer’s common shares. Mercer Capital has 40 years of experience in assessing mergers, the investment merits of the buyer’s shares and the like. Please call if we can help your board in 2023 assess a potential strategic transaction.