Bank M&A 2024 — Off the Bottom
In our year ago M&A epistle, we speculated that activity would improve and that a related theme could be equity recap transactions. The prediction was hardly heroic because M&A activity in 2023 represented a multi-decade low, while low public market multiples for a small subset of banks with high CRE exposure signaled investor expectations that an equity infusion was possible.
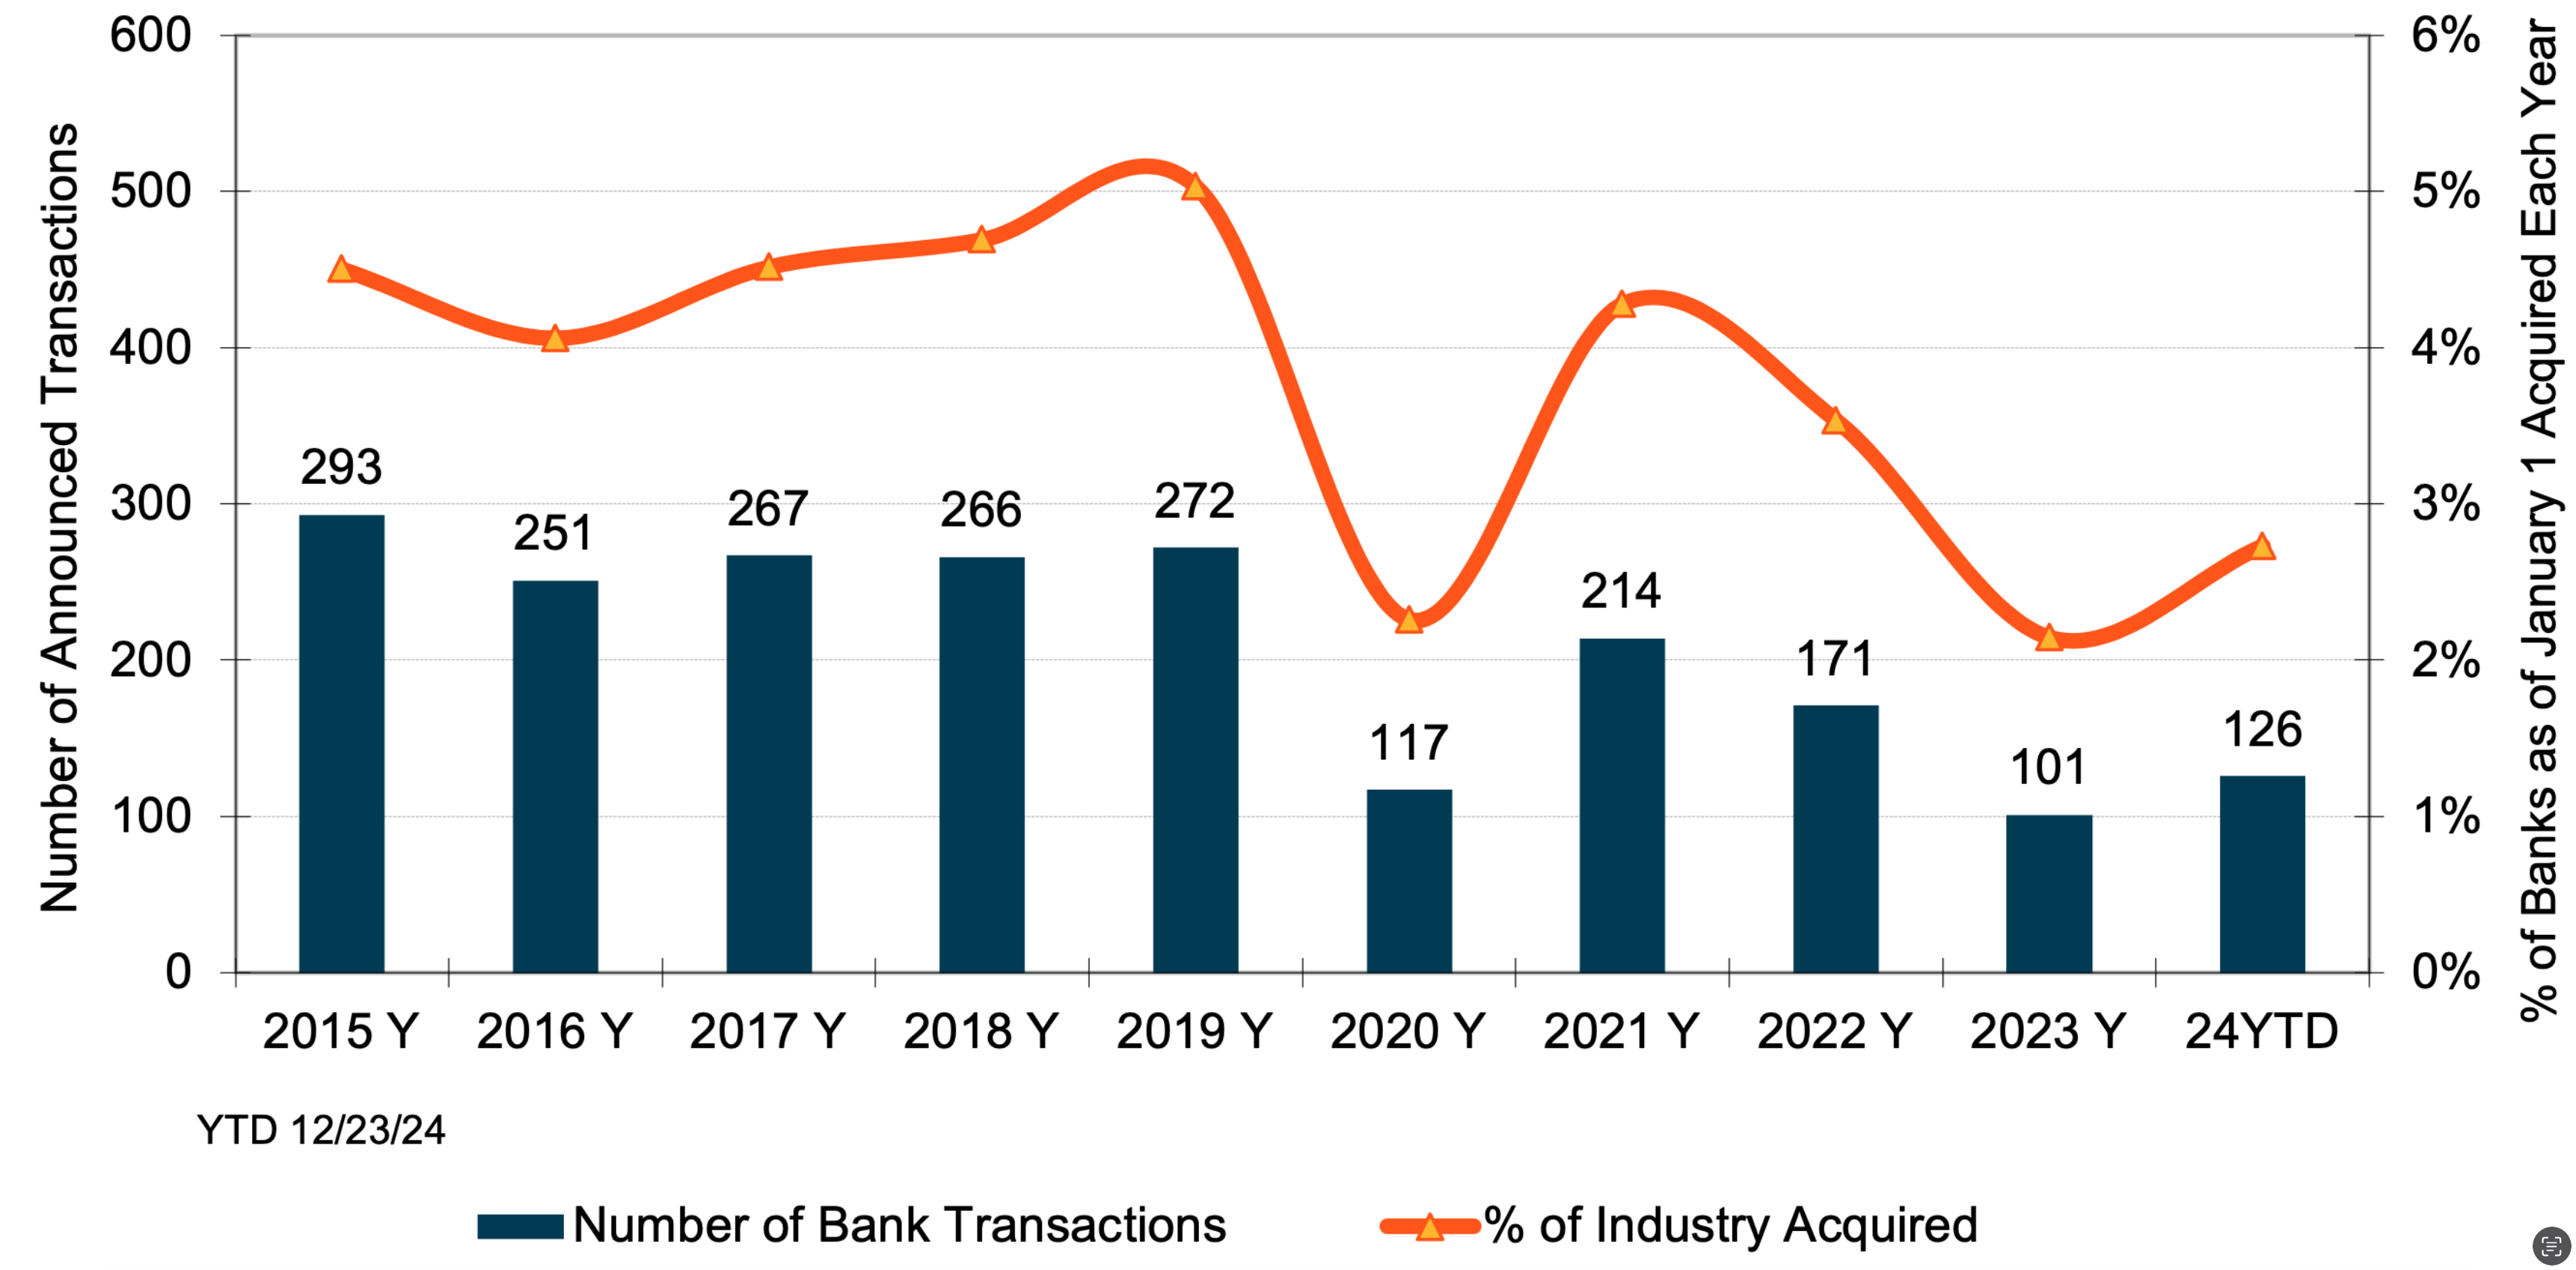
M&A activity rose off the bottom in 2024, but not by much while pricing remained modest by historical standards. There were 126 transactions as of December 23 that equated to 2.7% of January 1 bank charters compared to the multi-decade low of 101 transactions in 2023 (2.1%). Transactions with a disclosed value increased to 54 with an aggregate value of $16.8 billion from 26 deals in 2023 ($4.2 billion), though the aggregate value this year was the sixth lowest since 1990.
There were two notable equity recaps (Flag Financial, NYSE: FLG; First Foundation, NASDAQ: FFWM) and lots of equity raises to fund balance sheet restructurings, including a $2.8 billion equity raise by KeyCorp (NYSE: KEY). We look for more equity raises in 2025.
The set-up as of year-end 2024 is for much more M&A activity in 2025.
- Institutional investors have supported M&A by funding nine common raises buyers undertook to strengthen post-closing capital ratios.
- Bank stocks as acquisition currencies improved as P/E multiples have expanded to 11-13x consensus 2025 estimates compared to 9-11x consensus 2024 estimates last year.
- Earnings are expected to improve in 2025 after two years of contraction for many banks as NIMs stabilize or improve while credit costs increase only modestly.
- The incoming Trump Administration is expected to pursue policies that are business friendly, including the appointment of bank regulators who nix or modify a range of burdensome regulatory edicts and more quickly approve merger applications.
How much, if any, M&A activity accelerates with or without improved pricing in 2025 remains subject to multiple variables as always. The economy and bank credit quality are in good (or good enough) shape and public market multiples have improved.
Also, spreads on high-yield bonds and leverage loans are tight at multi-year lows, reflecting investor optimism about credit quality for the time being. The corollary is that credit marks for most sellers were limited compared to the existing loan loss reserve before factoring in the CECL “double counting” reserve build.
Figure 1 – National Bank M&A Activity

However, there is one roadblock that remains: the bond market. Since the first Fed rate cut in mid-September, yields along the belly and long-end of the UST curve have increased 60-80bps with yields approaching the October 2023 cycle highs. Mark-to-market of would-be sellers fixed-rate loan and bond portfolios is a much greater pricing hurdle for buyers and sellers than was the case in September as unrealized losses are, in effect, realized as far as merger accounting is concerned.
The “why” market determined rates have risen could impact bank M&A activity, too. If rising rates signal an expected strengthening in the economy, then lending and bank earnings should improve, which would support M&A. Alternatively, M&A activity may remain depressed if rising rates signal more inflation, which in turn probably would weigh on public market P/E multiples.
Multi-Decade Low Pricing (x-GFC Years)
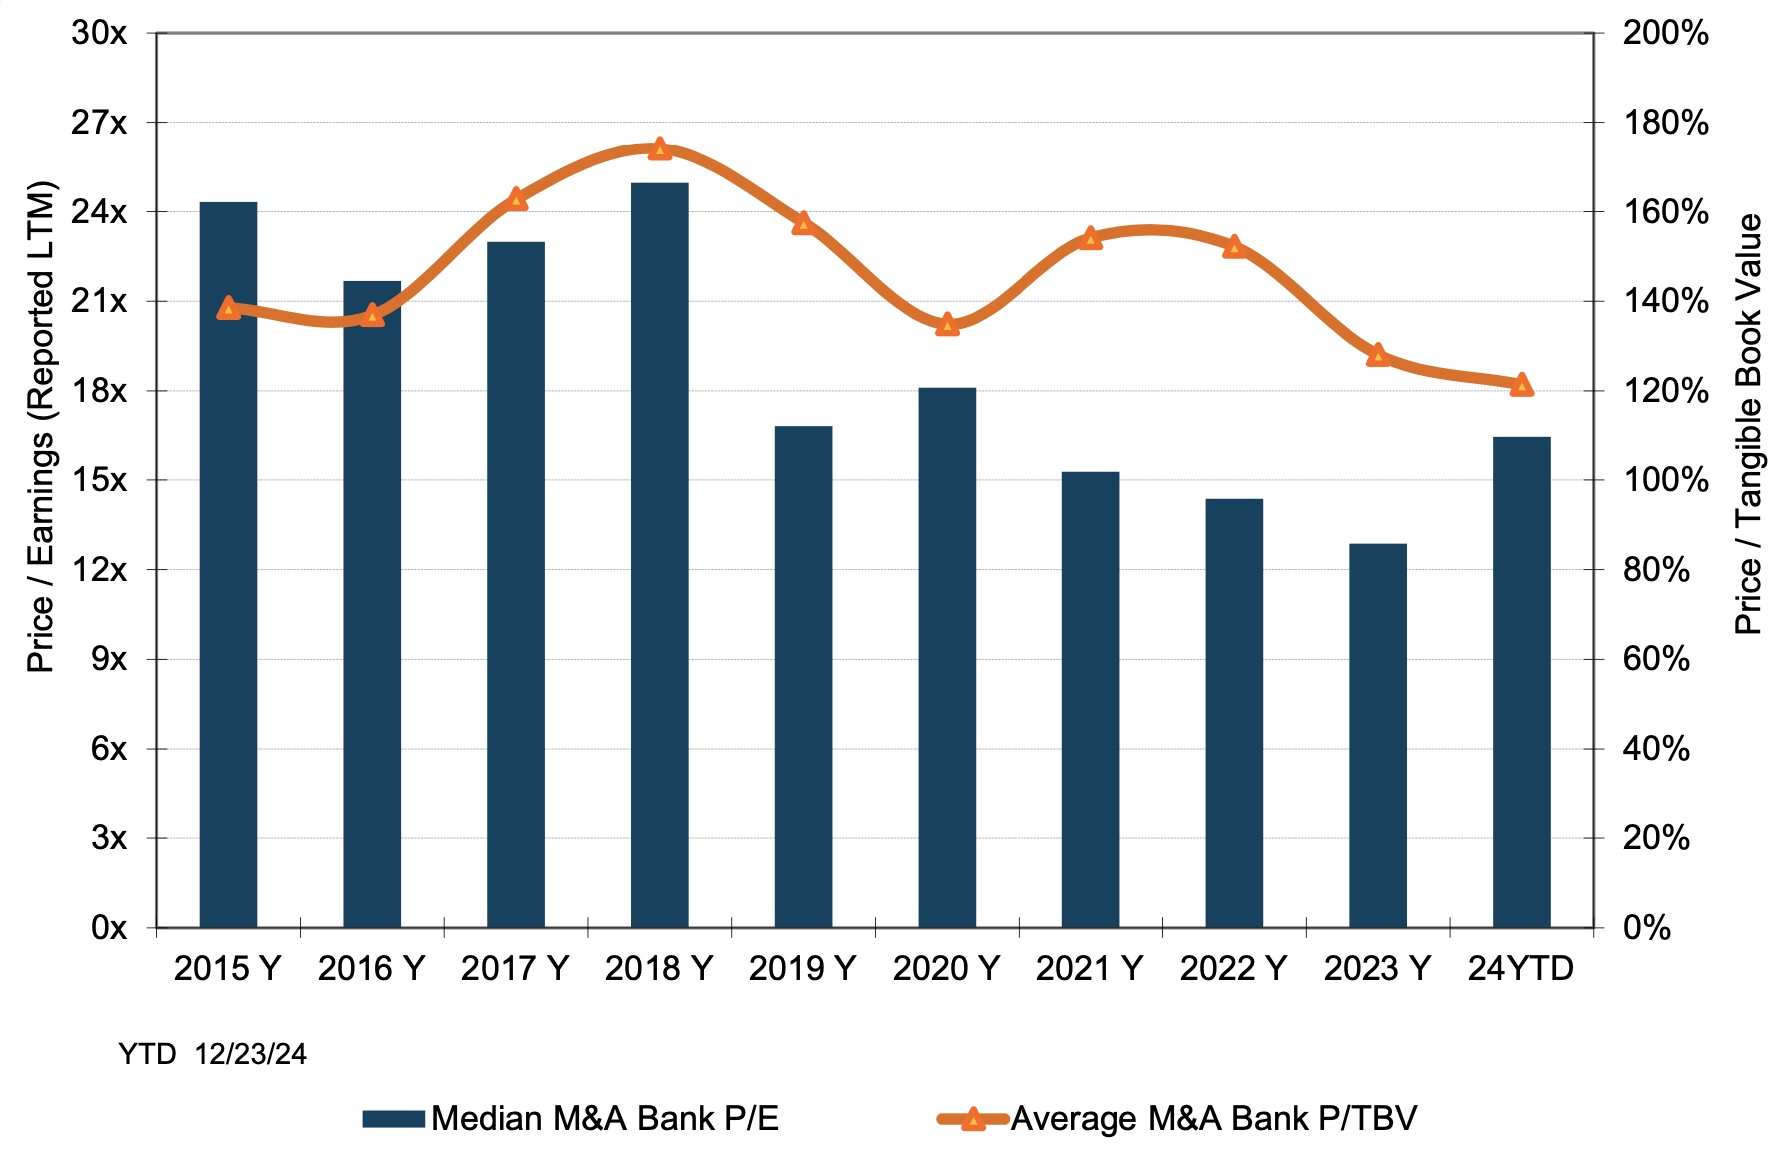
As shown in Figure 2, the average M&A P/TBV multiple declined to 120%, a multi-decade low excluding the post-GFC clean-up years of 2009-2012. The post-GFC peak average multiple of 174% occurred in 2018 as public market multiples expanded in 2017 with the reduction in corporate tax rates and then gradually rising short-term rates that caused NIMs to expand without much mark-to-market drawbacks. Since then, multiples have trended lower as the flat yield curve of 2019 gave way to COVID in 2020, sharply rising rates in 2022, the failure of SVB in March 2023 and a deeply inverted yield curve that only recently un-inverted.
Figure 2 – National Average M&A Multiples

The median P/E improved to 16.4x in 2024 from 12.9x in 2023 largely because sellers had lower profitability as reflected in reported trailing 12-month earnings vs 2023 sellers whose earnings reflected higher NIMs. Regardless, buyers are focused on proforma earnings as measured by the sum of core earnings plus after-tax expense savings. Generally, proforma P/Es are in the range of 6x to 9x when buyers are public and report the metric to investors though pricing has tended toward (or below) 6x for community bank sellers the past two years.
Modest multiples inclusive of expense saves are necessary to generate EPS accretion, and EPS accretion is necessary to recoup day one dilution to TBVPS. Since the GFC, investors have been intensely focused on the time to recover TBVPS dilution as a means to limit buyers’ pricing flexibility. Our take on current pricing is that investors want recovery in 2-3 years, in part because there is too much uncertainty about future EPS accretion vis-à-vis certainty about day one dilution.
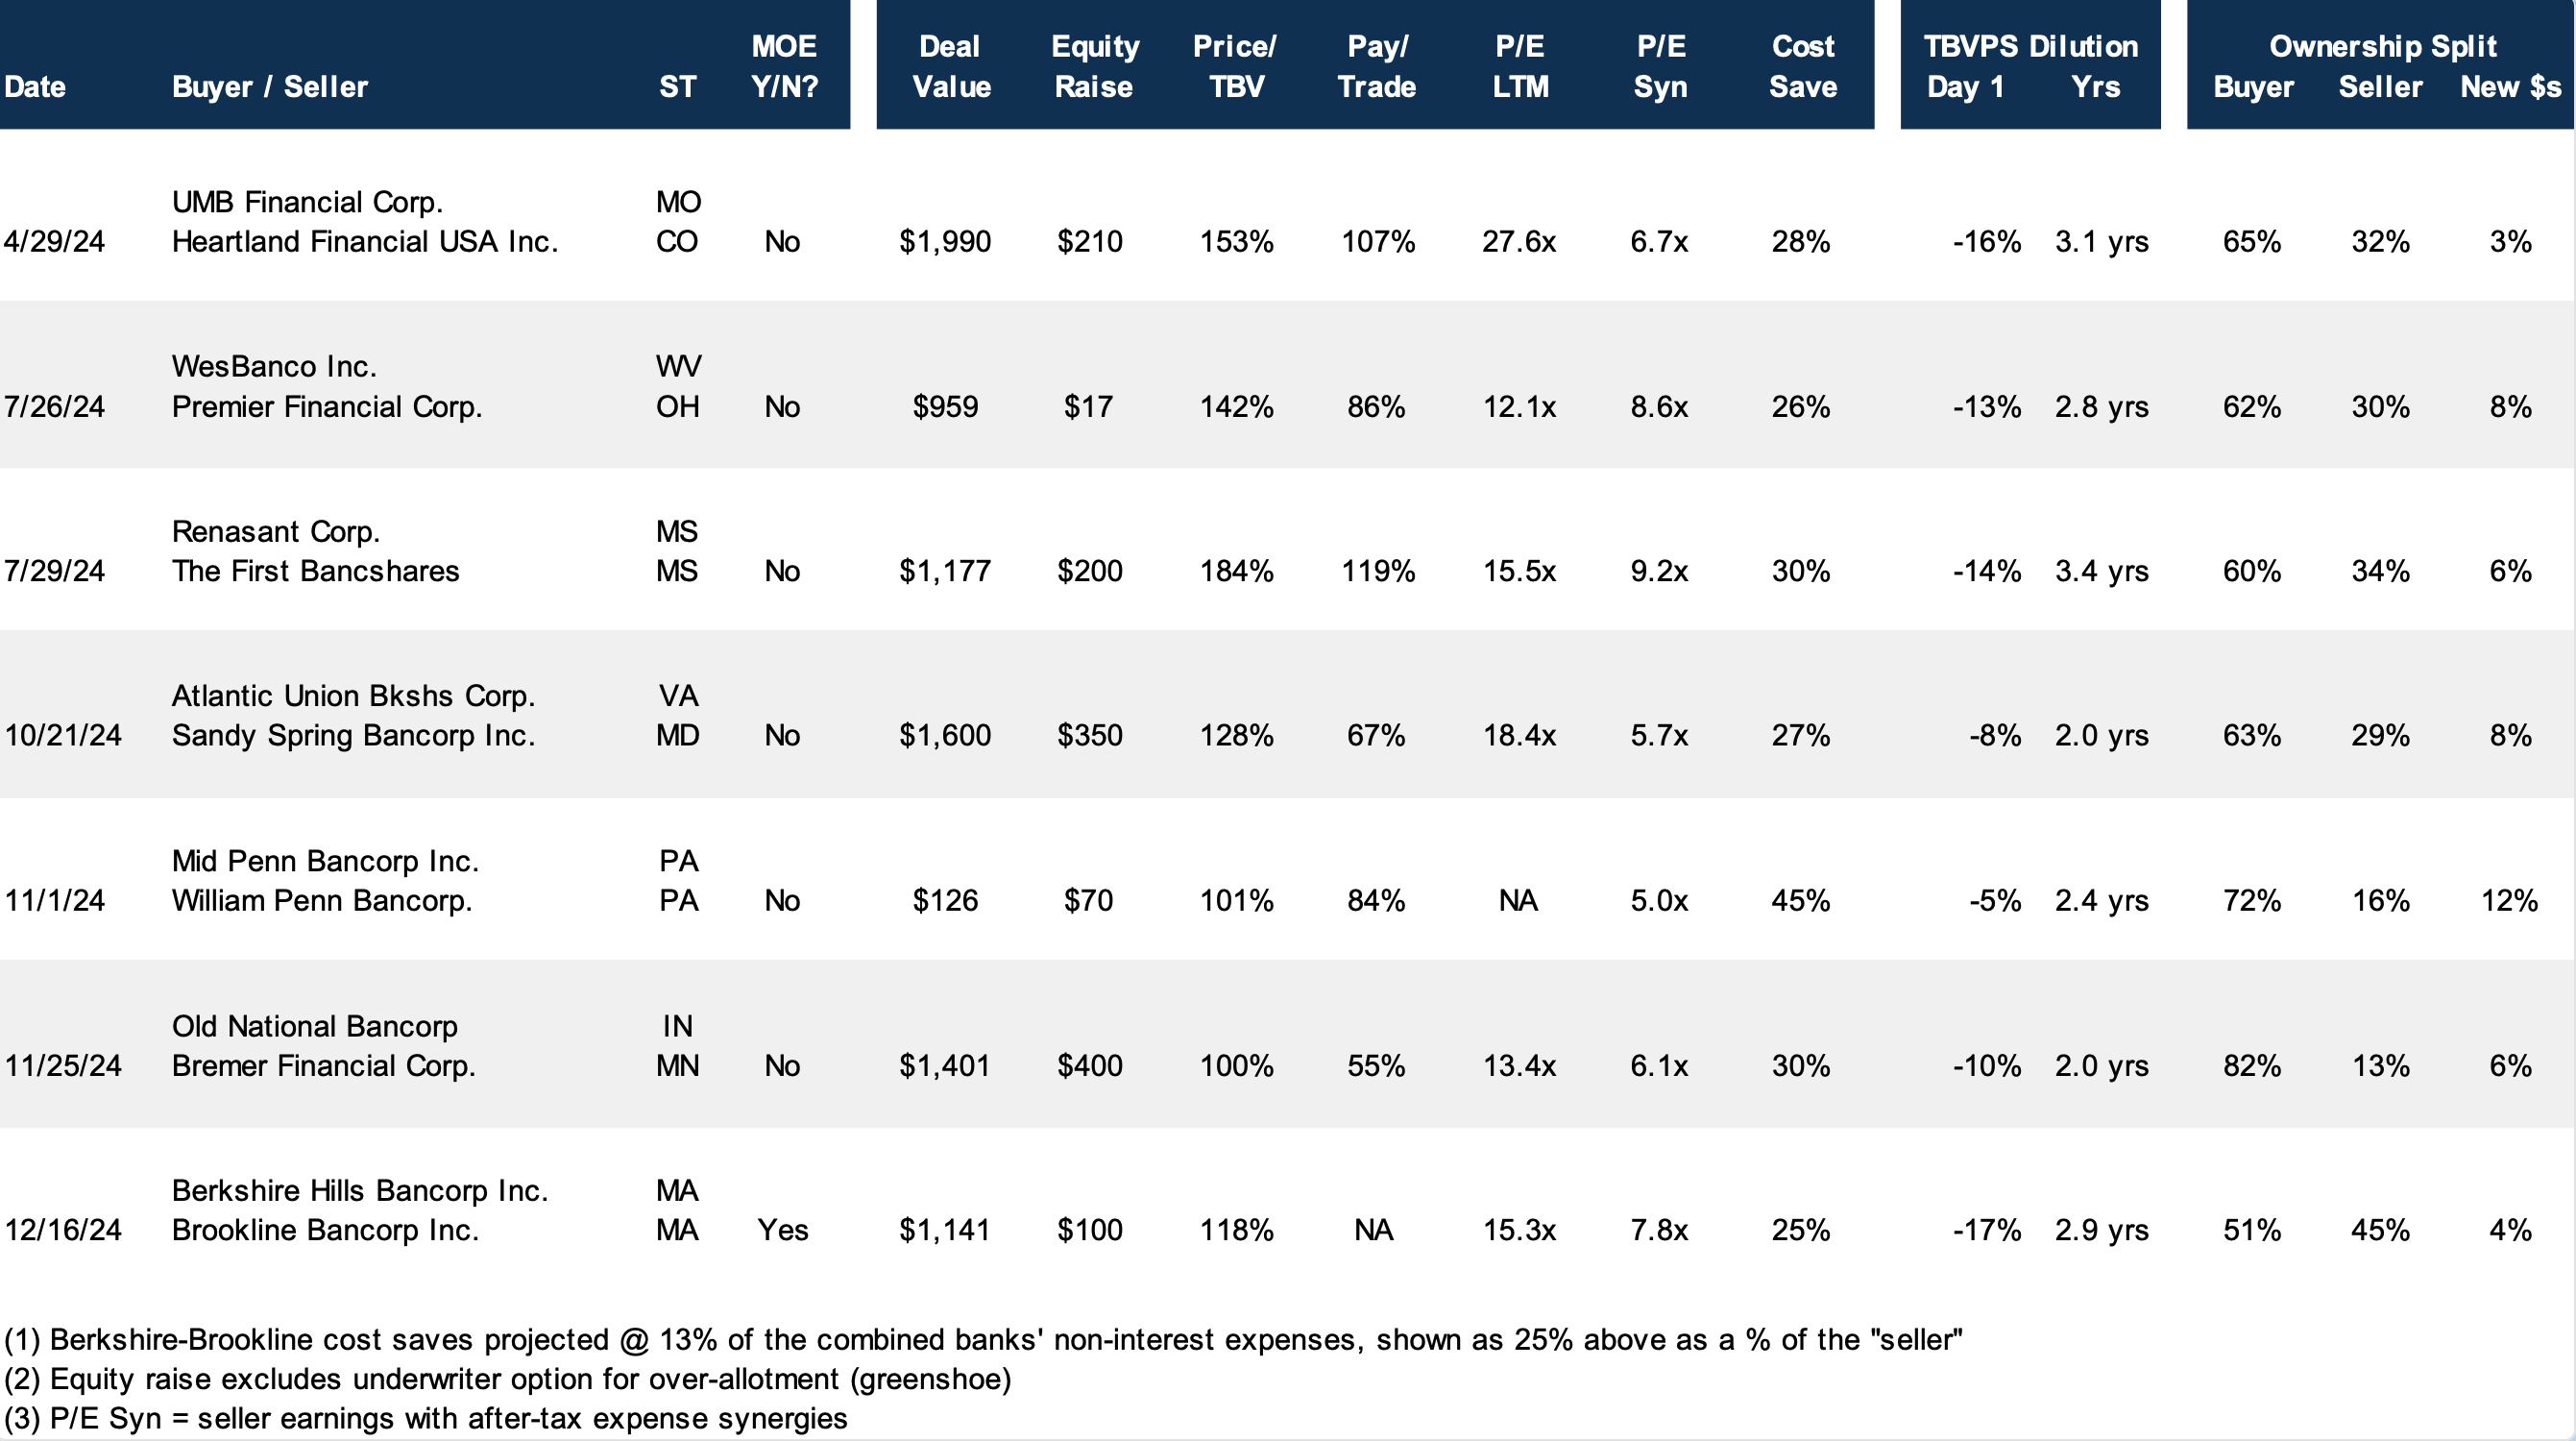
Figure 3 – Notable Deals with Common Raises

Click here to expand the image above
Institutional Investor Sentiment Improves
The bear market of 2022-3Q23 gave way to a bull market in 4Q23 that improved investor sentiment and provides a foundation for a better M&A market in 2025 if bank stocks hold gains or improve further (see Figure 4). Large banks as measured by the S&P 500 Bank Index rose 34% year-to-date through December 23 as investors reassessed the potential for large bank M&A in the Trump Administration overlaid with business models that are more geared to the booming capital markets. Among smaller bank indices, the NASDAQ Bank and KBW Regional Bank indices rose 17% and 10%, respectively.
Although M&A pricing was subdued in 2024, we view the willingness of institutional investors to provide buyers equity at a 4-5% discount to the market as a notable positive that underpins support for transactions that are appropriately priced and structured. Generally, the capital is needed to offset day one dilution to the tier one common equity capital ratio that otherwise would be recovered via earnings within several years and/or reduce the proforma CRE/capital ratio.
Another encouraging data point from 2024 was the market reaction to perennial acquirer Old National Bancorp (NYSE: ONB) when it announced the acquisition of Minneapolis-based Bremer Financial Corp. for $1.4 billion of stock and cash on November 25. ONB’s shares rose 6% on the announcement that entailed pricing around BFC’s tangible book value (though not marked TBV), the sale of CRE loans, and a $400 million common raise. Positive reactions encourage activity just as negative reactions are a hurdle.
Public Market Multiples vs Acquisition Multiples
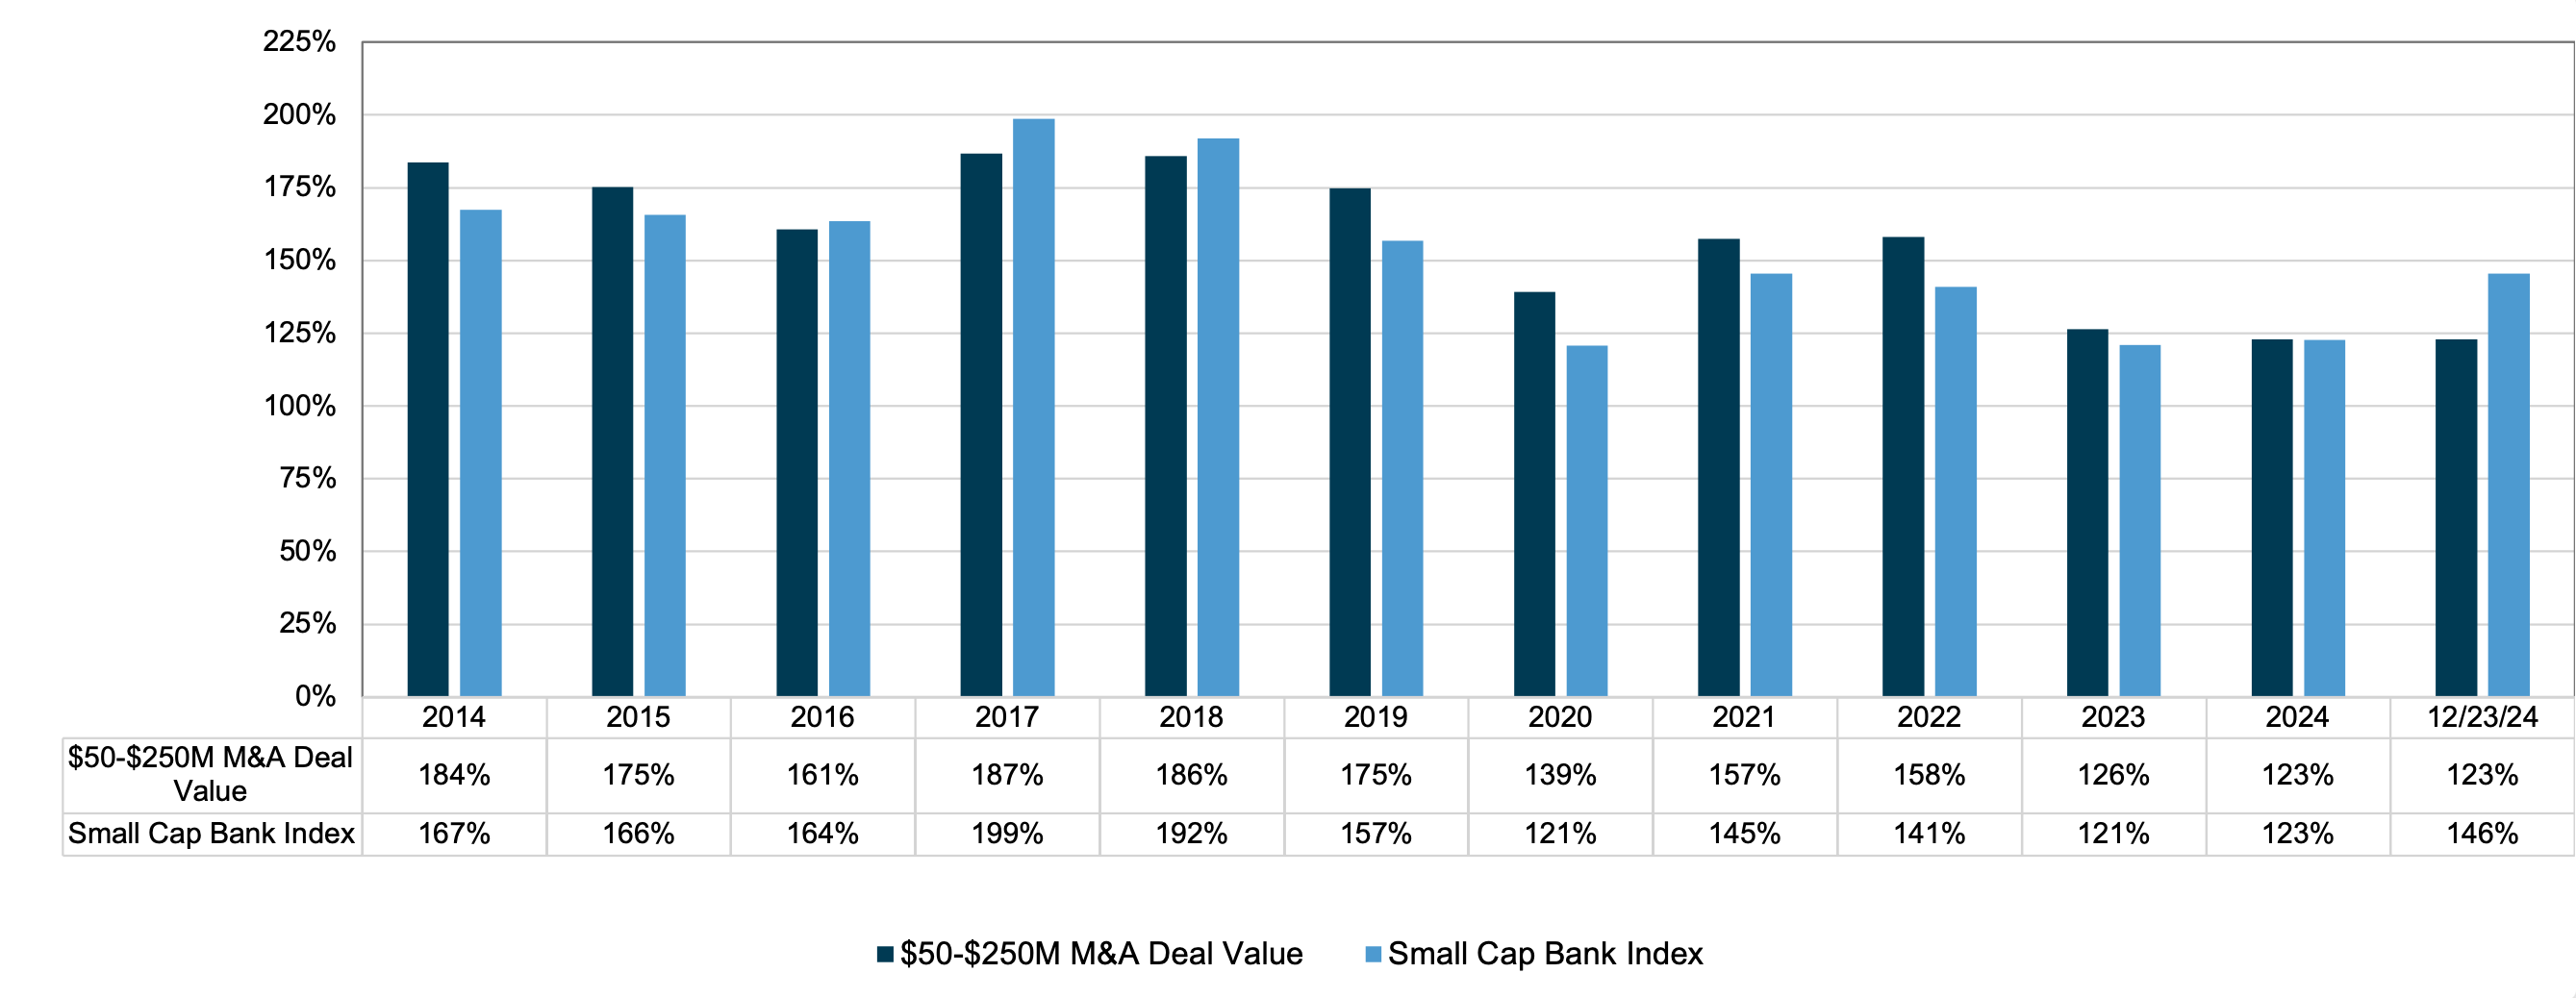
Figure 4, compares the annual average P/TBV for banks that were acquired for $50 million to $250 million with the average daily public market multiple each year for the SNL Small Cap Bank Index. The chart illustrates the point that acquisition pricing is highly correlated with public market multiples.
Figure 4 – Average Annual M&A P/TBV vs Public Market P/TBV

Click here to expand the image above
Buyers measure this differential as the pay-to-trade ratio, which is the market-based measurement of the book-to-book ratio when the seller marked equity for known problem loans not covered in the loan loss reserve, appreciated assets, contingent liabilities and the like. Generally, transactions that involve a publicly traded buyer will entail a pay-to-trade multiple in the vicinity of 80% to 95% though sometimes a multiple above 100% may be observed when the seller’s earning power may be understated, or strategic considerations cause the buyer to step up.
Although not shown, pay-to-trade ratios when based upon the seller’s proforma P/E with expense saves vs the buyer’s P/E should be well below 1.0x, otherwise there would be no EPS accretion and no recovery of day one dilution to the buyer’s TBVPS.
The Exchange Ratio vs “Price”
While investors are focused on price, it is worth noting that the central issue in M&A is the exchange ratio rather than price when the sole or primary consideration is shares of the buyer. Price is a function of the buyer’s share price, which fluctuates daily, and the exchange ratio. Whether the buyer’s shares are reasonably priced is a separate issue to consider. Nonetheless, sellers who transacted in 2023 and 2024 may have been disappointed by pricing vs the pre-COVID years but likely received shares that were attractively priced that performed well during 2H24. Likewise, buyers who transacted in 2018 may have encountered the opposite situation. The outlook for 2025 seems to fall somewhere between the two as of late year 2024.
About Mercer Capital
M&A entails a lot of moving parts of which “price” is only one. It is especially important for would be sellers to have a level-headed assessment of the investment attributes of the acquirer’s shares to the extent merger consideration will include the buyer’s common shares. Mercer Capital has 40 years of experience in assessing mergers, the investment merits of the buyer’s shares and the like. Please call if we can help your board in 2025 assess a potential strategic transaction.


