Equity investors define a bear market as a 20% or greater reduction in price from the most recent high price. There is no consensus for fixed income. A bond’s maturity and coupon are key variables in determining the sensitivity of price except when overlaying credit and prepayment variables when applicable.
A simple definition might be when the price falls more than three times the annual income for any bond with a maturity greater than five years. If so, it is a low bar when coupons are as low as they are. Definitions aside, the bond market is in a bear market.
Figure 1 :: 1994 Bear Market vs 2022 Bear Market
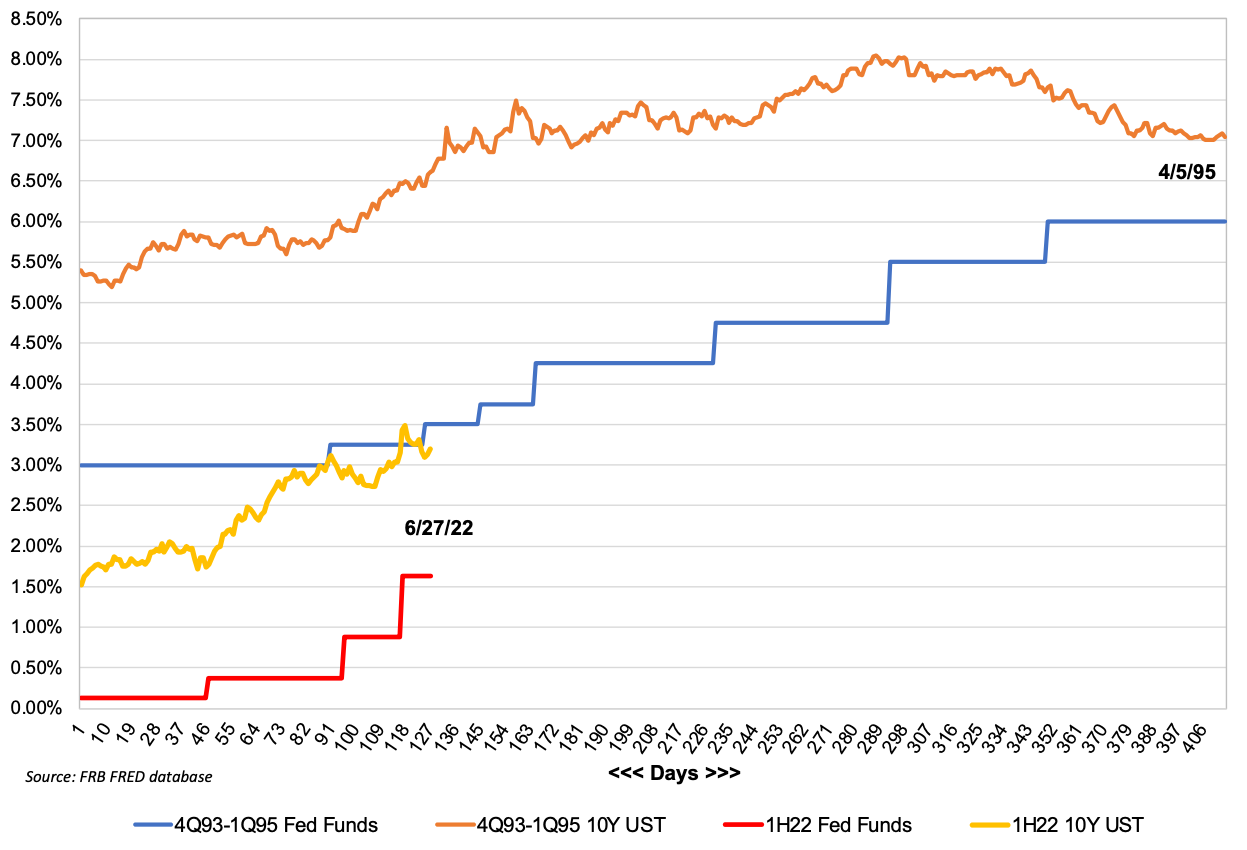
The yield on the 10-year U.S. Treasury note (“UST”) was 3.21% on June 27, up from 1.51% as of year-end. Ignoring the impact of the intervening six months for what would be a bond with 9.5 years to maturity, the increase in yield has produced a ~14% loss in value.
The last bond bear market that was brutal occurred in 1994 when the Fed raised the Fed Funds target rate from today’s aspirational rate of 3.0% beginning in February to 6.0% by February 1995. The yield on the 10-year UST rose from 5.19% on October 15, 1993 to a peak of 8.05% on November 7, 1994 once the market could see the last few Fed hikes to come. The 286bps increase in yield pushed the price of the 10-year UST down by 17%, which modestly exceeds the 14% loss this year.
Coupons matter. Fixed income investors entered the current rising rate environment with little coupon to cushion rising yields unlike in the years immediately after the Great Financial Crisis when the Fed first implemented a zero-interest rate policy (“ZIRP”).
Worse, banks entered the current bear market with much bigger securities portfolios given the system was inundated with excess deposits because of actions taken by the Fed and government to offset the COVID-19 recession.
To get a sense of the damage in bank bond portfolios consider Figures 2 and 3 where we have compared the unrealized losses in bank bond portfolios as of March 31 with the unrealized losses as of year-end 1994, which roughly corresponded to the bottom of the 1994 bear market. The data reflects averages.
Figure 2 :: Unrealized Losses in Bank Portfolios as of March 31, 2022
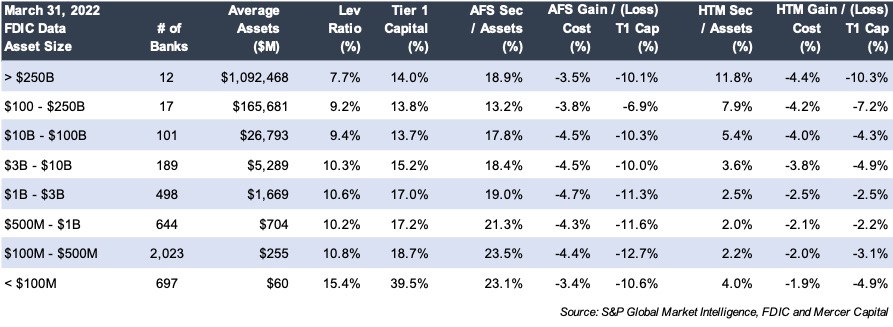
Figure 3 :: Unrealized Losses in Bank Portfolios as of December 31, 1994
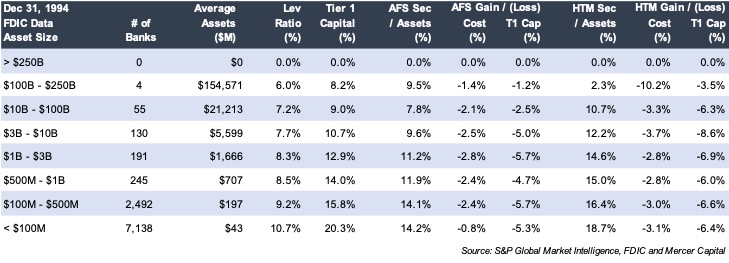
We make the following observations for banks with $1 billion to $3 billion of assets:
Banks are sitting on large unrealized losses today. Investors know that. The bear market in bank stocks (the NASDAQ Bank Index is down ~19% YTD) primarily reflects investor expectations about the potential impact a recession would have on credit costs next year even though NIMs will increase this year (excluding the impact of PPP loan fees) and next provided the Fed does not pivot and reduce rates. The current equity bear market is not about unrealized losses in bond portfolios; it is about the economic outlook.
From a valuation perspective, we primarily look to the impact of rising (or falling) rates on a bank’s earnings rather than how changes in rates have impacted the value of the bond portfolio and tangible book value. Assuming an efficient market, the unrealized losses represent the opportunity cost of holding bonds with coupons below the current market rate. If the underwater bonds are sold and immediately repurchased, then the bonds repurchased will produce enough extra income over the life of the bonds to recoup the loss (assuming an efficient market).
Further, the AFS securities portfolio is the only asset for most banks that is marked-to-market other than mortgage loans pending sale. Fixed rate residential and CRE loans would have sizable losses, too, if subjected to mark-to-market. Rates have risen, prepayment speeds have slowed and in the case of CRE credit spreads have widened.
Also not marked-to-market are deposits. Though a liability, core deposits are the key “asset” for commercial banks. Value for deposits—especially non-interest-bearing deposits—are soaring given a low beta to changes in market interest rates when loan-to-deposit ratios are low.
The monthly report that really matters is not the bond report but the asset-liability model (“ALM”). Banks manage net interest margin (price) and assets (volume) to drive earnings; and earnings (or cash flow) drive stocks over time. Earnings also build book value to the extent earnings are retained.
Rising rates—gradually rather than rapid—are a positive development given the commercial bank business model, assuming that credit quality does not deteriorate.
Having said that, we cannot completely dismiss the unrealized losses in the bond portfolios. Some investors focus on tangible book value, though we view it as a proxy for earning power because tangible book value is levered to produce net interest income.
Also, M&A is more challenging because day one dilution to tangible BVPS is greater to the extent unrealized bond losses are recognized via fair value marks applied to all assets. Of course, earnings then increase from accreting the discounts as additional yield.
Aside from the soaring value of core deposits, the glass half full view is bonds and fixed rate loans eventually mature. In the interim, cash flows should be reinvested to produce better yields.
Mercer Capital is a national valuation and transaction advisory firm that has advised banks for 40 years through bear and bull markets. Please give one of our professionals a call if we can be of assistance.