Fixed income is undergoing one of the deepest bear markets in decades this year. There has been a lot of discussion surrounding the impact of rising rates on bank bond portfolios and bank stocks as rising rates have resulted in large unrealized losses in bank bond portfolios. My colleague, Jeff Davis, provides an update to his previous commentary on the topic based on third quarter Call Report data here.
If subjected to mark-to-market accounting like the AFS securities portfolio, most bank loan portfolios would have sizable losses too given higher interest rates and wider credit spreads; however, unrealized “losses” in loan portfolios do not receive much attention because there is not an active market for most loans unlike most bonds that populate bank portfolios. Further, accounting standards do not mandate mark-to-market for loans other than those held-for-sale.
While the trend in loan portfolio fair values is harder to examine given the lack of data, the following charts provide some perspective based on a survey of periodic loan portfolio valuations by Mercer Capital. To properly evaluate a subject loan portfolio, the portfolio should be evaluated on its own merits, but markets do provide perspective on where the cycle is and how this compares to historical levels.
Fair value is guided by ASC 820 and defines value as the price received/paid by market participants in orderly transactions. It is a process that involves a number of assumptions about market conditions, loan portfolio segment cash flows inclusive of assumptions related to expected prepayments and expected credit losses, appropriate discount rates, and the like.
The fair value mark on a subject loan portfolio includes two components – an interest rate mark and a credit mark. The interest rate mark is driven by the difference in the weighted average discount rate and weighted average interest rate of the subject portfolio. The discount rate that is applied to a subject loan should reflect a rate consistent with the expectations of market participants for cash flows with similar risk characteristics. The credit mark captures the risk that the borrower will default on payments and not all contractual cash flows will be collected.
Since the end of 2021, rising market interest rates have been the predominant factor driving the change (i.e., reduction) in loan portfolio fair values. As shown in Figure 1, the median interest rate mark for our data sample has fallen from a modest 0.55% premium at December 31, 2021 to a 5.65% discount as of September 30, 2022. While bank earnings benefit from a higher rate environment and net interest margin expansion, it takes time for the increase in market rates to be passed on to customers via higher loan rates and for lower, fixed-rate loans to roll out of the portfolio. In talking with Mercer Capital clients and in our loan portfolio valuation practice, so far it seems that banks have been unable to fully pass on the increase in rates to loan customers.
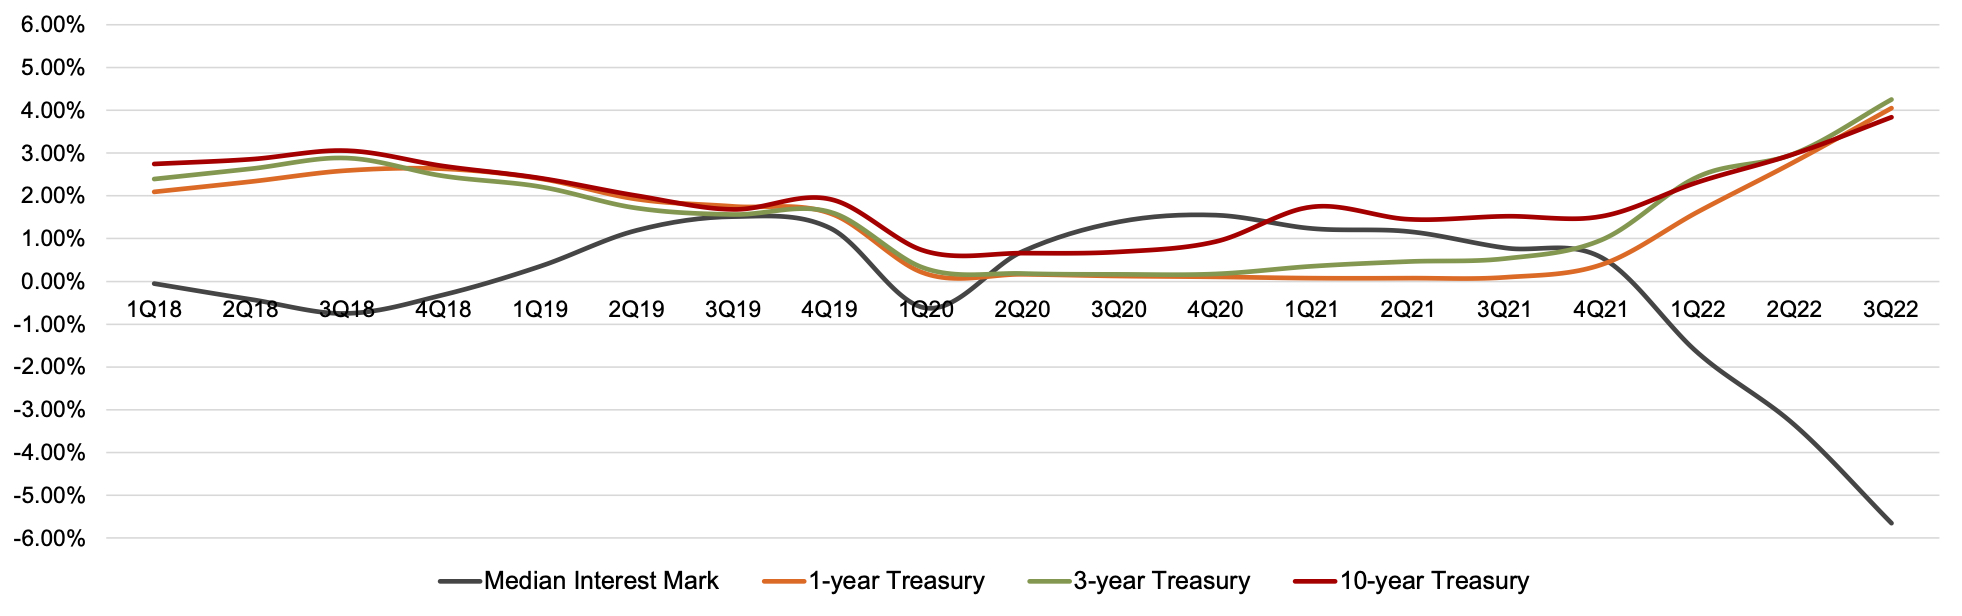
Click here to expand the image above
The shift in the valuation adjustment attributable to interest rates reflects an increase in market interest rates. Figure 2 depicts the LIBOR forward curve at December 31, 2021, March 31, 2022, June 30, 2022, and September 30, 2022. Relative to December 31, 2021, forward LIBOR rates have increased 66 bps to 394 bps on average with the largest increases occurring for periods ranging from 1 to 12 months following the valuation date.
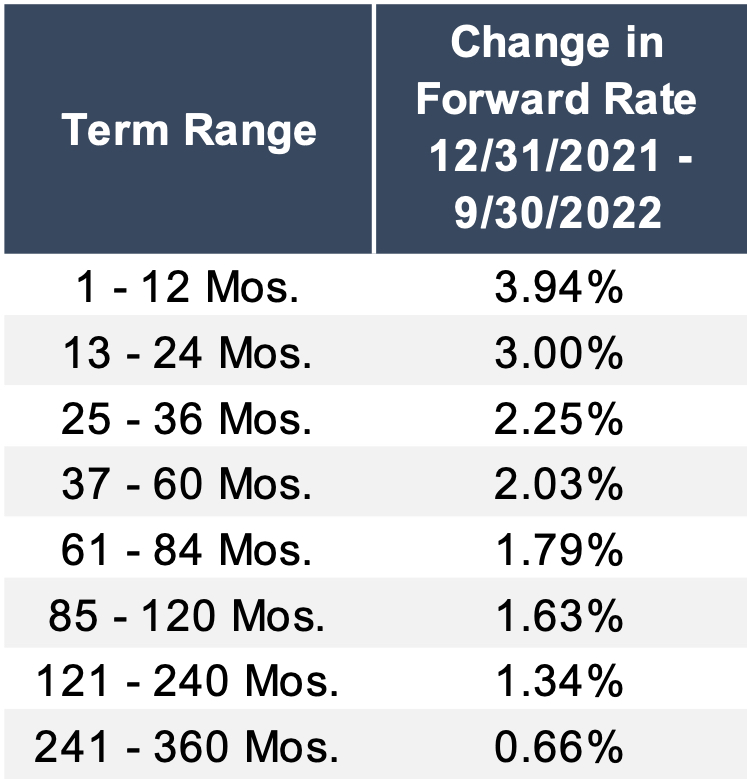
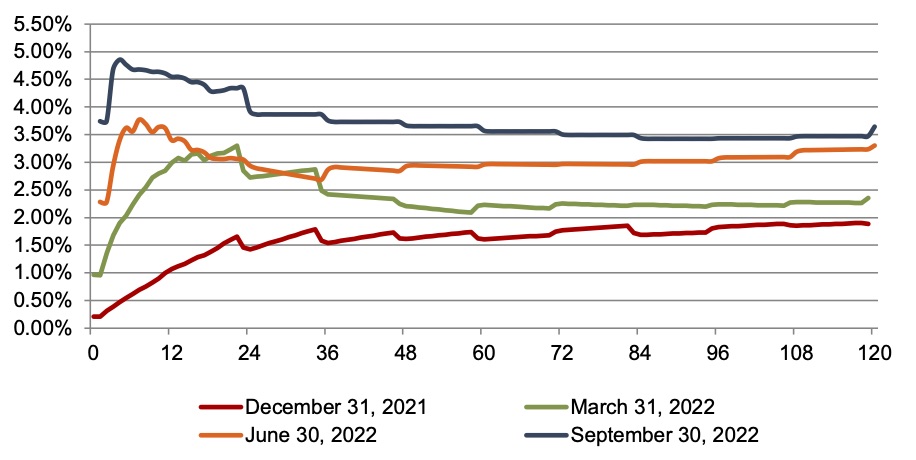
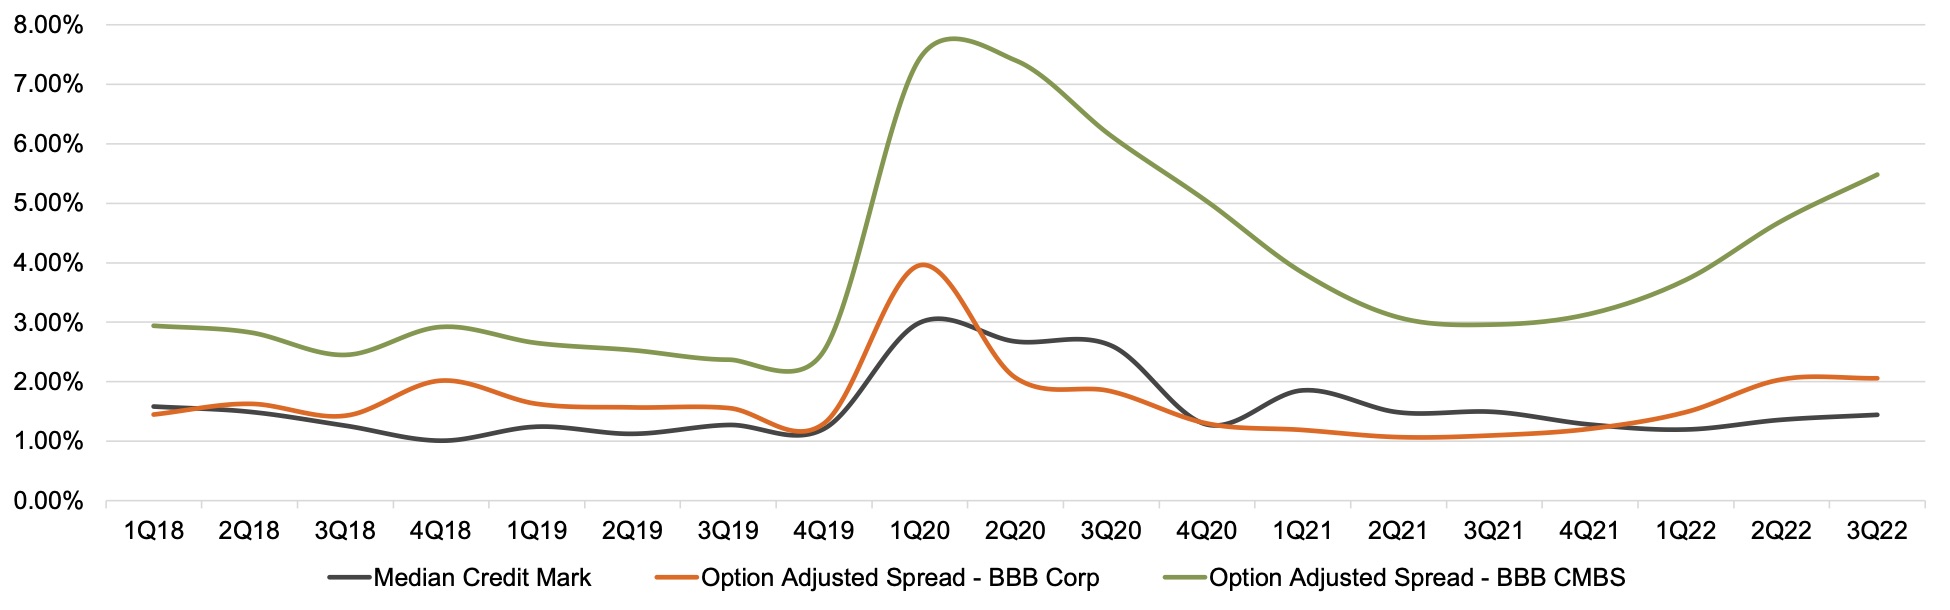
Figure 3 depicts the trend in the credit mark for our data sample relative to credit spreads. Credit spreads provide perspective on a number of factors, including where the credit cycle has been and where we may be headed.
Click here to expand the image above
Over the period shown in Figure 3, credit marks peaked at the start of the pandemic given the uncertainty and expectation of higher losses on loan portfolios. Credit marks trended down from the March 31, 2020 peak through the first quarter of 2022, as did banks’ loan loss provisions, as credit quality remained stable. While credit quality continues to remain strong, both credit spreads and credit marks have ticked up in 2022 with the weakening economic outlook and concerns that the Federal Reserve’s tightening interest rate policy may trigger a sharper downturn in economic activity.
Mercer Capital has extensive experience in valuing loan portfolios and other financial assets and liabilities including depositor intangible assets, time deposits, and trust preferred securities. Please contact us if we can be of assistance.