This article begins a series focused on the two issues most central to our work at Mercer Capital: What drives value for a depository institution and how are these drivers distilled into a value for a given depository institution?
We leave the more technical valuation discussion for subsequent articles. At its core, though, value is a function of a specified financial metric or metrics, growth, and risk.
Many industries have a valuation benchmark used by industry participants, although this metric does not necessarily cohere with benchmarks used by investors. In the banking industry, “book value” fills this role. In fact, there are several potential measures of book value, including:
The most commonly used book value metric is tangible book value (or TBV). Like most industry benchmarks, simplicity and commonality are reasons industry participants embrace TBV as a valuation metric. Strengths of TBV as a valuation metric include:
While TBV has its place, investors focus primarily on an institution’s earnings and the growth therein. This earnings orientation occurs because investors are forward looking, and TBV inherently is a backward-looking measure representing the sum of an institution’s common stock issuances, net income, dividends, and share redemptions since its inception. In addition to being forward-looking, investors also appreciate that earnings ultimately are the source of returns to shareholders. With earnings, the institution can do any of (or a combination of) the following:1
More bluntly, investors like growing earnings and cash returns (dividends or share repurchases), which are difficult to provide without a sustainable base of strong earnings. Investors will tolerate some near-term drag on earnings from expansion or risk mitigation strategies, but their patience is not limitless.
In many industries, earnings before interest, taxes, depreciation, and amortization (EBITDA) or a similar metric is the preferred earnings measure. However, banks derive most of their revenues from interest spreads, and EBITDA is an inappropriate metric. Instead, bank investors focus on net income and earnings per share. When credit quality is distressed, investors may consider earnings metrics calculated before the loan loss provision, such as pre-tax, pre-provision operating income (PPOI).
While earnings-based analyses generally should have valuation primacy in our opinion, TBV multiples nevertheless serves as an important test of reasonableness for a valuation analysis. It would be foolhardy to develop a valuation for a depository institution without calculating the TBV multiple implied by the concluded value. Analysts should be able to reconcile implied TBV multiples to public market or M&A market benchmarks and explain any significant discrepancies.
Occasionally, analysts cite balance sheet-based metrics beyond TBV, some of which have more analytical relevance than others. The most useful is a multiple of “core” deposits, a definition of deposits that excludes larger deposits and deposits obtained from wholesale funding markets. Core deposits are time consuming and costly to gather; thus, a multiple of core deposits aligns a bank’s value with its most attractive funding source. A less useful multiple is value as a percentage of total assets, the use of which would implicitly encourage management to stockpile assets without regard to their incremental profitability.
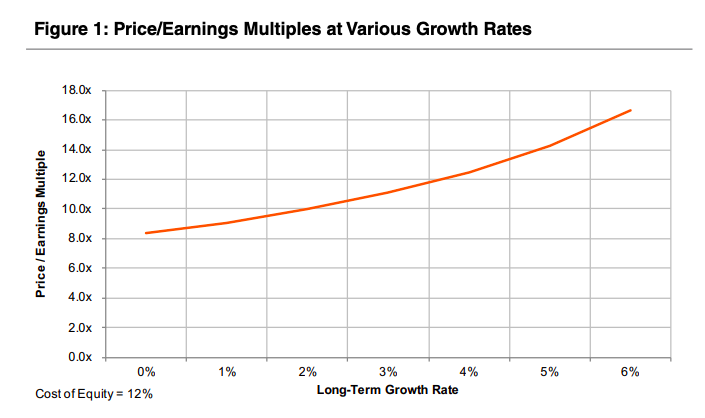
Investors like growth and accelerating growth even more. Without demonstrating the mathematics, higher expected growth rates produce higher valuation multiples. Further, price/earnings multiples expand at an increasing rate as growth rates increase, as indicated in the following chart. The opposite is true, too, as slowing growth reduces the price/earnings.
Banks report innumerable metrics to directors and investors, but what are the most relevant growth indicia to investors? Usually, investors focus on growth in the following:
Valuation is inherently forward-looking, and historical growth rates are useful mostly as potential predictors of future growth. Further, most investors understand that there is some tradeoff between earnings today and investing for higher earnings in the future. While some near-term pressure on earnings from an expansion strategy is acceptable, strategic investments should not continually be used to explain below average profitability. After all, a bank’s competitors likely are reinvesting as well for the future.
How does growth affect value? As a thought experiment, consider a bank with no expected growth in earnings and a 100% dividend payout ratio. Should this bank’s common equity value increase? In this admittedly extreme scenario, the answer is no. This bank’s common equity resembles a preferred stock investment, with a shareholder’s return generated by dividends. That is, for value to grow, one (or preferably more) of the preceding factors must increase.
Should a bank prioritize growth in earnings per share, dividends per share, or another metric? The answer likely depends on the bank’s shareholder base. In public markets, investors tend to be more focused on earnings per share growth. If an investor desires income, he or she can sell shares in the public market. For privately-held banks, though, investors often are keenly aware of dividend payments and emphasize the income potential of the investment. Of course, sustaining higher dividend payments requires earnings growth.
Growth creates a virtuous cycle – retained earnings lead to higher future net income, allowing for future higher dividends or additional reinvestment, and so the cycle continues. One important caveat exists, though. This virtuous cycle presumes that the retained earnings from a given year are invested in new opportunities yielding the same return on equity as the existing operations. If reinvestment occurs in lower ROE opportunities – such as liquid assets supported by excess capital beyond the level needed to operate the bank safely – then growth in value may be diminished.
This discussion of growth segues into the third key valuation factor, risk.
More than most industries, risk management is an overarching responsibility of management and the board of directors and a crucial element to long-term shareholder returns. Banks encounter the following forms of risk:
While growth rates are observable from reported financial metrics, the risk assumed to achieve that growth often is more difficult to discern – at least in the near-term. Risk can accumulate, layer upon layer, for years until a triggering event happens, such as an economic downturn. Risk also is asymmetric in the sense that a strategy creating incremental risk, such as a new lending product, can be implemented quickly, but exiting the problems resulting from that strategy may take years.
From a valuation standpoint, investors seek the highest return for the least risk. Given two banks with identical growth prospects, investors would assign a higher price/earnings multiple to the bank with the lower risk profile. Indicia of risk include:
None of the preceding factors necessarily imply higher risk vis-à-vis other banks; the key is risk management, not risk avoidance. However, if an investor believes risk is rising for any reason, then that expectation can manifest in our three pronged valuation framework as follows:
An old adage is that risk can be quantified and uncertainty cannot. This observation explains why stock prices and pricing multiples can be particularly volatile for banks in periods of economic uncertainty or distress. If investors cannot quantify a bank’s downside exposure, which often is more attributable to general economic anxieties than the quality of the bank’s financial disclosures, then they tend to react by taking a pessimistic stance. As a result, risk premiums can widen dramatically, leading to lower multiples.
This article provides an overview of the three key factors underlying bank stock valuations – financial performance, risk, and growth. While these three factors are universal to valuations, we caution that the examples, guidance, and observations in this article may not apply to every depository institution.
At Mercer Capital, valuations of clients’ securities are more than a mere quantitative exercise. Integrating a bank’s growth prospects and risk characteristics into a valuation analysis requires understanding the bank’s history, business plans, market opportunities, response to emerging technological issues, staff experience, and the like. These important influences on a valuation analysis cannot be gleaned solely from reviewing a bank’s Call Report. Future editions of this series will describe both the quantitative and qualitative considerations we use to arrive at sound, well-reasoned, and well-supported valuations.
1 In theory, a bank could accomplish the preceding without earnings, but eventually that well (i.e., the bank’s TBV) will run dry
Originally published in Bank Watch, June 2019.


