Community Banks: Gradual Improvement Continues in the First Half of 2011
Earlier this year, we presented a review of community banks’ 2010 financial performance, which reflected a mixed bag – some metrics improved, while others deteriorated. With the mid-year filing cycle complete for banks’ Call Reports, we updated this analysis to assess whether the trends noted in 2010 have persisted. In general, we conclude that trends continue to improve, although the pace of improvement appears to be slowing for some metrics.
The analysis relies on a data set comprised of approximately 3,800 commercial banks with assets between $100 million and $5 billion. Additionally, we excluded banks owned by non-U.S. domiciled bank holding companies, subsidiaries of holding companies with more than $5 billion of assets, and banks with unusual levels of non-interest income or consumer lending. As a result, the data set does not have the bias evident in some analyses of aggregate banking industry data, which are weighted in favor of the largest domestic banks.
Income Statement
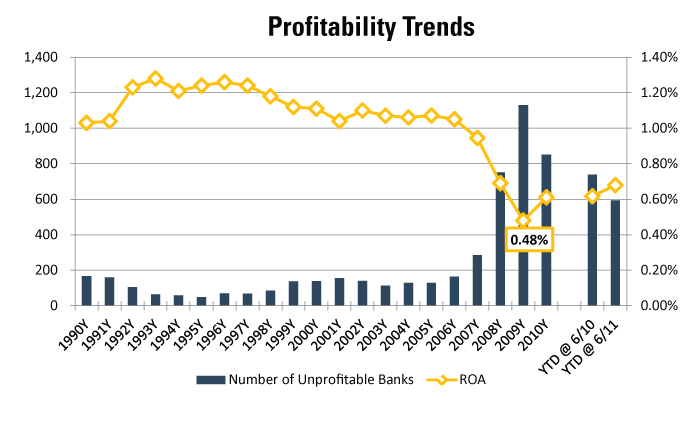
Reflecting community banks’ steady profitability improvement, 597 banks reported a loss in the first half of 2011, down from 739 in the first half of 2010 and 857 in fiscal 2010. However, the gradual nature of the improvement in performance is evident in the industry’s return on assets – the median bank’s return on assets improved from 0.62% in the first half of 2010 only to 0.68% in the first half of 2011, which remains well below the pre-crisis level that exceeded 1.00%. The improvement realized relative to the first half of 2010 is driven largely by lower loan loss provisions.
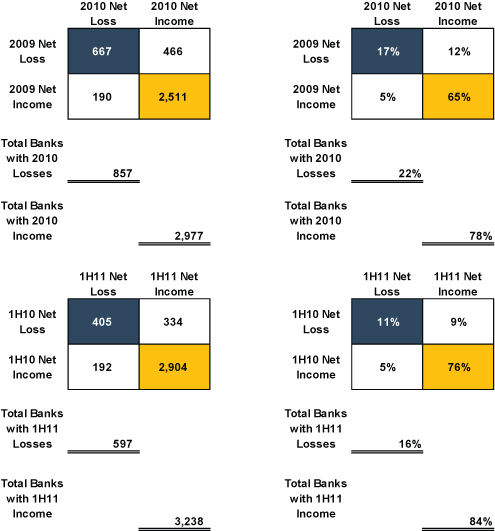
The following matrix groups community banks based on their net income into four categories including (a) positive net income in both the first half of 2010 and the first half of 2011, (b) net losses in both the first half of 2010 and 2011, or © positive net income in one period and a net loss in the other period. As indicated in the matrix, 76% of banks reported positive net income in both periods, while 11% reported net losses in both periods.
Figure Two
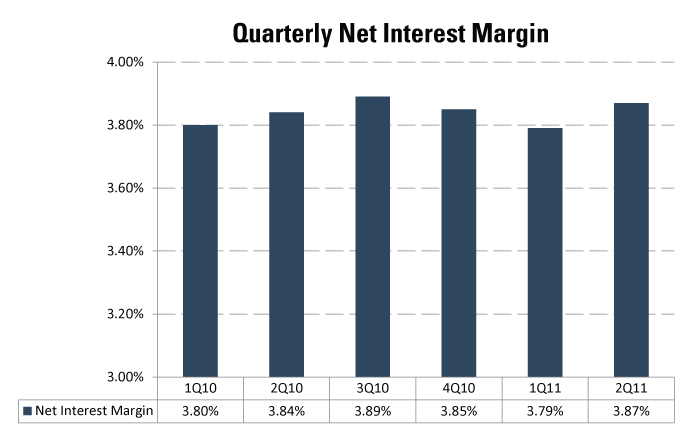
Net interest margin enhancement contributed to many community banks’ improving performance. For example, in fiscal 2010, net interest margin expansion benefited about 60% of the banks in the analysis. However, data from 2011 suggest that the trend of rising net interest margins is weakening. For the first half of 2011, approximately one-half of the banks in the sample reported higher net interest margins than in the first half of 2010.
After declining for the last two quarters, the median net interest margin widened in the second quarter of 2011, suggesting that community banks continue to benefit from deposit rate reductions.
Balance Sheet
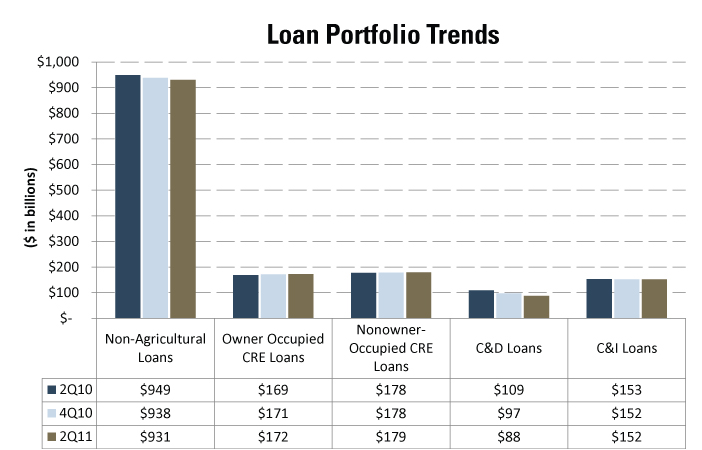
For a majority of the community banks in the analysis, loan growth has not yet resumed. As of June 30, 2011, 62% of community banks reported lower balances of non-agricultural loans, as compared to December 31, 2010 – a trend consistent with the 58% of banks that reported lower loan balances at year-end 2010 than at year-end 2009. The aggregate loans outstanding held by community banks declined by 0.79% between year-end 2010 and June 30, 2011. However, the contraction was not spread evenly throughout loan portfolios. Instead, construction and development loans continue to shrink, offsetting growth in commercial real estate (both owner and non-owner occupied) and commercial and industrial loans.
Figure Four
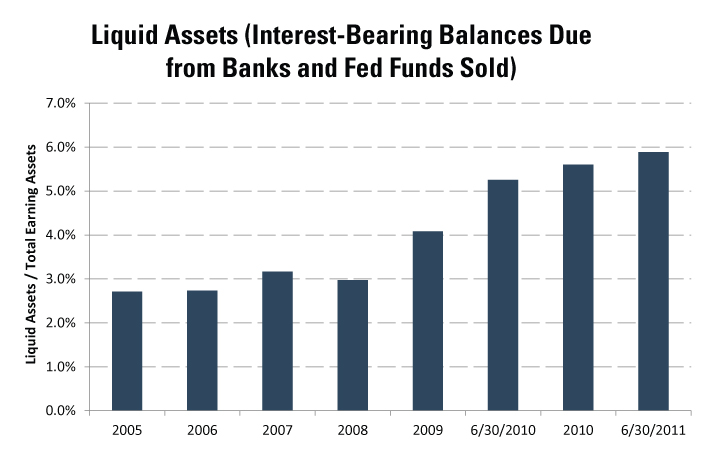
Liquidity continues to accumulate within the community banking industry, albeit at a somewhat slower pace than in recent years, as indicated in the following table showing the median ratio of liquid assets to total earning assets. Offsetting this increase, the median ratio of loans to earning assets declined from 74% at June 30, 2010 and December 31, 2010 to 71% at June 30, 2011.
Asset Quality
One notable trend in fiscal 2010 among community banks was the steady quarterly increase in non-performing assets, despite a gradually recovering economy. After reaching 3.78% in the first quarter of 2011, the median ratio of non-performing assets to loans and other real estate owned decreased by four basis points in the second quarter of 2011, marking the first decline in this ratio since the second quarter of 2006.
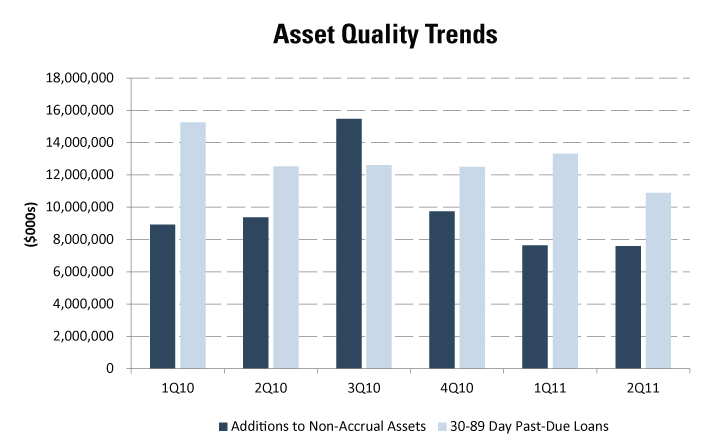
As further evidence of the gradual improvement in asset quality, new additions to non-accrual assets dropped below $8 billion (in aggregate for the 3,800 banks) in both the first and second quarters of 2011 – a level below any quarter in 2010. In addition, loans past-due 30-89 days, representing potential future non-accrual loans, fell to $10.9 billion at June 30, 2011, the lowest level since at least the first quarter of 2010.
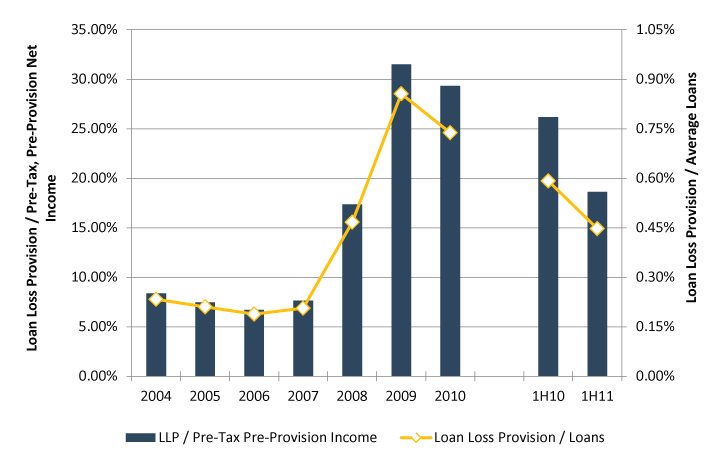
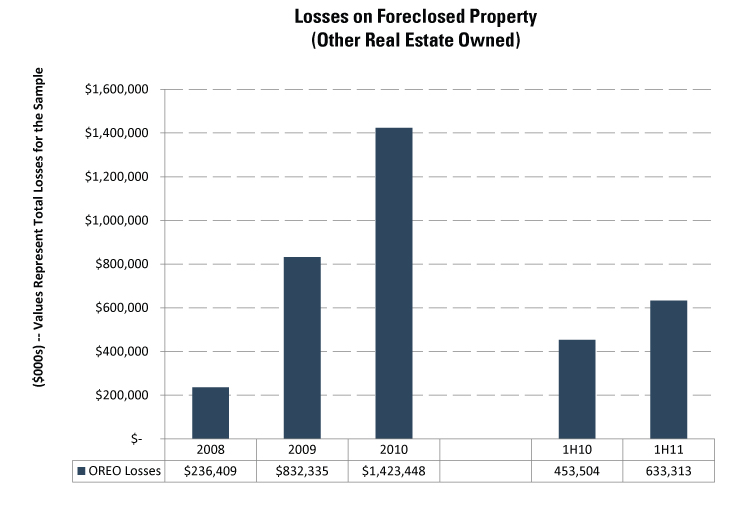
Similar to the trend reported by larger banks in their mid-year earnings releases, community banks continue to see reductions in loan loss provisions. The aggregate loan loss provision reported by the 3,800 banks in the data set declined by 32% in the first half of 2011, versus the same period in 2010. For the median bank, the annualized loan loss provision dropped to 0.45% of loans in the first half of 2011, as compared to 0.59% in the first half of 2010. To some degree, though, credit costs have shifted within the income statement from loan loss provisions to losses and other costs related to other real estate owned. In the first half of 2011, losses on sale of other real estate owned increased by 40% versus the first half of 2010.
For the second half of 2011, trends to monitor include:
- Whether the reduction in the median ratio of non-performing assets/loans and other real estate owned represents the beginning of a trend or a one-time occurrence
- The impact of the stock market declines in early August 2011, the U.S. sovereign debt credit rating downgrade, and the European debt crisis on community banks. While the direct impact may be muted, banks may not escape an indirect effect if macroeconomic conditions deteriorate further
- The levers available to banks to improve earnings, as the boost from lower loan provisions begins to wane. Also in this vein, the second half of 2011 will allow the first opportunity to assess the impact, if any, of the Durbin amendment on community banks
Originally published in Mercer Capital’s Bank Watch, released August 15, 2011.
