In 2016, Mercer Capital published an article on core deposit trends through November 1 just before the presidential election. At that time, core deposit intangible (CDI) values remained near historical lows. Following the financial crisis, CDI values decreased as deposits have less worth, so to speak, in a very low rate environment than in a “normal” environment as existed before the crisis.
Despite a rate increase by the FOMC in December 2015, the costs of alternative funds such as FHLB advances had not materially increased and were not expected to increase more than the gradual pace the Fed had targeted for short-term interest rates since late 2015. The persistent low rate environment limited both deposit premiums paid in acquisitions and CDI values booked.
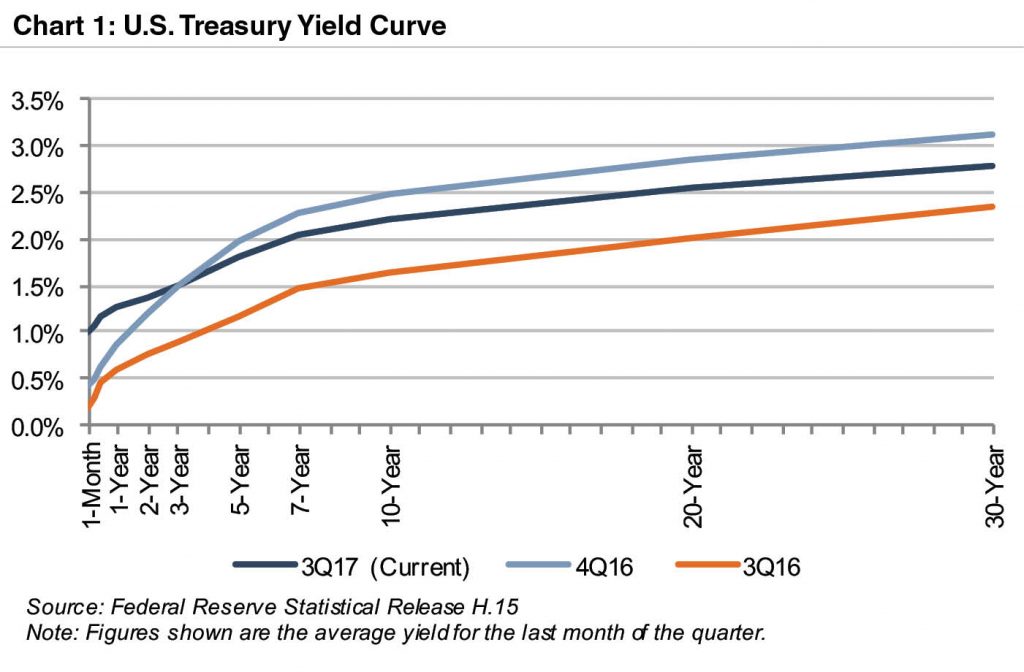
A week later, the presidential election defied market expectations and drove bond yields higher almost immediately on expectations of stronger economic growth and rising inflation. Three more rate increases by the FOMC followed in December 2016, March 2017, and June 2017. Since the post-election run-up, the yield curve has flattened, but overall yields remain well above pre-election levels (Chart 1).
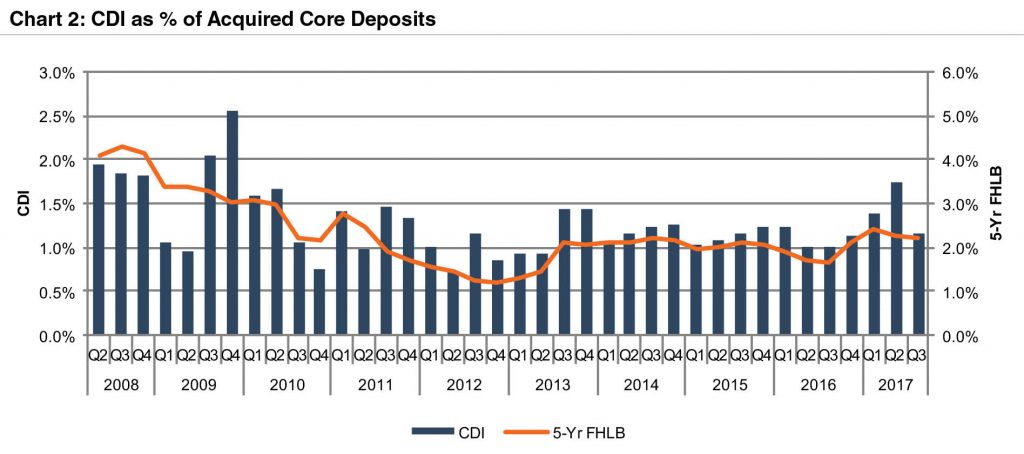
Using data compiled by S&P Global Market Intelligence, we analyzed trends in CDI assets recorded in whole bank acquisitions completed from 2008 through the third quarter of 2017, and we compared CDIs recorded as a percentage of core deposits acquired to 5-year FHLB rates over the same period. CDI values generally have followed interest rate trends. Prior to the start of the financial crisis, CDIs recorded in acquisitions averaged 1.5%–2.0%, but post-crisis CDIs stabilized at approximately 1.0%–1.25% in the 2014 to 2016 period. Since the November 2016 election, CDI values have risen through mid-2017 as yields rose, before declining in the third quarter as the yield curve flattened. CDIs represent the benefit of having a low-cost, stable funding source, and in times when alternative sources of funds have higher rates, core deposits have greater “worth” to an acquirer (see Chart 2).
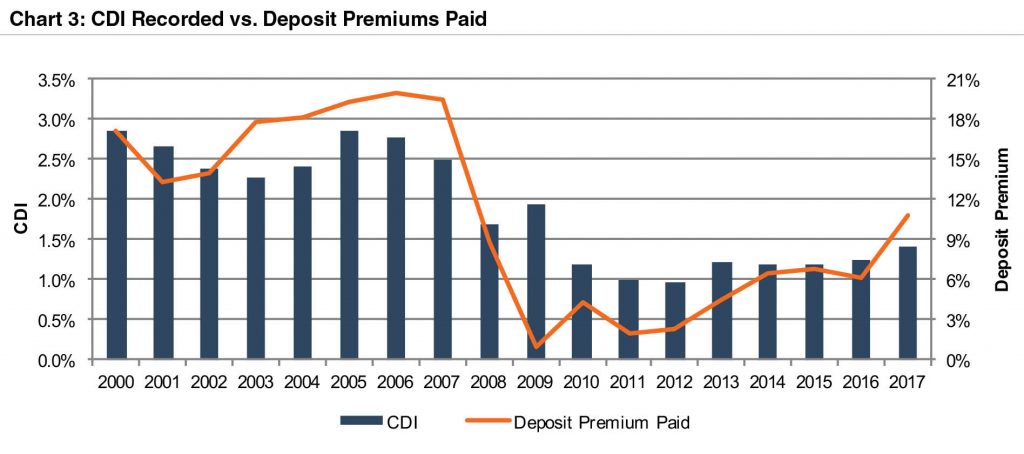
Although CDI values have increased since the post-crisis lows, CDI values remain well below long-term historical average levels. CDI values have averaged approximately 1.5% in 2017, compared to averages in the 2.5%–3.0% range in the early 2000s. Even as CDI values remained largely stagnant through 2016, deposit premiums paid in whole bank acquisitions have shown more volatility, driven by improved deal values that have pushed deposit premiums up at a quicker pace from their 2009 lows, a trend that has continued through 2017.1 The flattening yield curve that pushed CDI values lower in the third quarter of 2017 did not have the same effect on deposit premiums, but for deals closed in the third quarter deposit premiums largely reflected transaction values determined earlier in the year when the yield curve was steeper, and this lagged effect could push deposit premiums back down in upcoming quarters. Regardless of the near-term outlook, current deposit premiums in the range of 10% remain well below pre-financial crisis levels when premiums for whole bank acquisitions averaged closer to 20%.
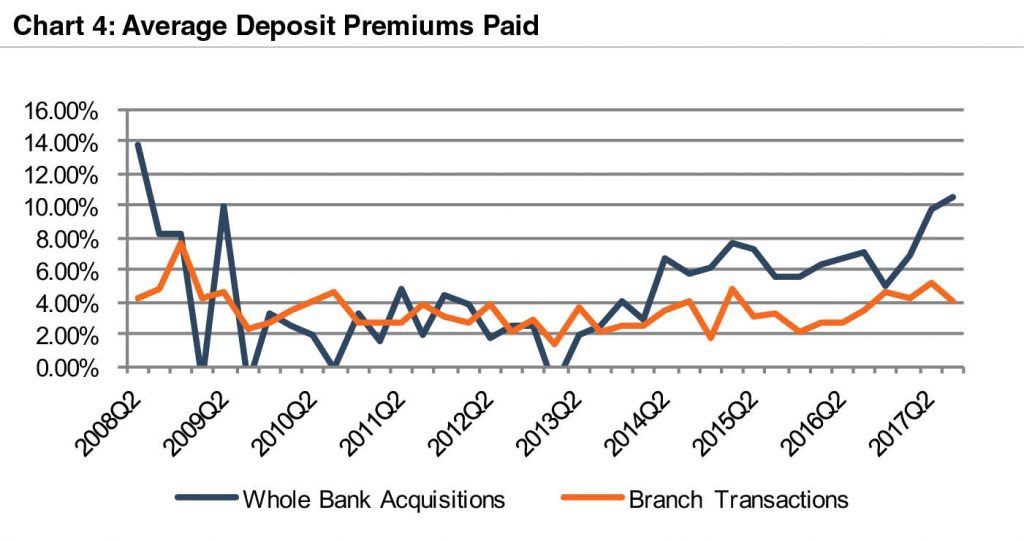
Deposit premiums paid in branch transactions, defined as the value paid in excess of deposits acquired, have generally been less volatile than tangible book value premiums paid in whole bank acquisitions. Branch transaction deposit premiums are up some from the lows observed in the financial crisis but have remained in the 4%–5% range for the last 12 months.
For our analysis of industry trends in CDI values, we defined core deposits as total deposits, less accounts with balances over $100,000. In analyzing core deposit intangible assets for individual acquisitions, however, a more detailed analysis of the deposit base would consider the relative stability of various account types. In general, CDs tend to be more rate sensitive and less stable. Even in cases where a CD base is considered a stable customer base, given their relatively higher cost compared to non-time deposits, CDs often do not contribute to the core deposit intangible asset recorded. Furthermore, account types such as brokered or Qwickrate accounts and certain public funds that may be subject to a competitive bidding process are generally excluded from core deposits when determining the value of a CDI.
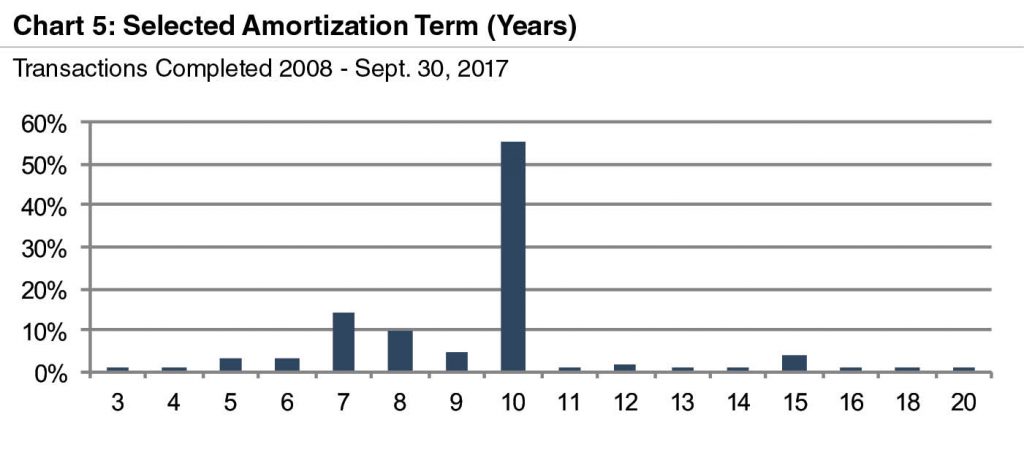
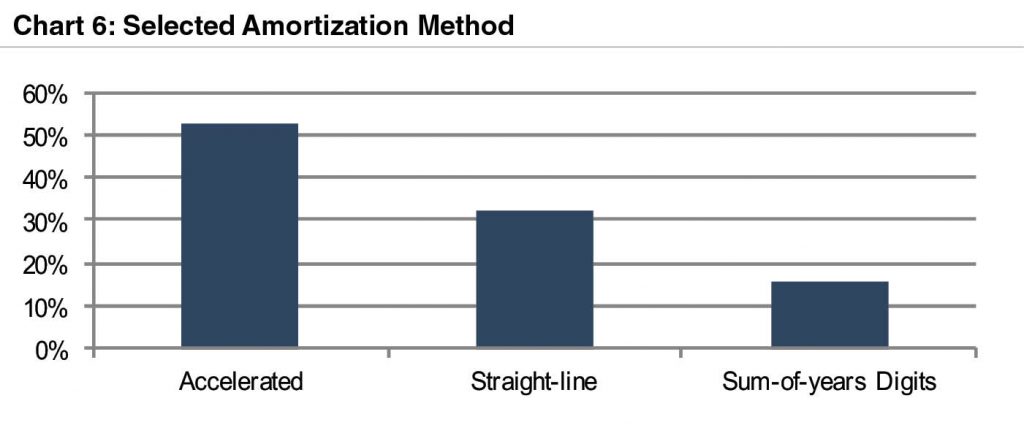
Based on the data for acquisitions for which core deposit intangible detail was reported, a majority of banks selected a ten-year amortization term for the CDI values booked. Less than 10% of transactions for which data was available selected amortization terms longer than ten years. Amortization methods were somewhat more varied, but the accelerated amortization method was selected in approximately half of these transactions.
 For more information about Mercer Capital’s core deposit services, please contact us.


