Morningstar recently reported, given volatility in the equity markets, that U.S. equity funds and ETFs took in a relatively modest $5.7 billion in March 2025, of which $5.6 billion flowed into dividend growth funds. This investor preference for dividends caused us to reevaluate the role of dividends in bank shareholder returns.
An investor’s total return is a function of three variables:
To simplify this analysis, we do not consider taxes.
In a period marked by moderate share price appreciation, dividends become a crucial component of shareholders’ total returns. As indicated in Table 1 below, the group of publicly traded banks generated a median total return of 114% over the 2014 to 2024 period, or a 7.9% annualized return. For the median bank, stock price appreciation was 59%, implying that the remainder of the median bank’s 114% total return came from dividends and the return on reinvested dividends.
Returns were rather pedestrian for several reasons.
In a period marked by moderate share price appreciation, dividends become a crucial component of shareholders’ total returns. As indicated in Table 1 below, the group of publicly traded banks generated a median total return of 114% over the 2014 to 2024 period, or a 7.9% annualized return. For the median bank, stock price appreciation accounted for 59% of investors’ total return, implying that the remainder came from dividends and the return on reinvested dividends.
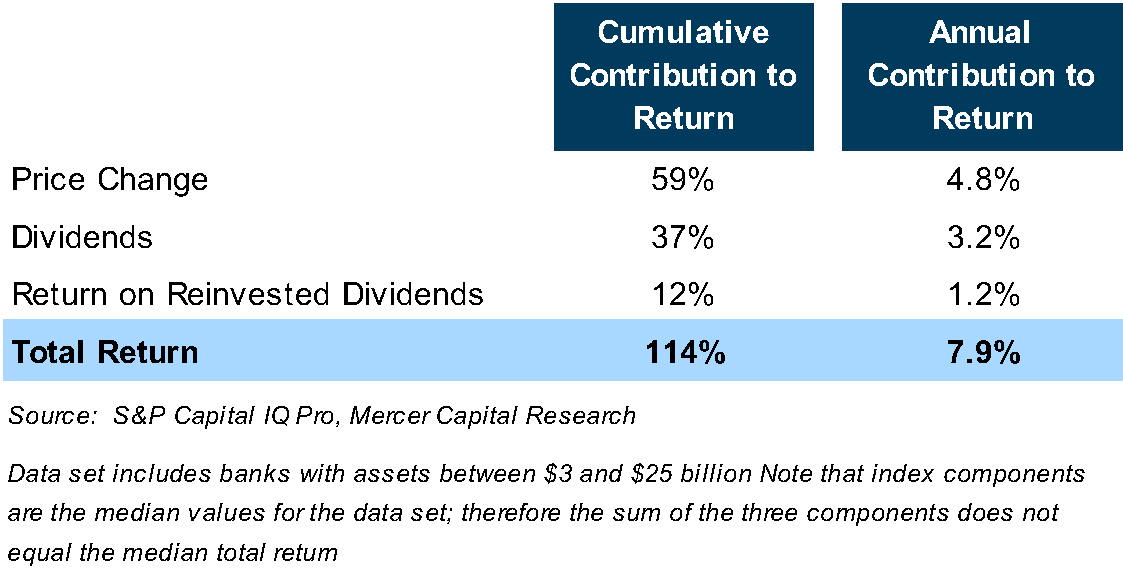
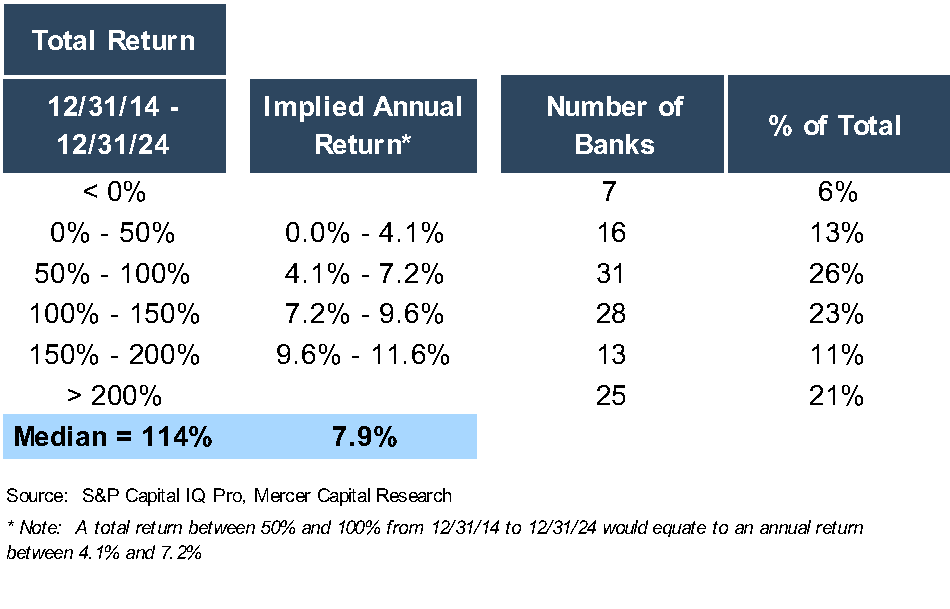
Table 2 stratifies the 120 banks included in the analysis by their total return. Almost one-half of the banks reported a total return between 50% and 150% over the 2014 to 2024 period, which equates to a mid to high single-digit annual return.
Does the impact of dividends on shareholder returns mean that bank management teams should immediately increase dividend payouts? Not necessarily, as markets reward growth in per share earnings and book value. Table 3 suggests that shareholder returns are negatively correlated with dividend payouts; that is, banks with the highest dividend payouts report the lowest shareholder returns. It is difficult to draw firm conclusions, though, as few banks in the analysis pay dividends of 0% or greater than 50%.
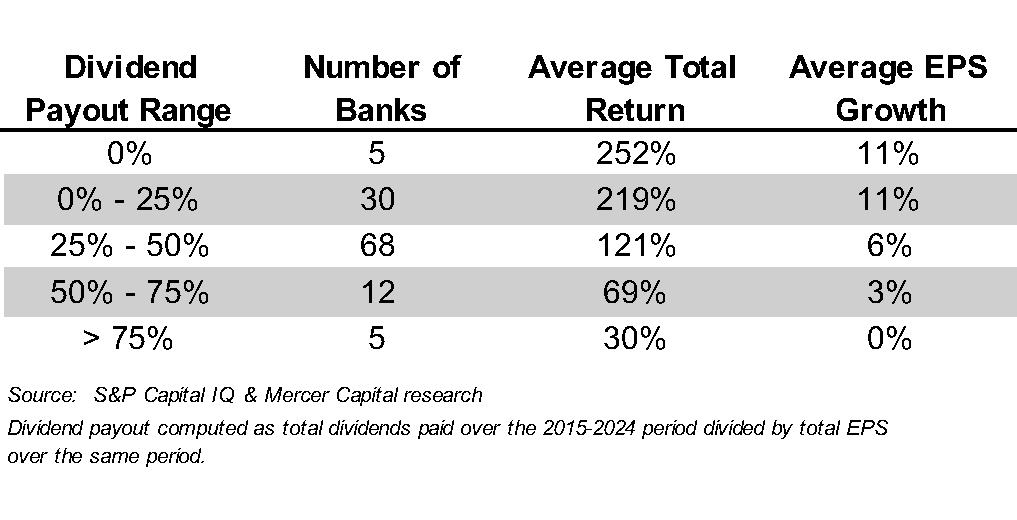
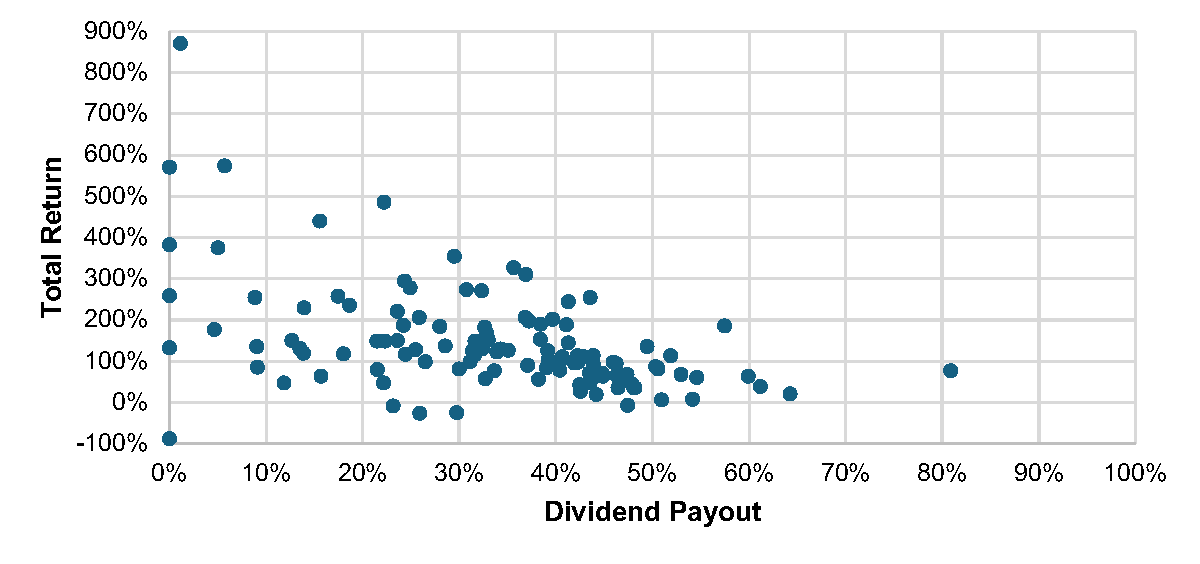
Figure 1 below compares dividend payout ratios and shareholder returns. The scatter plot suggests another factor influencing shareholder return: risk. Banks with low dividend payouts report widely dispersed returns, but returns tend to be more clustered for banks with dividend payouts in the 30% to 50% range. Dividend payout ratios are one way to estimate the potential volatility—and therefore the risk—of an investment, and investors want higher returns for assuming more risk.
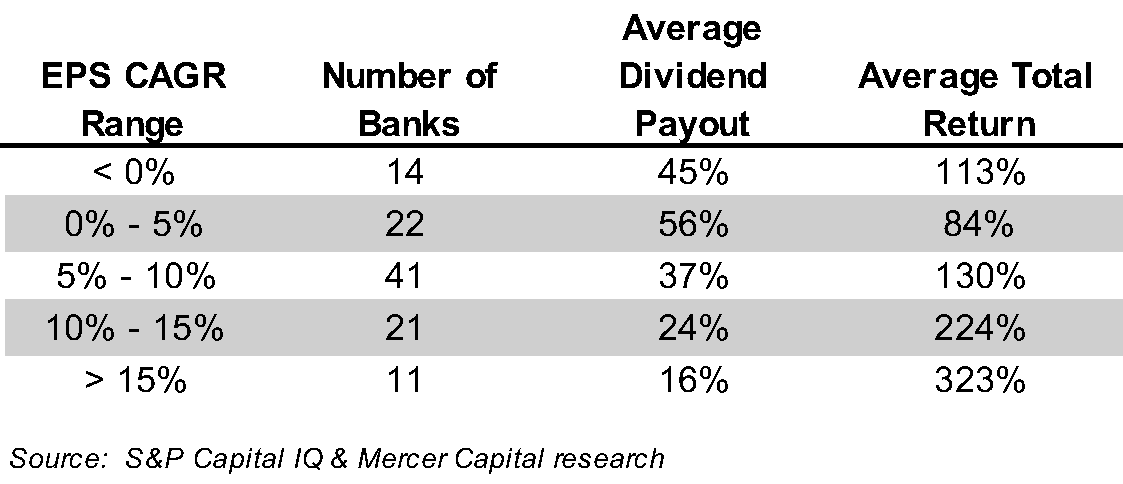
The relationship between shareholder returns and dividend payouts makes sense, as banks with high payouts often have fewer organic growth opportunities and, therefore lower EPS growth. Table 4 stratifies the data set by compound annual growth in EPS over the 2014 to 2024 period, whereby banks with the lowest EPS growth have the highest dividend payout ratios (and lower shareholder returns).
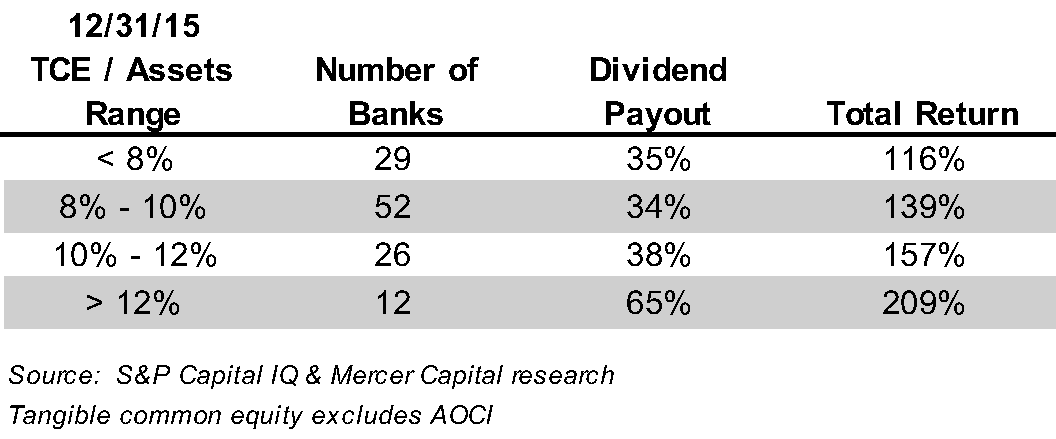
We also evaluated the relationship between the tangible common equity/assets ratio and dividend payouts. One may expect that banks with lower TCE/asset ratios have lower dividend payout ratios, but the data does not support this expectation. We note, though, that banks with excess capital, defined as TCE/asset ratios over 12%, tend to maintain higher dividend payout ratios. These banks can offer a relatively high payout, as well as maintain dry powder for opportunistic initiatives.
The analysis shows that dividends, while an important component of shareholder returns, do not necessarily drive shareholder returns. Our analysis includes 120 banks, and 60 have dividend payout ratios between 30% and 50%. With dividend payout ratios clustered in a relatively tight range, it is difficult to make fine distinctions about dividend policies and shareholder returns. The implication is not that a bank with low EPS growth likely will enhance its shareholder returns by reducing its dividend payout ratio.
Over a long period, we know that shareholder value is created by growing earnings per share, which leads to rising tangible book value per share. Earnings also enable the dividend policy. Most banks have recognized, though, that they can both invest in growth opportunities and provide immediate return to shareholders through dividends. In challenging market environments, as occurred over the last ten years, this capital management strategy provides a material source of shareholder return.
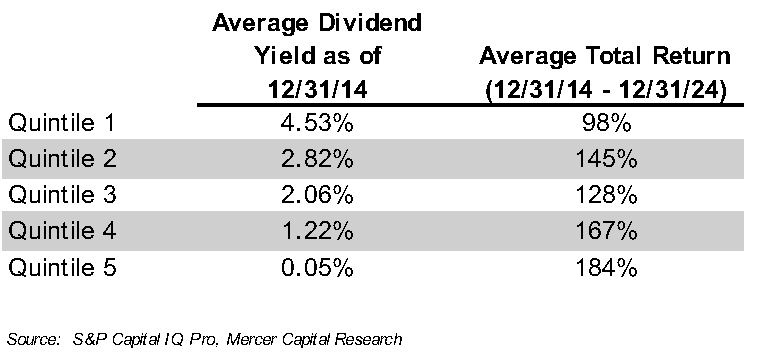
While BankWatch does not make investment recommendations, we noted a recent article in the Wall Street Journal regarding dividend investing. It proposed, with some historical support, sorting the S&P 500 into quintiles by dividend yield. The research suggests that the quintile with the highest dividend yield underperforms, as high yields often result from financial distress and suggest the risk of future dividend cuts. Rather, investors should invest in the quintile with the second highest dividend yield, which has been shown to outperform the S&P 500.
We replicated this investment strategy for our bank universe. We did find that banks with the highest dividend yields at year-end 2014 underperformed over the next ten years. However, we found no evidence that the second quintile outperformed
(Table 6).