The August Bank Watch looks at unrealized losses in bank bond portfolios based upon Call Report data as of June 30, 2022.
Fed Chair Powell gave a short 8-minute speech on August 26 at the annual Jackson Hole, Wyoming economic summit that is hosted by the Federal Reserve Bank of Kansas City. The gist of Powell’s speech is that the Fed is solely focused on reducing inflation. Powell’s speech in 2021 discussed “transitory” inflation and the timing of when the Fed might begin to reduce its monthly purchase of $120 billion of U.S. Treasuries (“UST”) and Agency MBS. At the time consumer prices were then advancing around 5% vs 9% now.
Last year, equity markets liked what it heard from Powell at Jackson Hole regarding the liquidity spigot; not so this year as the S&P 500 declined 3.4% and the NASDAQ declined 3.9% the day Powell spoke. The NASDAQ Bank Index declined 2.4% and is down 12.8% year-to-date through August 26.
Interestingly, UST yields did not move much even though Powell said it would not be appropriate to stop hiking at a “neutral” rate. As such, bank bond portfolios did not incur additional losses. In fact, the peak loss for most bank bond portfolios was in mid-June when the yield on the 10-year UST rose to 3.49% compared to 2.98% on June 30 and 3.04% on August 26.
Based upon our review of bank second quarter earnings calls and analysts’ write-ups, investors seem to be taking the losses in stride given solid growth in spread revenues as NIM expansion has been dramatic. Last spring that was not the case when the ~150bps increase in intermediate- and long-term rates produced significant losses in bond portfolios given little coupon to cushion the higher term structure.
As shown in Figure 1, the Fed has hiked the Funds target rate much faster and by a greater magnitude than it did in 1994 when the Fed waylaid the bond market with 300bps of hikes. Bond portfolios were hammered as the hikes and an upturn in inflation drove longer-term rates higher by ~275bps. The curve became flatter but never inverted as investors assumed a recession would not develop.1
Figure 1: 1994 Bond Bear Market vs 2022 Bond Bear Market
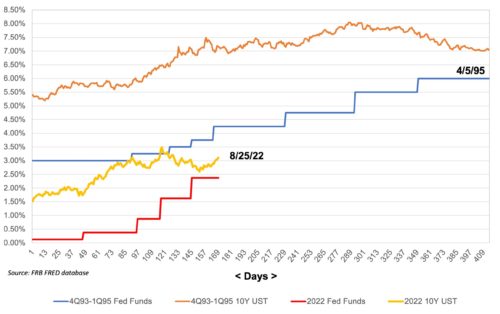
Powell’s comments last week imply short-term policy rates may go as high as 4% by next Spring based upon futures markets. Given little movement in UST yields, bond investors are pricing in slowing economic activity and possibly lower yields to come. If so, the inverted UST curve prospectively will become more inverted if the Powell Fed can stomach the seemingly probable fallout as it pushes short rates higher.
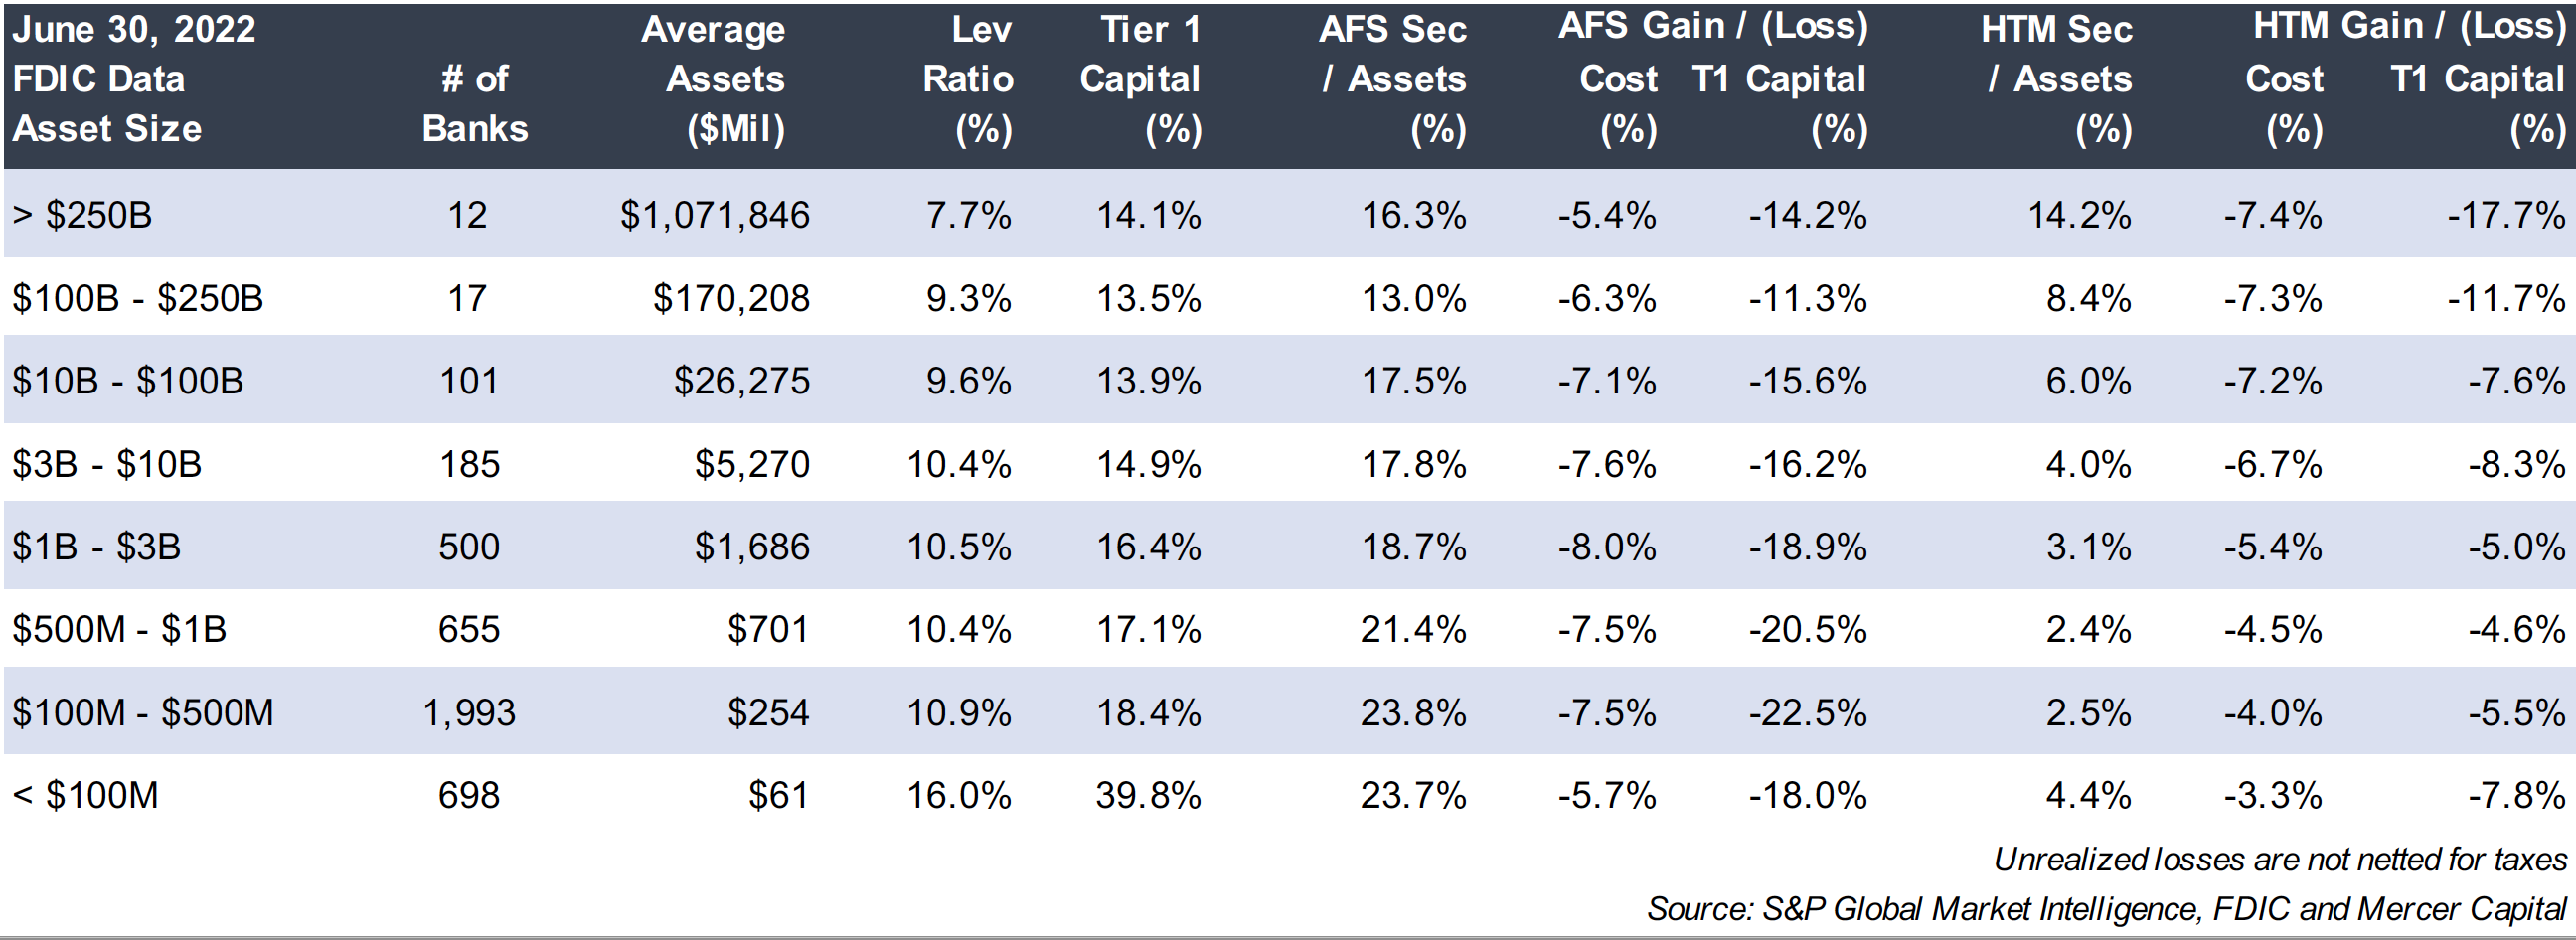
Figure 2: Unrealized Bond Portfolio Losses vs Cost Basis and Tier 1 Capital
Click here to enlarge the image above
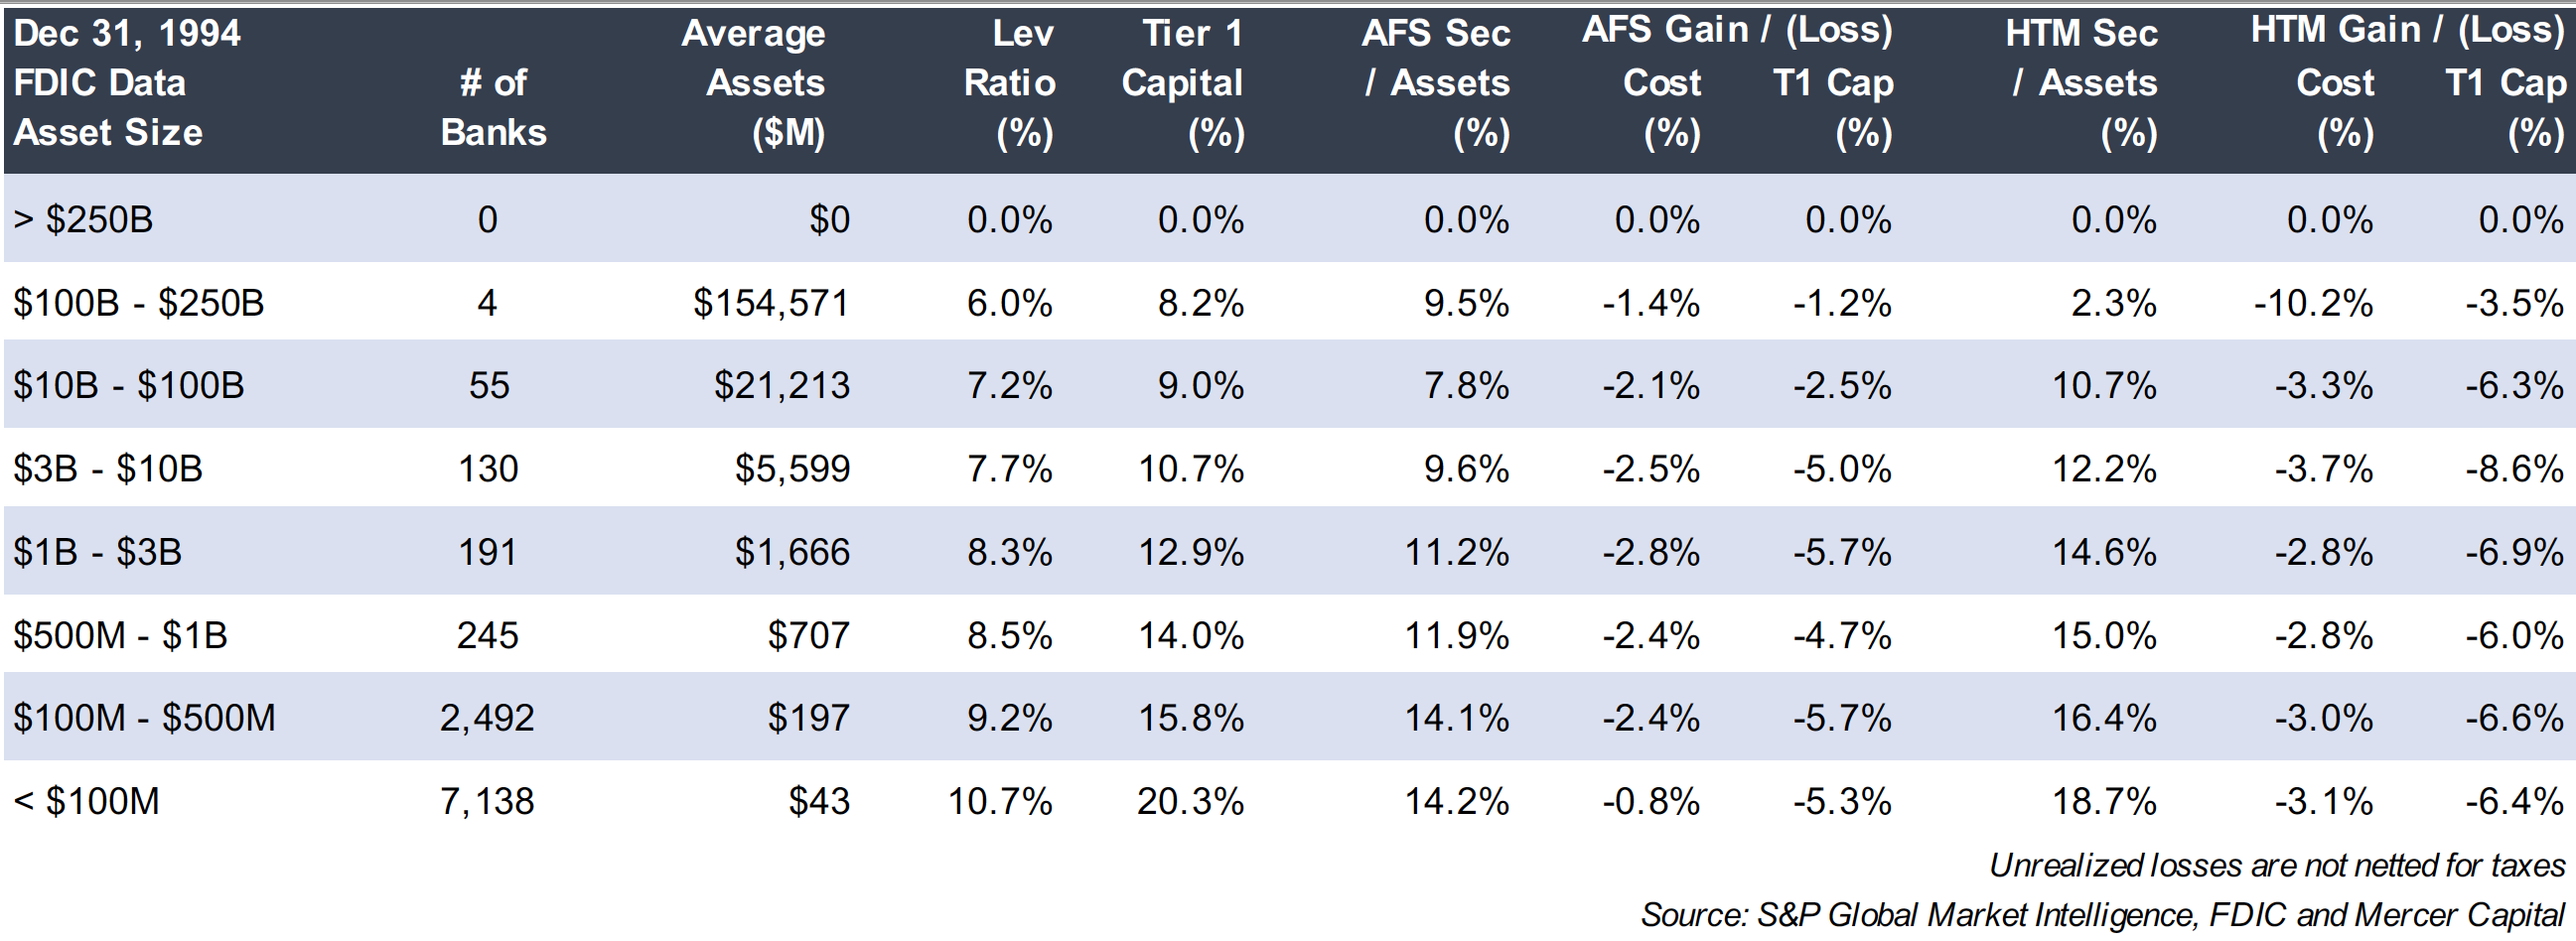
Figure 3: Unrealized Bond Portfolio Losses vs Cost Basis and Tier 1 Capital
 Click here to enlarge the image above
As shown in Figure 2, unrealized losses as of June 30 were significant though losses and gains are excluded from regulatory capital for all but the largest banks.
Unrealized losses in available-for-sale (“AFS”) designated portfolios ranged from an average of 5.7% of cost for banks with less than $100 million of assets to 8.0% for banks with $1 billion to $3 billion of assets. As a percent of tier one capital the range was from 11.3% for banks with $100 billion to $250 billion of assets to 22.5% for banks with $100 million to $500 million of assets.
Figure 3 provides the same data as of year-end 1994 when the ten-year UST was near a cyclical peak of ~8%. The bear market of 2022 is far worse than the 1994 bear market. Unlike 1994, portfolios today have little coupon to cushion the impact of rising rates. Also, duration may be longer today.
The “coupon issue” today is reflected in low portfolio yields. As an example, the average taxable equivalent portfolio yield for banks with $1 billion to $3 billion of assets was only 1.96% in 2Q22 compared to 1.80% in 4Q21 immediately before the Fed began to hike. By way of comparison, the yield on one-month T-bills as of August 26 was 2.21% and 30-day LIBOR was 2.49%. Cash yields more than bond portfolios and prospectively will yield much more if the Fed pushes the Funds target to 4% by next spring.
The good news is that portfolio cash flow should be reinvested at much higher yields to the extent it is not used to fund loan growth or deposit run-off. The same applies to fixed rate loans, which are not marked-to-market but may have comparable losses given both higher rates and wider credit spreads.
The exceptionally good news is that non-interest-bearing (“NIB”) deposits, which are the core of core deposits, are driving NIM expansion and growth in spread revenues. Rate hikes this year are inflating the value of NIB deposits. There is no mark-to-market report for a board to see this; rather, the value is in the income statement.
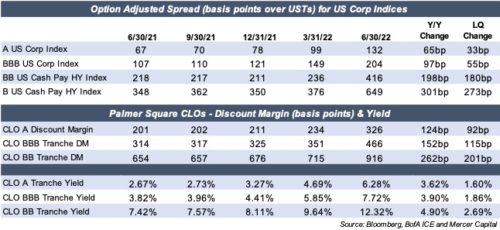
The unknowable question is if the Fed can push short-term rates higher without producing a sharp downturn or serious credit event that forces the Fed to blink again. The downturn in bank stocks this year primarily reflects investor expectations about the potential impact a recession would have on credit costs next year; it is not about unrealized losses in bond portfolios.
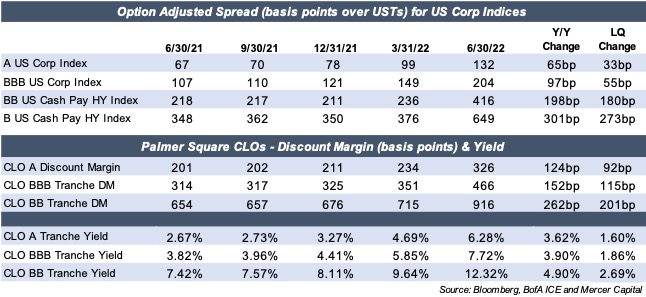
Figure 4: Credit Spreads Widen
Click here to enlarge the image above
About Mercer Capital
Mercer Capital is a national valuation and transaction advisory firm that has advised banks for 40 years through bear and bull markets. Please call if we can be of assistance.
1 The Fed rate hiking campaigns of 2004-2006 (425bps of cumulative hikes to 5.25%) and 2015-2018 (225bps to 2.50%) did not produce as great of losses as the current cycle and 1994. The curve was exceptionally steep in 2004 such that long-term UST rates rose less than 100 bps (Greenspan called it a “conundrum”) while it took a couple of years for long-term yields to peak in 2018 around 3% vs the “all-at-once” episode this year.