
One of BankWatch’s favorite artists is the Dutch painter Hieronymus Bosch (1450-1516). His work is both enigmatic and fantastical, with bizarre human/animal hybrid forms and other monstrous creations of Bosch’s fecund imagination. Indicating its lasting relevance and, in a sense, modernity, centuries later Bosch’s work served as inspiration when the Surrealist movement sought to depict dreamlike scenes formed from the depths of their unconscious mind. One triptych, The Garden of Earthly Delights, depicts a utopian scene in the middle panel adjacent to a hellscape in the right panel. It serves as an apt metaphor for the banking industry’s stomach churning volatility in 2023.
As in the hellscape panel on the right side of the triptych, the banking industry sunk to the depths of despair beginning in March 2023, tormented by bank failures and deposit runs. From year-end 2022 to the nadir in May 2023, the Nasdaq Bank Index sunk 34%. Bank stocks rebounded during the summer but remained under pressure through the fall as the ten year Treasury rate briefly exceeded 5%.
Finally, more dovish comments from Chairman Powell lifted sentiments, causing the Nasdaq Bank index to appreciate by 12% in November 2023 and 15% in December 2023. While we have not returned to a banking utopia, the greener pastures in which Bosch’s hybrid forms graze in the triptych’s middle panel seem more representative of industry conditions at year-end 2023.
For 2023, the Nasdaq Bank Index and the KBW Nasdaq Regional Bank Index depreciated by 7% and 4%, respectively (see Figure 1 ). This marks the second year of negative performance for bank stock indices. Between year-end 2021 and 2023—covering the entire period of rising rates—the Nasdaq Bank and Regional Bank indices decreased by 24% and 13%, respectively (see Figure 2).
After losing 19% in 2022, the S&P recovered in 2023 with 24% appreciation, meaning that the S&P 500 at year-end 2023 returned to a level virtually identical to year-end 2021. Struggling with earnings pressure, banks lost favor with growth minded investors, thereby underperforming the broader market.
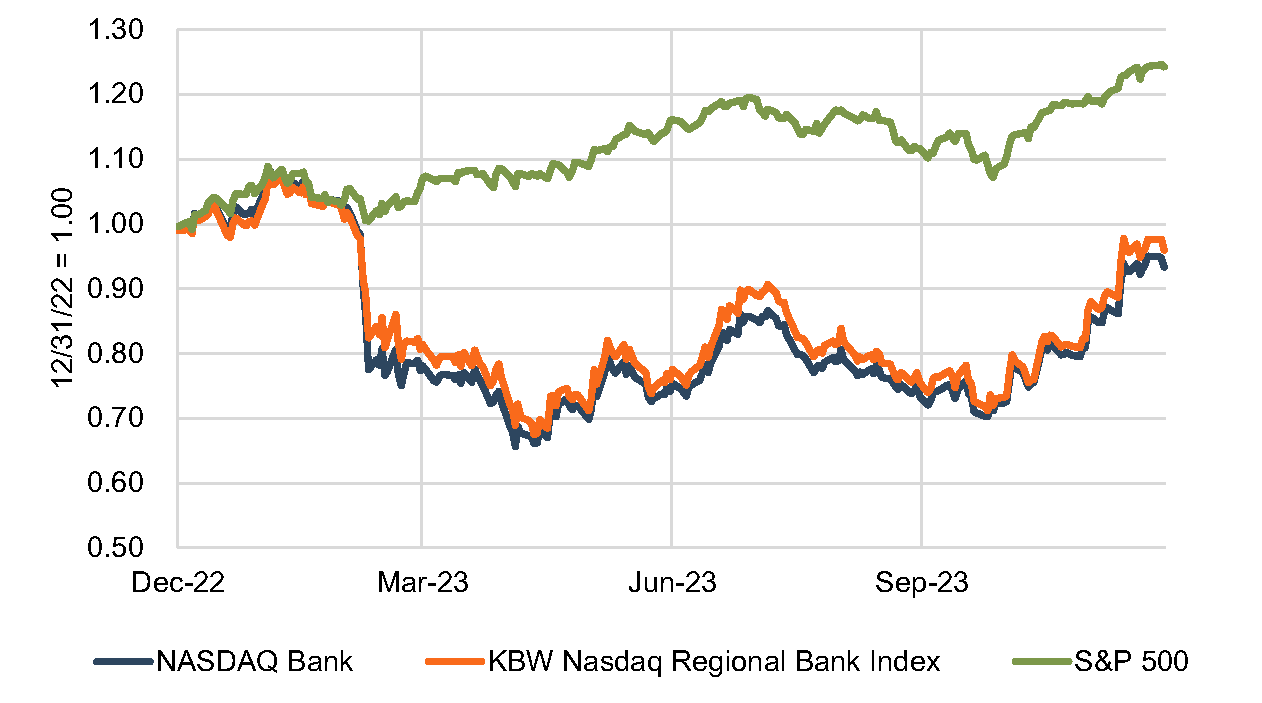
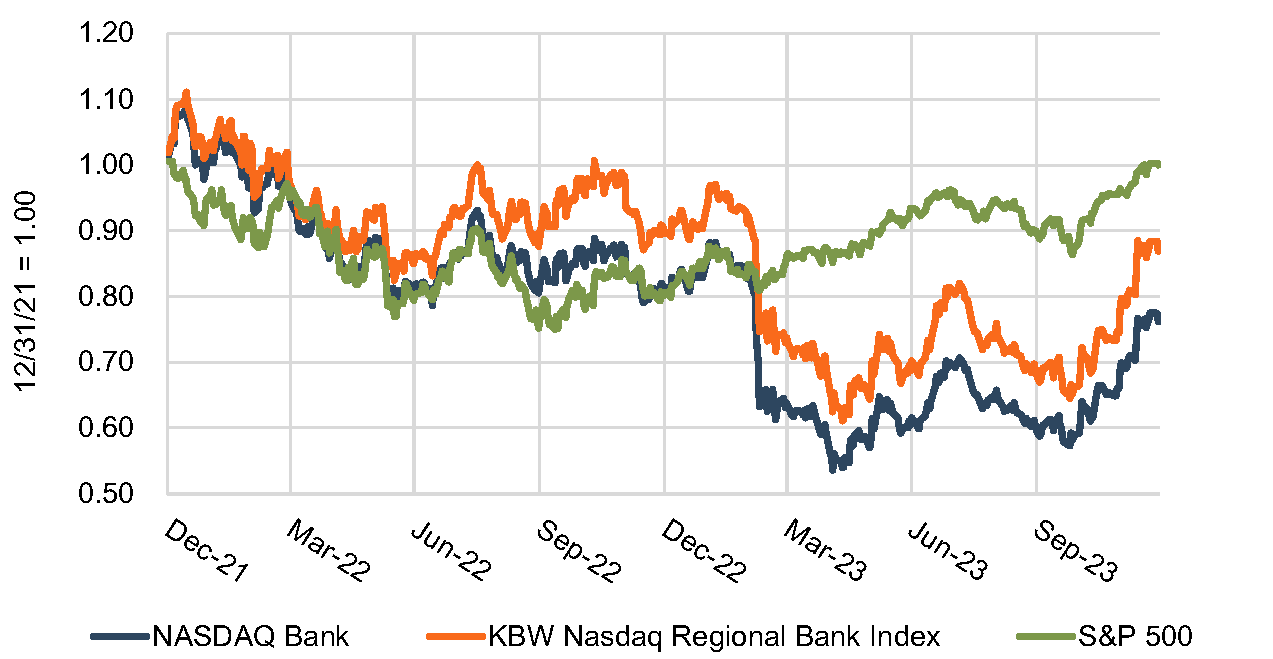
Figure 3 stratifies the 328 banks and thrifts traded on the NYSE and Nasdaq by asset size. Banks in the three strata between $1 billion and $100 billion performed similarly, with the median bank’s stock price falling by about 5% in 2023. Between 30% to 40% of banks reported share price appreciation over year-end 2022. The largest banks outperformed in 2023, as several banks like J.P. Morgan Chase (NYSE: JPM) “over-earned” their long-term return on equity target. JPM and other money center banks were boosted by low-cost deposits flowing from smaller banks in the wake of the failures of SVB, Signature Bank, and First Republic Bank. JPM also recorded a bargain purchase gain from the acquisition of First Republic Bank as did First Citizens BancShares (NYSE: FCNCA) and New York Community (NYSE: NYCB), the winning bidders for SVB and Signature Bank.
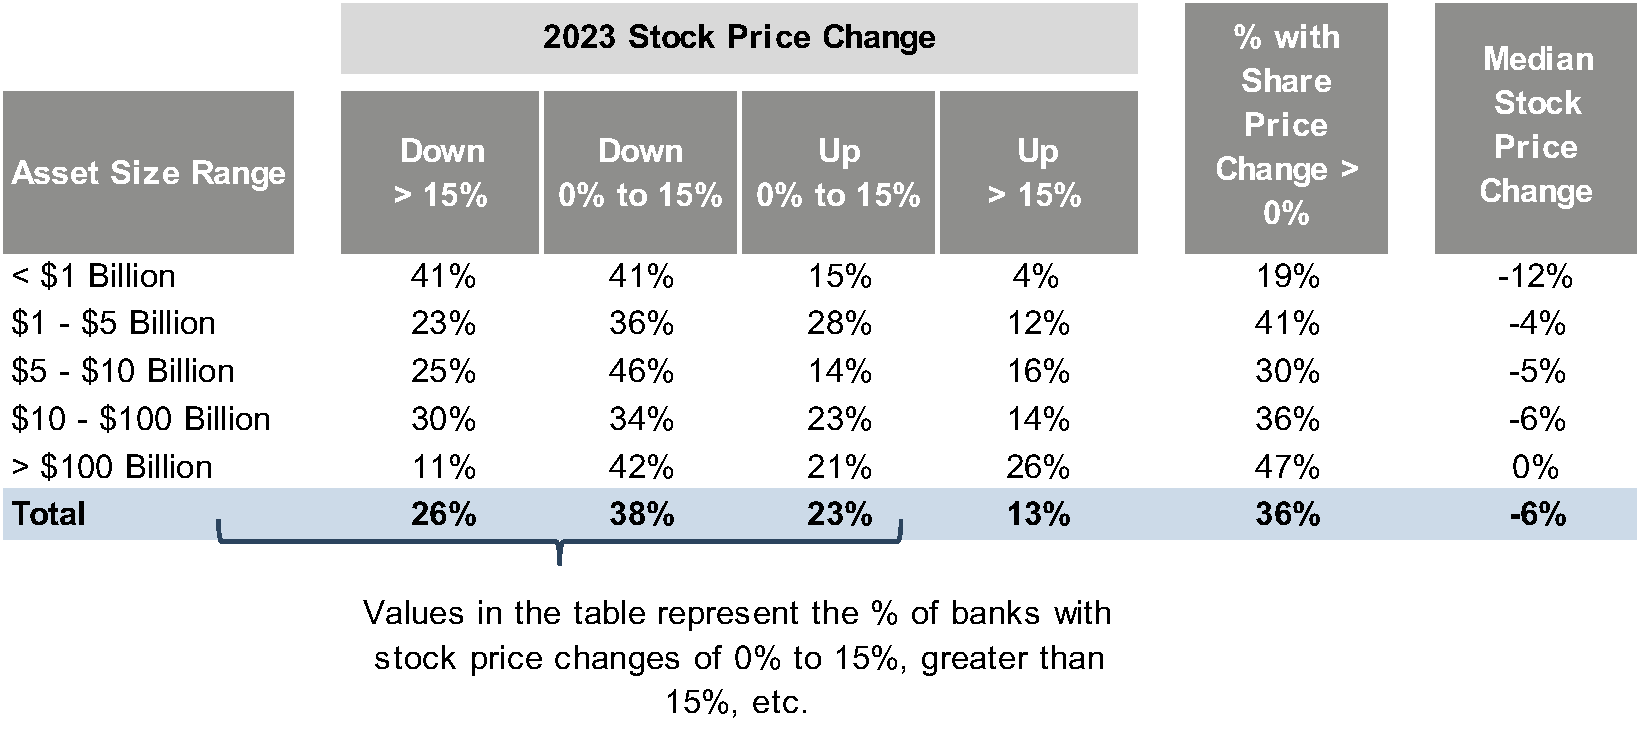
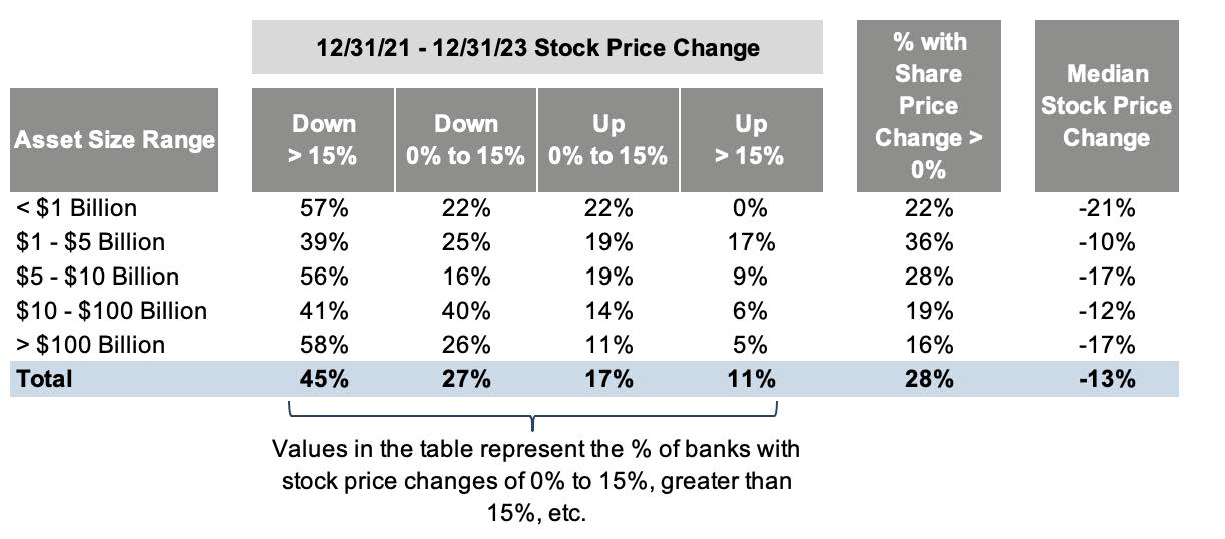
Figure 4 replicates the analysis for the period between year-end 2021 and year-end 2023. Not all banks have struggled through this rising rate environment, as 28% of banks reported share price appreciation over the two year period. Nevertheless, the largest number of banks have experienced a 10% to 20% decline in their share prices.
Changes in the net interest margin have the greatest effect on profitability and share price performance in the current environment, given limited credit issues. Figure 5 includes publicly traded banks with assets between $1 billion and $10 billion, sorted into quartiles based on their NIM change between the fourth quarter of 2022 and the third quarter of 2023.
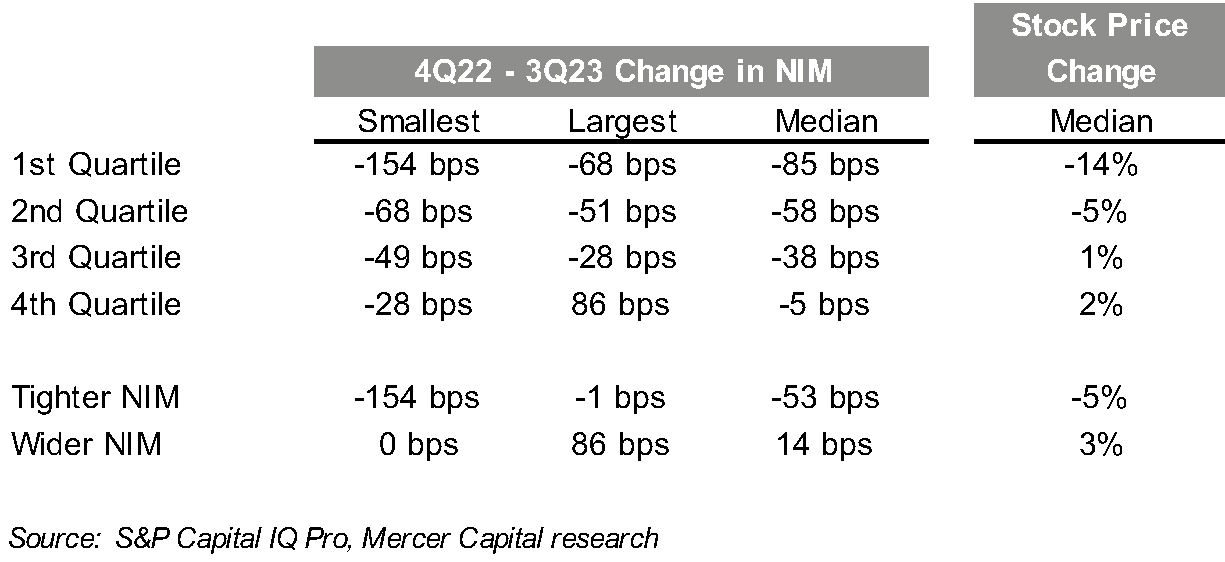
The first quartile, including banks with the most severe NIM pressure, experienced a median stock price change of negative 14% in 2023. Meanwhile, banks in the fourth quartile—with the least NIM pressure or even NIM expansion—eked out a positive 2% change in stock price.
This relationship holds true if we consider the entire rising rate period between the first quarter of 2022 and the third quarter of 2023 (see Figure 6). Over this period, approximately one-half of the banks reported a higher NIM; however, the market provided a meager reward with share prices for banks in the fourth quartile appreciating by a median of 4%. This reflects the market’s focus on the more recent trend in the margin—generally downward for most banks—rather than a historical anchor in a low rate environment. Meanwhile, the banks in the first quartile that were most exposed to rising rates suffered a median -24% change in their stock prices.
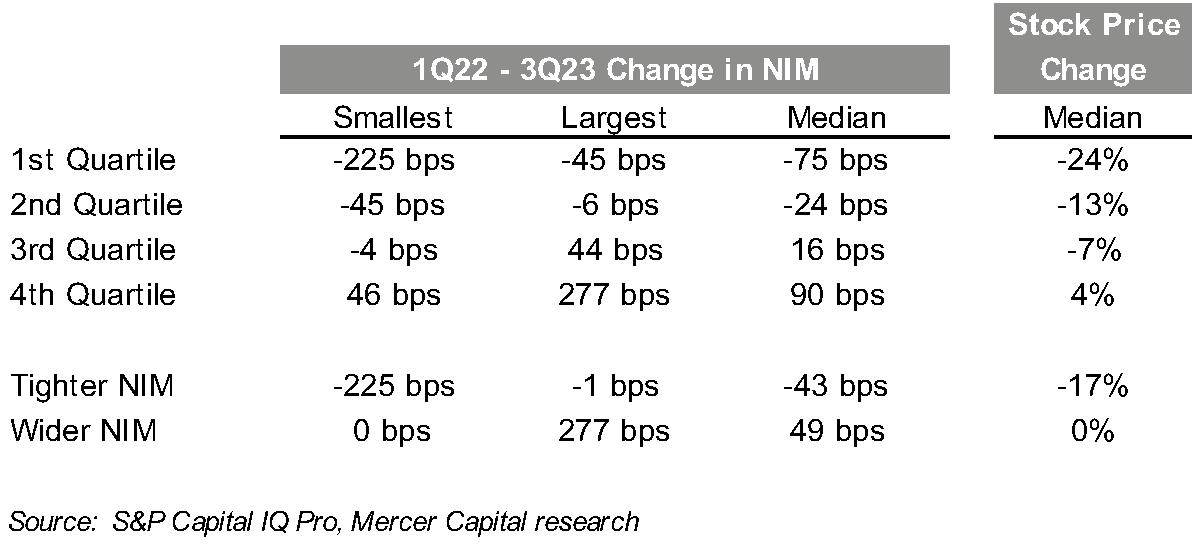
Figure 7 illustrates the earnings pressure resulting from tighter NIMs. For 2023, analysts’ EPS estimates indicate a median EPS decline of 15% for publicly traded banks with assets between $1 and $15 billion, with 73% of the banks in the analysis expected to face lower year-over-year earnings in 2023. These estimates are based upon recent data. Measured from January 2023, the reduction in earnings estimates is much more severe, meaning analysts cut estimates as the year progressed.
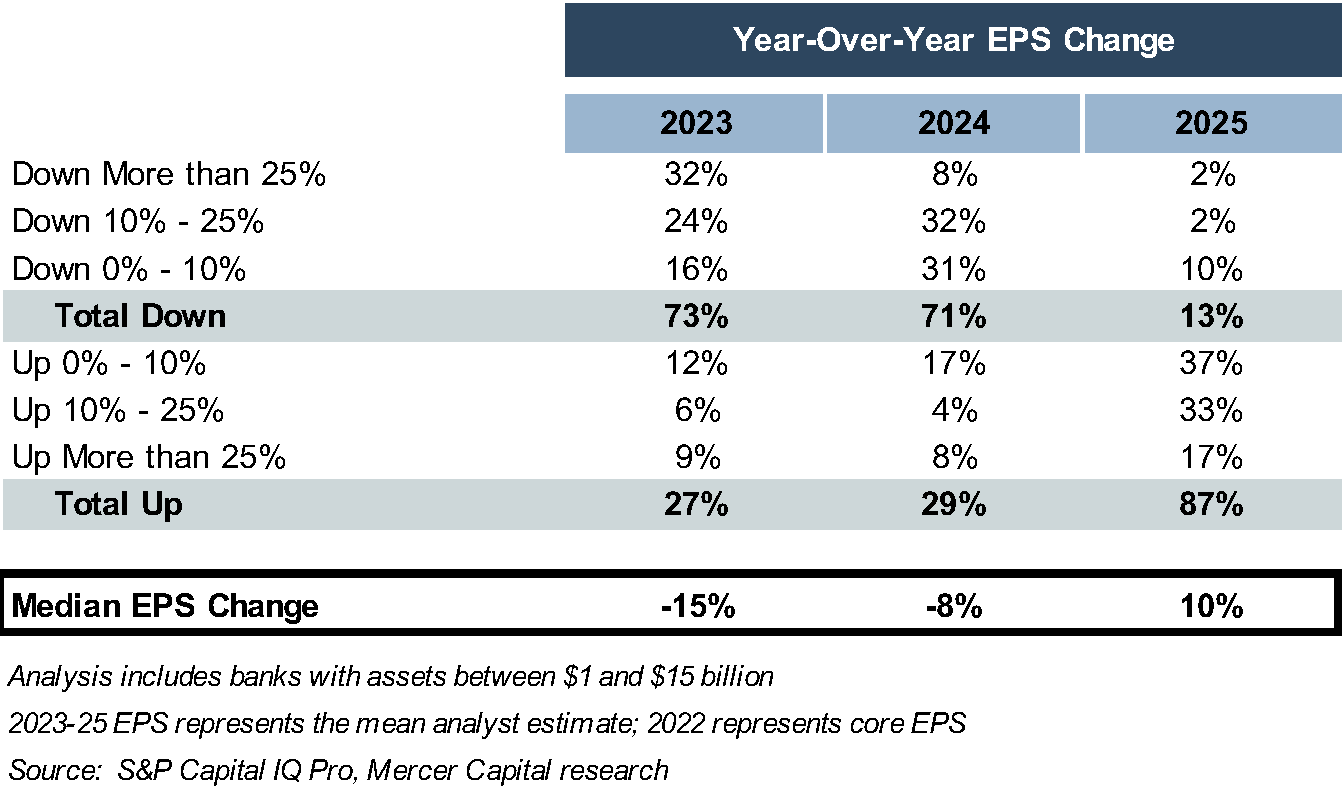
The outlook is only marginally better in 2024, as the median decline in EPS is 8%. Analysts generally expect NIMs to stabilize, or at least decline at a more modest rate, in the first half of 2024, followed by some expansion in the second half of 2024. The NIM stabilization in the latter half of 2024 leads to earnings growth in 2025 for most banks, with a median EPS growth rate of 10%. However, only 28% of banks in our analysis are projected to have higher EPS in 2025 than in 2022.
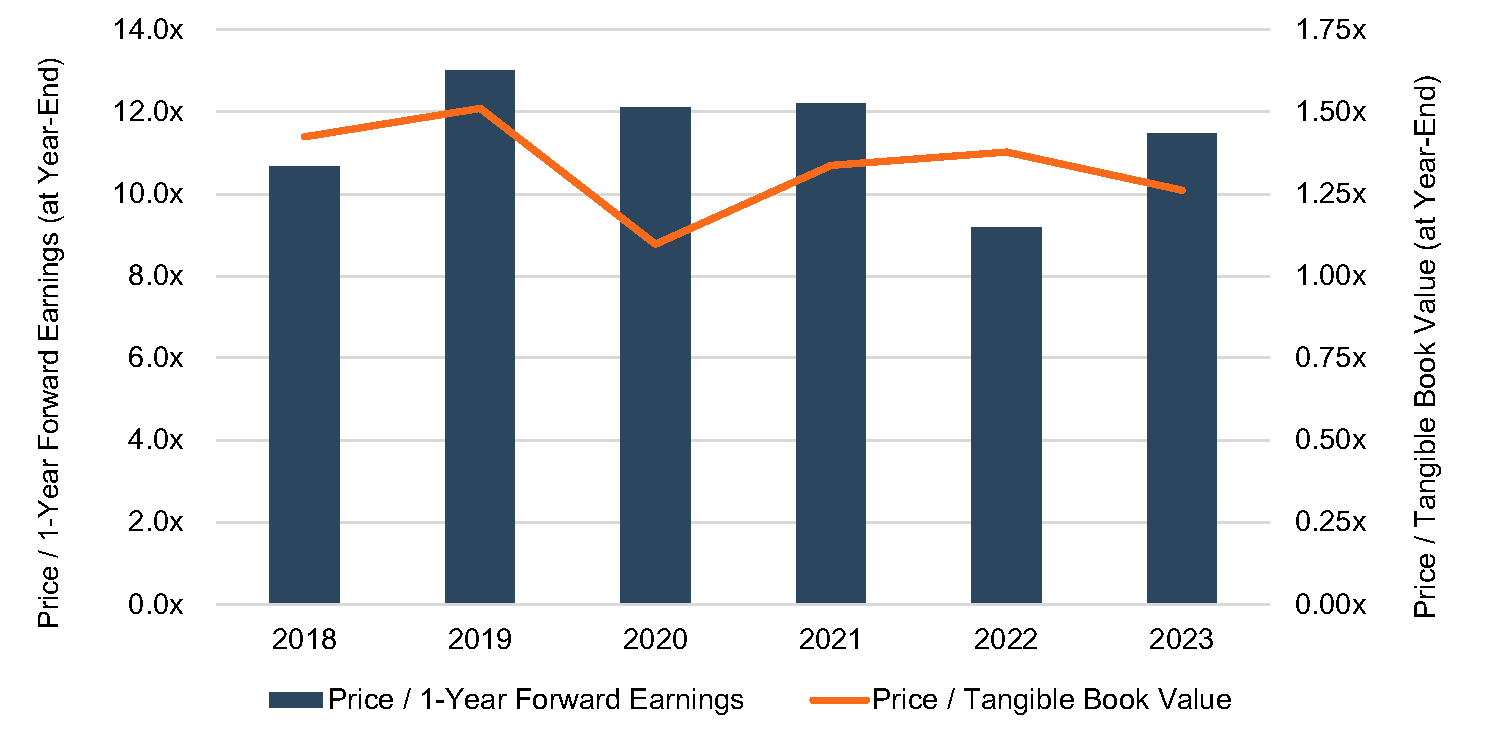
With the share price recovery in late 2023, publicly traded banks with assets between $1 and $15 billion reported a median price/one year forward earnings multiple of 11.5x and a price/tangible book value multiple of 1.26x. As indicated in Figure 8, these multiples are in-line with the range over the last five years. Therefore, the catalyst for further share price appreciation likely will be earnings improvement rather than P/E multiple expansion.
The worst has passed for banks, with slowing deposit attrition and stabilizing NIMs, unless credit performs materially worse than expected. However, conditions likely are not ripe for rapid earnings growth. First, NIMs likely will recover more slowly than they contracted due to volume of assets repricing years into the future. Second, many banks are reporting slowing loan growth, as higher rates have gradually eroded loan demand. Third, if loan demand exists, marginal funding remains difficult to obtain at a favorable cost of funds. For many publicly traded banks, returning to the garden of earthly delights remains a ways off.