What was expected to be a prosaic first quarter was anything but that. It was punctuated by the failures of SVB Bank and Signature Bank, the wind down of Silvergate Bank and the near(ing) failure of First Republic Bank (NYSE: FRC). Ironically, failures that were precipitated by deposit runs were triggered by fears of unrealized losses in bond portfolios that occurred five months after Treasury yields peaked.
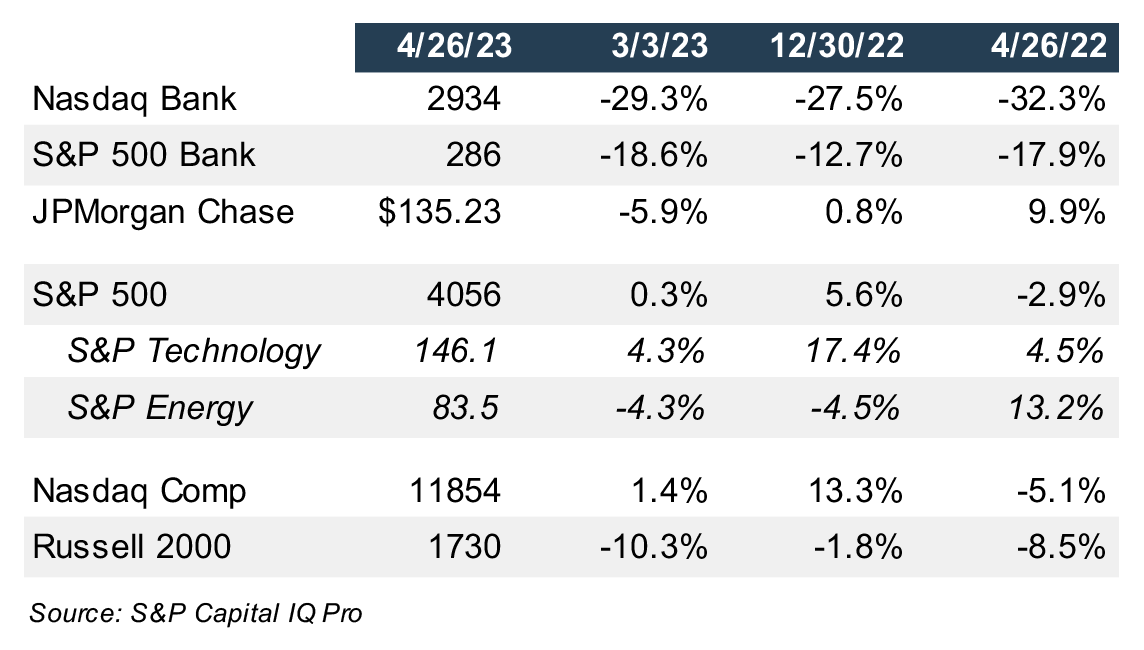
Year-to-date (through April 26) the Nasdaq Bank Index declined 28% compared to 13% for the S&P Bank Index as deposits flowed into the presumed safety of “too big to fail” institutions. JPMorgan Chase & Co. (NYSE: JPM) is an outlier among banks in that its shares are up slightly YTD. Also notable is the outperformance of Technology Select Sector (NYSE: XLK) this year in a reversal of 2022 when tech stocks underperformed in the market.
To the extent falling stocks are foreshadowing poor earnings or dilutive equity raises at low share prices, it was not evident in first quarter earnings among community banks ($1-$10 billion of assets) and regional banks ($10 billion to $50 billion of assets) reports as of April 25. Earnings were fine, albeit down from the fourth quarter as is often the case given the 90 days to accrue interest compared to 92 days in the fourth quarter.
The quarter was hardly a disaster, though the severe underperformance of bank stocks before SVB failed portends problems to come with likely some amount of overreaction by investors.
Ultimately, stocks follow earnings (or cash flow) over time, while valuations ebb and flow with changes in interest rates, an industry’s profit cycle, and expected earnings growth. Quarterly earnings do not matter much other than what the current quarter implies about earnings expectations over the coming year or two and how those updated expectations get expressed in sell-side analysts estimates.
As shown in Figure 2, Wall Street banks posted upside surprises as a group with JPMorgan producing blow out results as a result of deposit inflows and because trading was very strong as market volatility exploded. Otherwise, most banks missed what were already low expectations due to NIM pressure from rapidly rising cost of funds (“COF”).
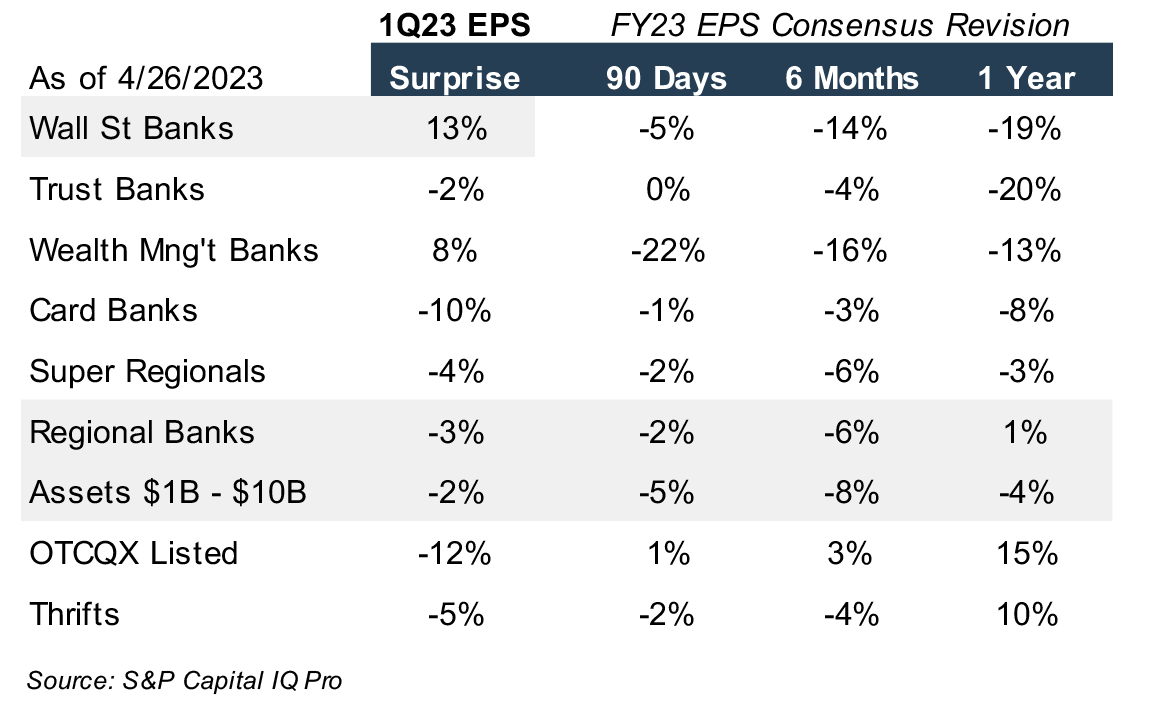
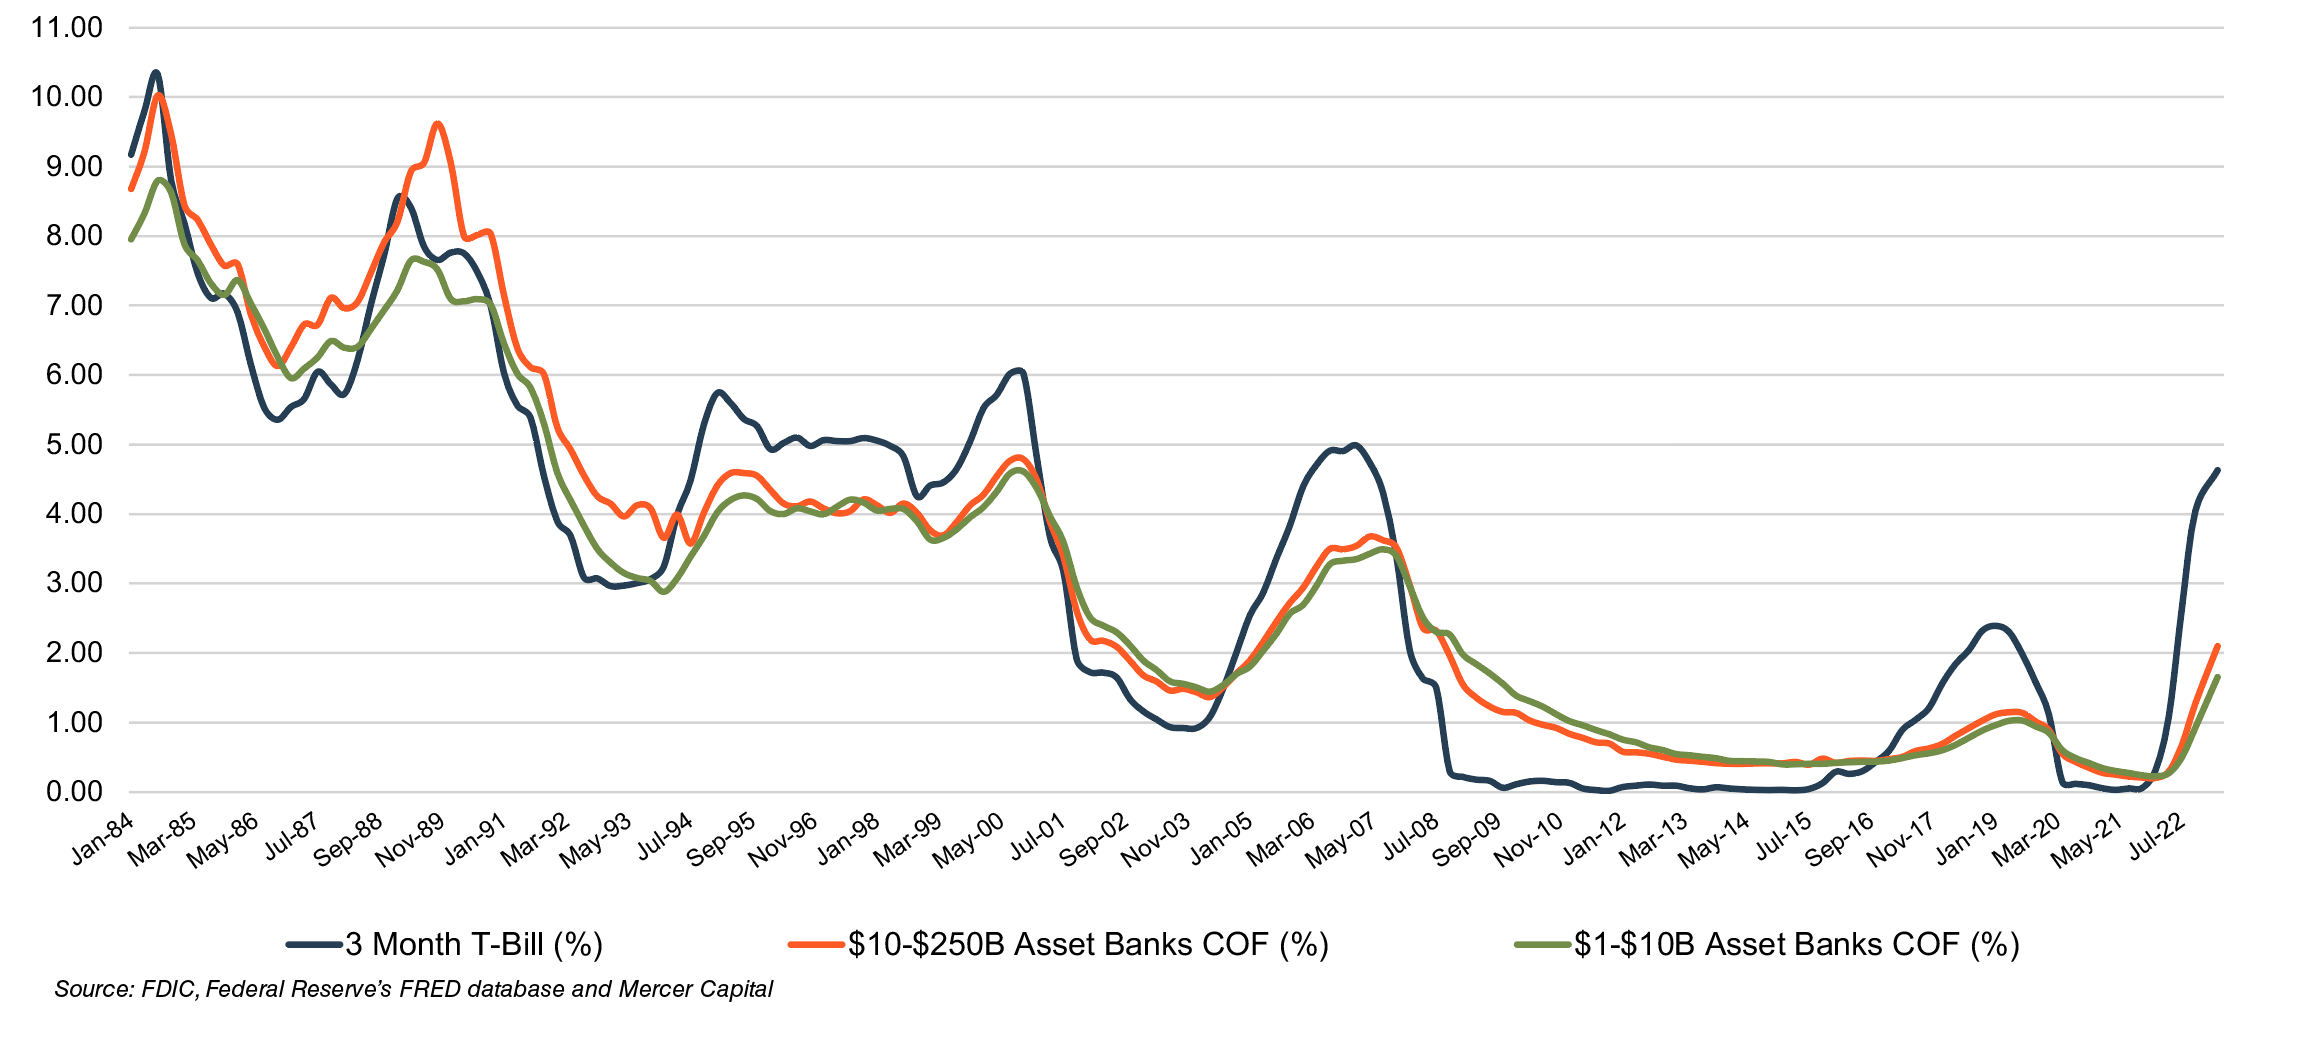
Figure 2 also partially explains why bank stock prices have fallen as consensus EPS expectations have declined over the past six months as a once benign rising rate environment has transitioned to a headwind. As shown in Figure 3 (on the next page) the gap between banks’ cost of funds and the quarterly average 3-month T-bill yield is unusually wide for a rising rate environment. The gap is now narrowing as banks have been forced to aggressively raise deposit rates and excess funds shift to interest bearing accounts.
Once analysts fully update estimates over the coming weeks, we suspect 2023 EPS estimates will show a much sharper reduction than what is reflected in Figure 2. However, the poor performance of bank stocks since the failure of SVB and SBNY implies investors have more worries than the COF/NIM dynamic on forward earnings.
To paraphrase the late Donald Rumsfeld, the known unknown is credit unless there is an unknown unknown that is troubling stocks. Inverted yield curves typically precede recessions by about 18 months compared to ten months of inversion so far in this cycle as measured by the 10/2 spread. Further, the failure of SVB/SBNY has tightened the availability of credit as banks seek to increase liquidity.
So far, leading credit indicators are mostly benign. Past dues and non-accrual loans within the banking system are low, and the option adjusted spread (“OAS”) on the BofA High Yield Index over U.S. Treasuries was 463bps compared to the 10-year average of 443bps. CMBS is showing some strain, however, with 5.6% of commercial mortgages remanded to special servicing though among subsectors retail remains very elevated, office is climbing and lodging has declined sharply over the past year.
Valuations are very low with community and regional banks trading for 8.1x and 8.7x consensus 2023 estimates and comparable multiples based upon flattish 2024 estimates. Super regionals trade for about 7x earnings. The long-term average based upon one-year forward earnings ranges from 12x for super regionals to 14x for community banks.
Click here to expand the image above
Whether the current environment proves to be a tremendous buying opportunity or a sell-off in anticipation of a sharp recession or prolonged period of stagflation is to be determined. Banks are characterized as “early cyclicals” on Wall Street — meaning they turn down well in advance of a recession and turn up when the recession is in full force. Nonetheless, we expect most community banks to perform well or well enough given low-cost deposit franchises — provided they have not over-invested in long-duration assets and/or operate with high-cost structures.