Bank M&A activity in 2025 had a “back-to-normal” feel following a bounce back in 2024 after the failure of SVB and Signature Bank in March 2023. Next year may have a mid-to-late 1990s vibe if large regional bank acquisitions build on what has occurred in 2025.
In 2025, the number of announced deals rose for the second consecutive year to 176 as of December 22 which equated to 3.8% of bank charters at the beginning of the year compared to 130/2.8% in 2024 and the post GFC low of 101/2.1% transactions in 2023 (See Figure 1 on the next page). Since 1990, the number of transactions each year typically ranges between 2% and 4% of bank charters though acquisitions exceeded 4% during 2014-2019 and 2021.
Of the 176 announced deals this year, there were 75 in which pricing was disclosed with an aggregate value of $49 billion compared to 56 deals worth $17 billion in 2024 and just 26 deals/$4 billion in 2023.
Aside from an increase in activity, the other notable change in the M&A market was the impact the Trump Administration has had by greenlighting deals among regionals and approving deals much faster.
The largest deal was the October 6 announcement that $213 billion asset Fifth Third Bancorp (NASDAQ: FITB) will acquire $77 billion asset Comerica Inc. (NYSE: CMA) for $10.8 billion based upon the value of FITB’s shares at announcement.
There were two other markers that pointed to a decided shift in the environment.
One was the quasi merger of equals (“MOE”) among Pinnacle Financial Partners, Inc. (NASDAQ: PNFP) and Synovus Financial Corp. (NYSE: SNV) whereby the rechristened PNFP will become a category IV bank with $116 billion of assets and thereby will be subject to more regulatory oversight.
The other notable positive indicator was the announcement of two back-to-back deals by $210 billion asset Huntington Bancshares Inc. (NASDAQ: HBAN) for Dallas-based Veritex Holdings, Inc. on July 14, 2025, and Tupelo, Mississippi-based Cadence Bank on October 27, 2025. The Veritex deal closed three months after announcement on October 20 and the Cadence deal is expected to close three months after announcement on
February 1. Both Huntington and Fifth Third will become Category III banks with over $250 billion of assets.
The set-up as of year-end 2025, like year-end 2024, is for 2026 M&A activity to be comparable or better than the prior year with the caveat that more regionals may transact in 2026 provided equity markets generally and bank stocks specifically do not materially weaken. Factors supporting an even better M&A market include:
- Bank stocks as acquisition currencies have reasonable purchasing power with $10-$100 billion asset banks trading for 11x 2026 consensus EPS and 1.6x tangible book value per share (“TBVPS”) and banks with $2-$10 billon of asset trading for 11x FY26E and 1.3x TBVPS.
- Profitability for sellers, all else equal, should be better in 2026 as most banks enter the year with a higher NIM than last year, while asset quality is generally okay.
- Fair value rate marks applied to low-coupon fixed-rate loan and bond portfolios are less punitive as fixed rate assets that were purchased and originated during 2020-1H22 roll down the curve.
- FASB rescinded its absurd “double-counting” for credit losses and thereby lessened day-one dilution to tangible BVPS.
- Succession issues, board fatigue, and shareholder desire for liquidity are not new issues, but have become more pronounced as the number of potential buyers decline, all else equal, for a given franchise.
How much, if any, M&A activity accelerates with or without improved pricing in 2026 remains subject to multiple variables, as always. The economy and bank credit quality are in good (or good enough) shape and public markets, including bank stocks, are on an uptrend and are finishing the year on a strong note. Also, spreads on high-yield bonds and leverage loans are tight near multi-year lows, reflecting investor optimism about credit quality for the time being.
Figure 1 :: National Bank M&A Activity
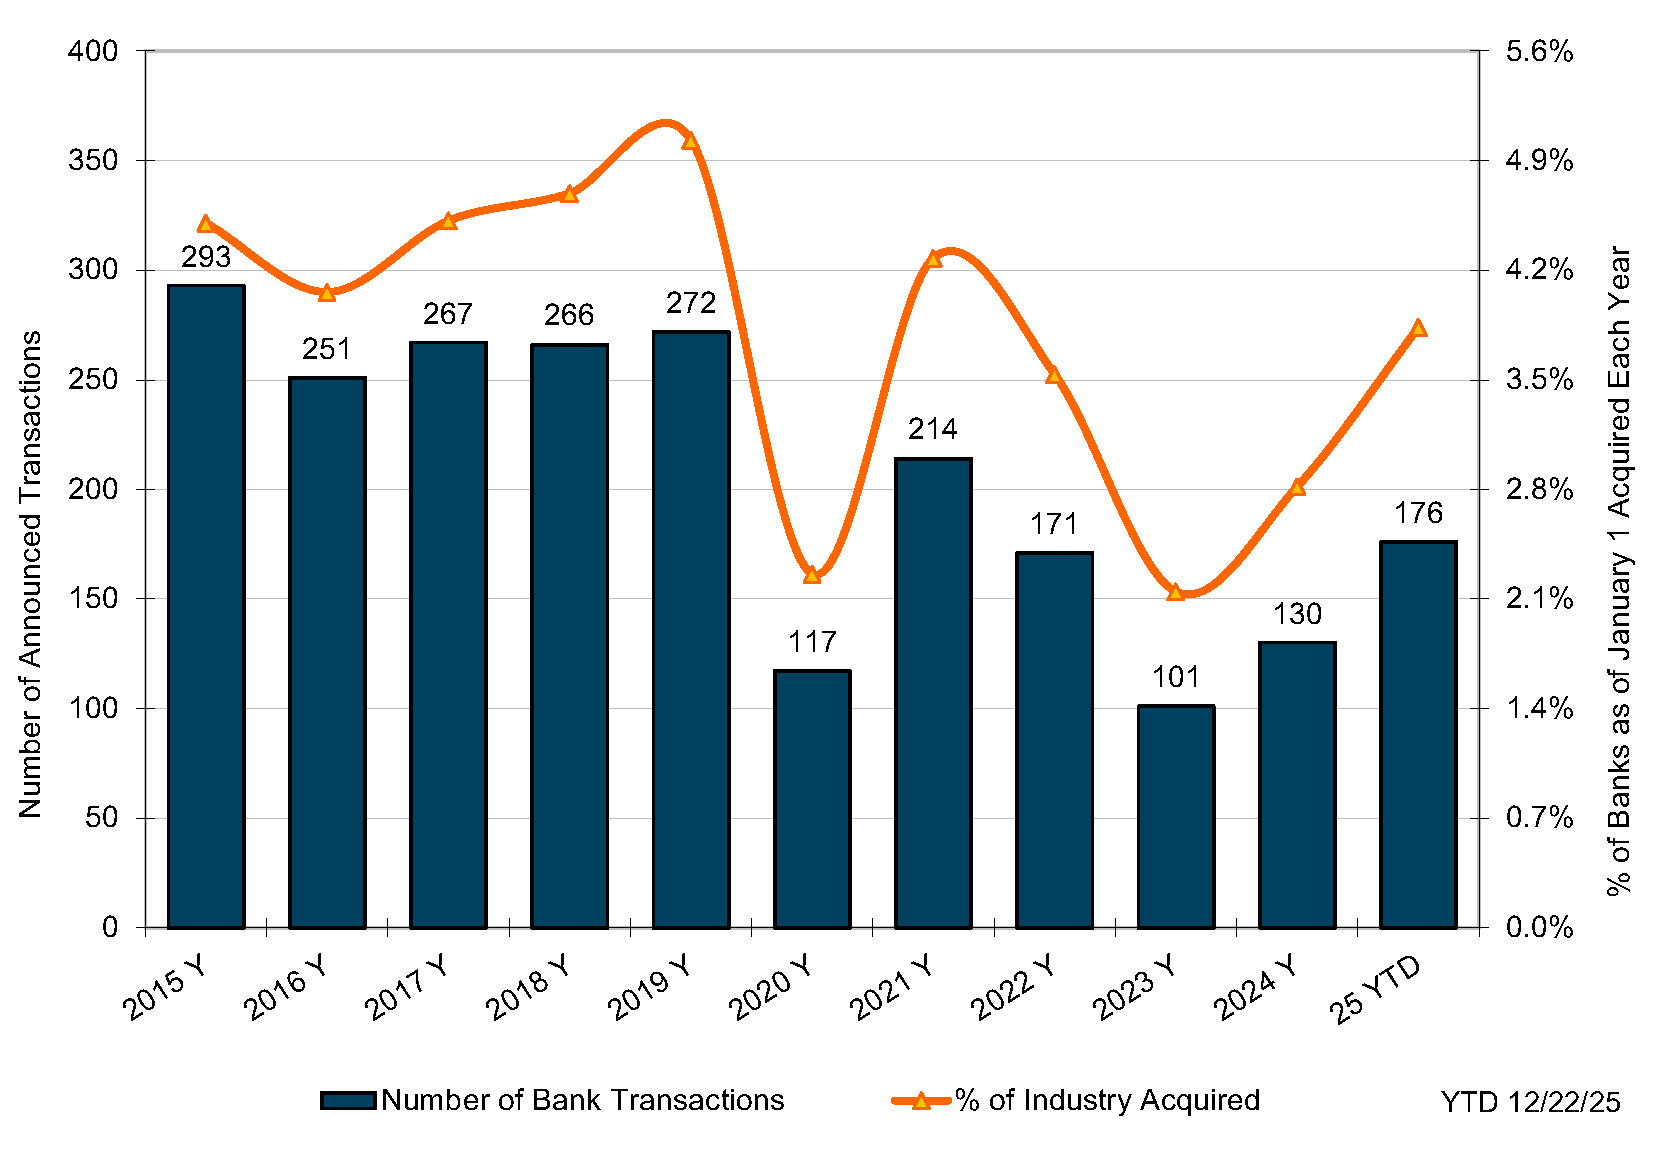
Source: S&P Global Market Intelligence
Pricing Rebounds
As shown in Figure 2, the average M&A P/TBV multiple rebounded to 143% from 121% in 2024. The post-GFC peak average multiple of 174% occurred in 2018 as public market multiples expanded in 2017 with the reduction in corporate tax rates and gradually rising short-term rates that caused NIMs to expand without much mark-to-market drawbacks. Then from mid-2018 until mid-2023, public market and (therefore) M&A multiples trended lower with the onset of COVID and a return to a zero-rate interest rate policy that was followed by rapid rate hikes, an inverted yield curve, and the failure of SVB, Signature Bank and First Republic Bank.
Figure 2 :: National Average M&A Multiples
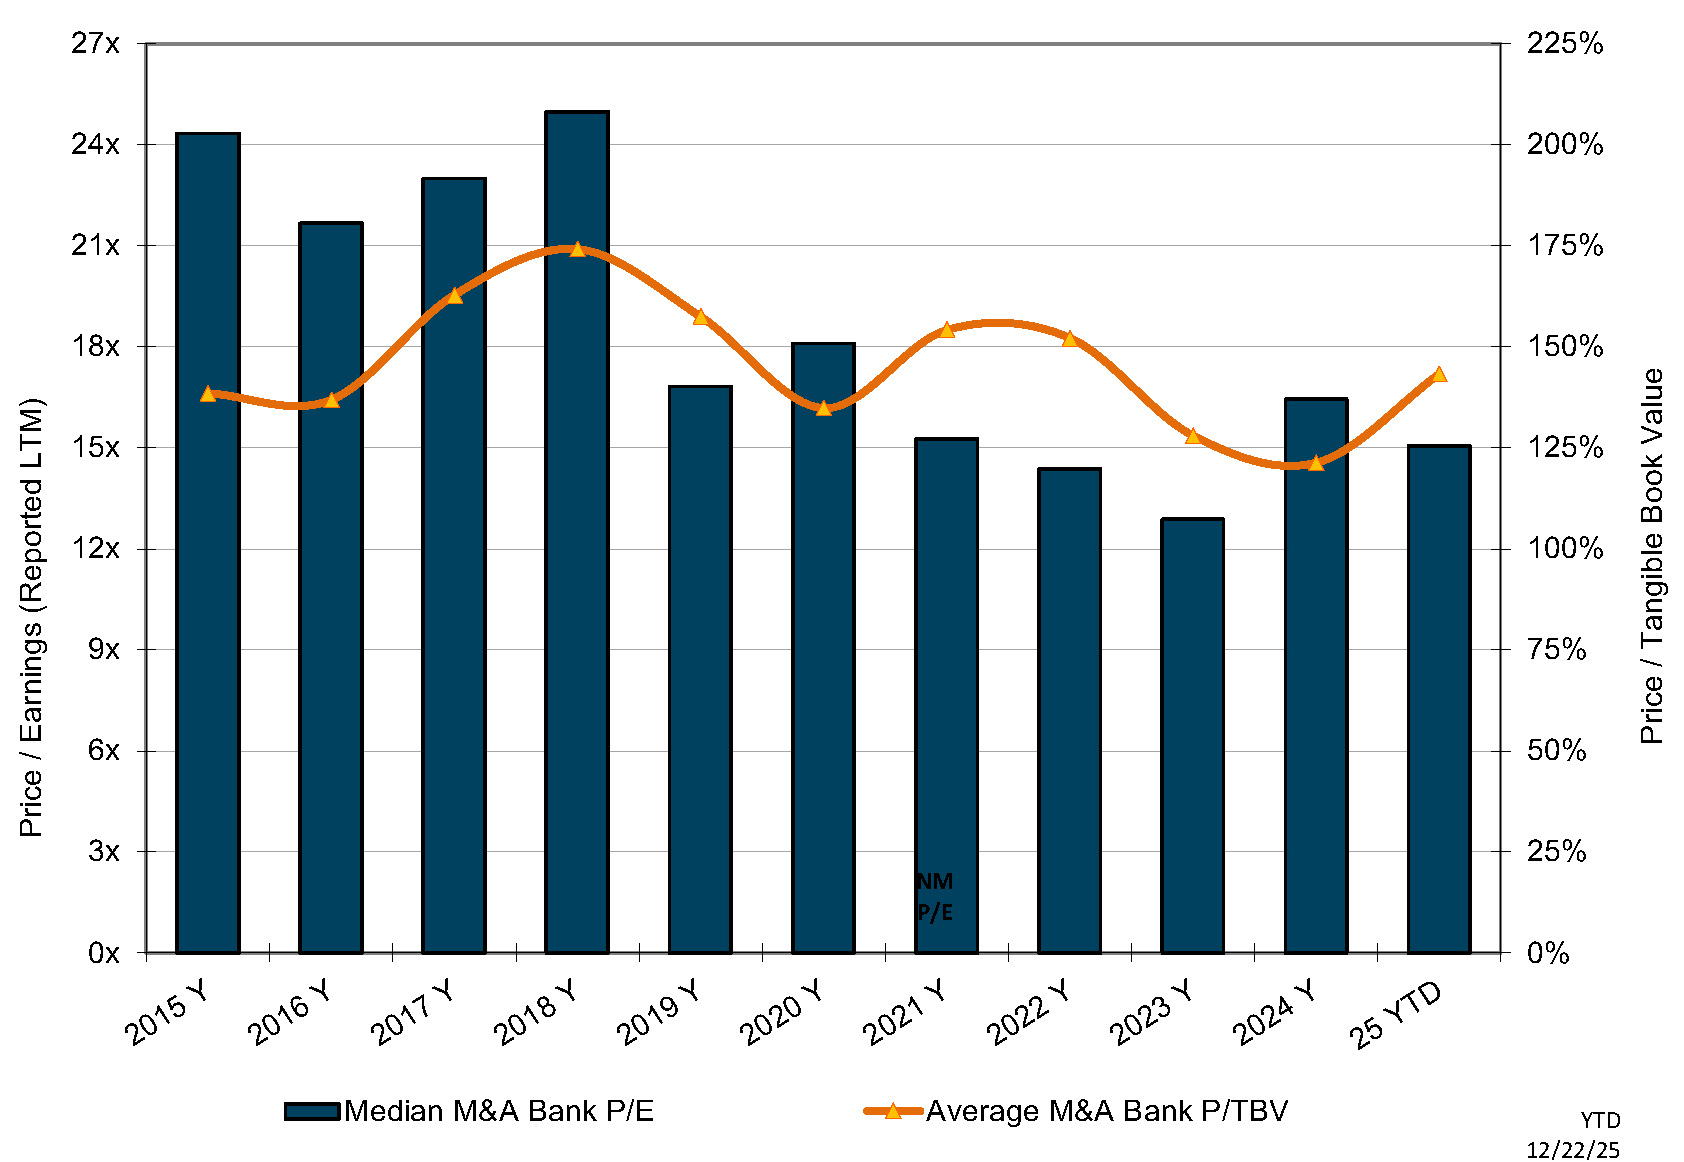
Source: S&P Global Market Intelligence
The median P/E based upon LTM reported net income eased to 15.1x from 16.0x but remained within the 13x to 17x band that has prevailed since 2019 (unadjusted P/Es were distorted in 2018 because reported net income included a write-down of deferred tax assets with passage of corporate tax reform that lowered the top corporate tax rate to 21% from 35%). Inclusive of after-tax expense saves, acquisition multiples tend to be 6x to 9x pro forma earnings.
Public Markets Drive M&A Pricing
Public market valuations drive acquisition pricing given that the predominant form of consideration includes some or solely common shares issued by the buyer other than small cash deals. Buyers seek to limit ownership and day one dilution to TBVPS and maximize EPS accretion. Valuation of the buyer’s shares in the public market is a key pricing governor aside from the earning power, targeted expense saves, and credit marks attributable to the seller.
The good news for the 2026 M&A outlook is that acquirers from the public bank universe enter the year with supportive valuations, but not rich valuations as was the case in 2018 when acquisition multiples peaked in the post-GFC years. Publicly traded banks with $10 billion to $100 billion of assets trade for median multiples of ~11x 2026 consensus EPS and ~1.6x TBVPS, while banks with $2 billion to $10 billion trade for median multiples of 11x and 1.3x.1
Figure 3 :: Top 2025 M&A Transactions
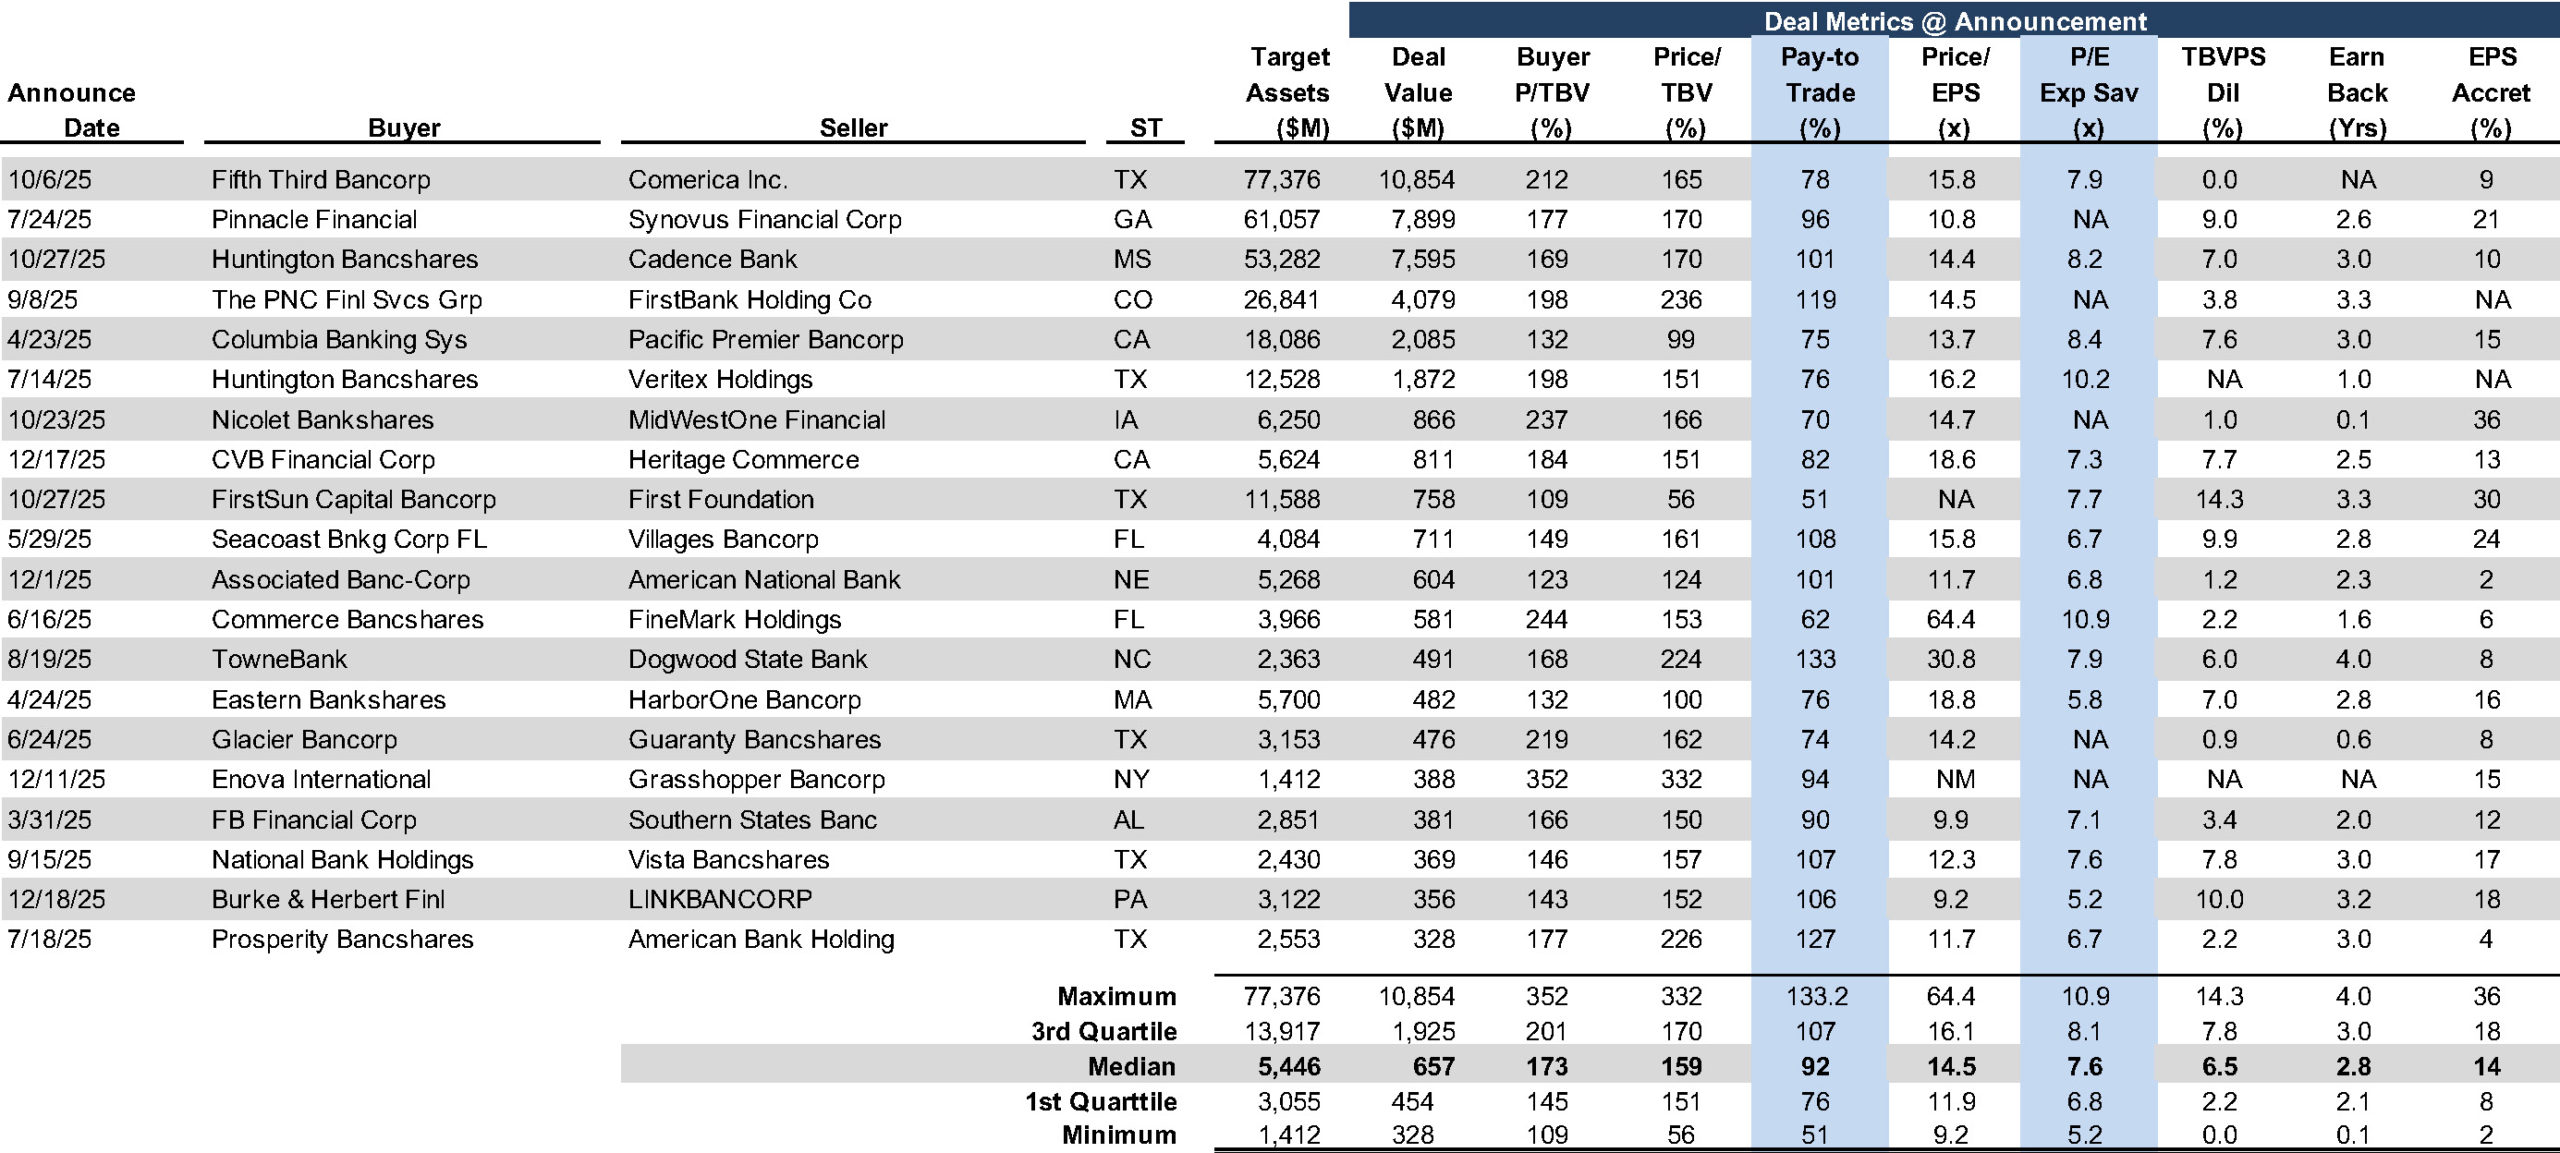
Click here to expand the image above
Modest P/E multiples inclusive of expense saves are necessary to generate EPS accretion, and EPS accretion is necessary to recoup day one dilution to TBVPS. Since the GFC, investors have been intensely focused on the time to recover TBVPS dilution as a means to limit buyers’ pricing flexibility. Our take on current pricing is that investors want recovery in 2-3 years, in part because there is too much uncertainty about future EPS accretion vis-à-vis certainty about day one dilution.
Buyers measure this differential as the pay-to-trade ratio, which is the market-based measurement of the book-to-book ratio when the seller marked equity for known problem loans not covered in the loan loss reserve, appreciated assets, contingent liabilities and the like. Generally, transactions that involve a publicly traded buyer will entail a pay-to-trade multiple in the vicinity of 80% to 95% though sometimes a multiple above 100% may be observed when the seller’s earning power may be understated, or strategic considerations cause the buyer to step up.
Although not shown, pay-to-trade ratios when based upon the seller’s proforma P/E with expense saves vs. the buyer’s P/E should be well below 1.0x, otherwise there would be no EPS accretion and no recovery of day one dilution to the buyer’s TBVPS.
The Exchange Ratio vs. “Price”
While investors are focused on price, it is worth noting that the central issue in M&A is the exchange ratio rather than price when the sole or primary consideration is shares of the buyer. Price is a function of the buyer’s share price, which fluctuates daily, and the exchange ratio. Whether the buyer’s shares are reasonably priced is a separate issue to consider. Nonetheless, sellers who transacted in 2023 and 2024 may have been disappointed by pricing vs. the pre-COVID years but likely received shares that were attractively priced that performed well during 2025. Likewise, buyers who transacted in 2018 may have encountered the opposite situation. The outlook for 2026 seems to fall somewhere between the two as of late year 2025.
About Mercer Capital
M&A entails a lot of moving parts of which “price” is only one. It is especially important for would be sellers to have a level-headed assessment of the investment attributes of the acquirer’s shares to the extent merger consideration will include the buyer’s common shares. Mercer Capital has over 40 years of experience in assessing mergers, the investment merits of the buyer’s shares and the like. Please call if we can help your board in 2026 assess a potential strategic transaction.
1Share performance shows greater divergence between small and large banks than valuations do. Large banks as measured by the S&P 500 Bank Index rose 31% year-to-date through December 22 compared to 16% for the Dow Jones MicroCap Bank Index and 7% for the KBW Nasdaq Regional Bank Index.