Fairness Opinions
Evaluating a Buyer’s Shares from the Seller’s Perspective – 2025 Update
Perhaps the IPO market is signaling that a notable improvement in the M&A market may occur after a so-so start in 2025. Financial services companies have been active, with notable IPOs such as Circle Internet Group (NYSE:CRCL) and Chime Financial (NASDAQ:CHYM). A pick-up in IPO activity historically has presaged a pick-up in M&A.
Bank M&A Deal Flow: 2025 Trends in Context
As of June 27, 2025, there have been 70 bank deals announced, which on an annualized basis if sustained would equate to about 3% of the 4,487 charters as of January 1. Over the past 35 years, typically 2% to 4% of the industry is acquired each year. The average P/TBV and P/E for the 26 deals with reported pricing was 146% and 17x.
Excluding small transactions, the issuance of common shares by bank acquirers usually is the dominant form of consideration sellers receive. While buyers have some flexibility regarding the number of shares issued and the mix of stock and cash, buyers are limited in the amount of dilution in tangible book value per share (“TBVPS”) they are willing to accept and require visibility in EPS accretion over the next several years to recapture the dilution.
Because the number of shares will be relatively fixed, the value of a transaction and the multiple(s) the seller hopes to realize are a function of the buyer’s valuation. High multiple stocks represent strong acquisition currencies for acquisitive companies because fewer shares are issued to achieve a targeted dollar value.
It is important for sellers to keep in mind that negotiations with acquirers where the consideration will consist of the buyer’s common shares are about the exchange ratio rather than price, which is the product of the exchange ratio and buyer’s share price. A fairness opinion will address the fairness of the exchange ratio and consideration received by selling shareholders, not “price” per se in a stock swap transaction.
The Complexity of Evaluating Offers
Unlike cash deals, comparing and assessing fairness (and value) when stock swap offers are received requires a lot more deliberation by a board of directors and its advisor. One offer may entail a higher nominal price, but the acquirer’s shares may trade at a premium whereas a competing offer may equate to a lower price but the shares may entail less risk. Also, exchange ratios can be evaluated based upon the pro forma ownership of the acquirer post-closing compared with the contribution of operating income, core deposits and the like.
When sellers focus on price, it is easier all else equal for acquirers to ink a deal when their shares trade at a high multiple of TBVPS and EPS. However, high multiple stocks represent an under-appreciated risk to sellers who receive the shares as consideration. Accepting the buyer’s stock raises a number of questions, most of which fall into the genre of: what are the investment merits of the buyer’s shares? The answer may not be obvious even when the buyer’s shares are actively traded.
Board Oversight
Our experience is that some if not most members of a board weighing an acquisition proposal do not have the background to thoroughly evaluate the buyer’s shares. Even when financial advisors are involved, there still may not be a thorough vetting of the buyer’s shares because there is too much focus on “price” instead of, or in addition to, “value.”
The Role of Fairness Opinions in M&A
Fairness opinions seek to answer the question whether the proposed consideration is fair to a company’s shareholders from a financial point of view. The opinion should be backed by a robust analysis of all of the relevant factors considered in rendering the opinion, including an evaluation of the shares to be issued to the selling company’s shareholders. The intent is not to express an opinion about where the shares may trade in the future, but rather to evaluate the investment merits of the shares before and after a transaction is consummated.
Key Questions When Evaluating Acquirer Shares
As we have advised in the past, the key questions to ask about the buyer’s shares remain the same. They are:
- Liquidity of the Shares. What is the capacity to sell the shares issued in the merger? SEC registration and NASADAQ and NYSE listings do not guarantee that large blocks can be liquidated efficiently. OTC listed shares should be scrutinized, especially if the acquirer is not an SEC registrant. Generally, the higher the institutional ownership, the better the liquidity.
- Profitability and Revenue Trends. The analysis should consider the buyer’s historical growth and projected growth in revenues, pretax pre-provision operating income and net income as well as various profitability ratios before and after consideration of credit costs. The quality of earnings and a comparison of core vs. reported earnings over a multi-year period should be evaluated.
- Pro Forma Impact. The analysis should consider the impact of a proposed transaction on the pro forma balance sheet, income statement and capital ratios in addition to dilution or accretion in earnings per share and tangible book value per share both from the seller’s and buyer’s perspective.
- Tangible BVPS Earn-Back. The projected earn-back period in day-one dilution to TBVPS is an important consideration for the buyer. In the aftermath of the GFC, an acceptable earn back period was on the order of three to five years; today, two to three years as institutional shareholders have indirectly tightened the pricing box for M&A by demanding that publicly traded buyers limit TBVPS dilution to short payback periods.
- Dividends. Sellers should not be overly swayed by the pick-up in dividends from swapping into the buyer’s shares; however, multiple studies have demonstrated that a sizable portion of an investor’s return comes from dividends over long periods of time. Sellers should examine the sustainability of current dividends and the prospect for increases (or decreases). Also, if the dividend yield is notably above the peer average, the seller should ask why? Is it payout related, or are the shares depressed?
- Capital and the Parent Capital Stack. Sellers should have a full understanding of the buyer’s pro-forma regulatory capital ratios both at the bank-level and on a consolidated basis (for large bank holding companies). Separately, parent company capital stacks often are overlooked because of the emphasis placed on capital ratios and the combined bank-parent financial statements. Sellers should have a complete understanding of a parent company’s capital structure and the amount of bank earnings that must be paid to the parent company for debt service and shareholder dividends.
- Loan Portfolio Concentrations. Sellers should understand concentrations in the buyer’s loan portfolio, outsized hold positions, and review the source of historical and expected losses.
- Ability to Raise Cash to Close. What is the source of funds for the buyer to fund the cash portion of consideration? If the buyer has to go to market to issue equity and/or debt, what is the contingency plan if unfavorable market conditions preclude floating an issue?
- Consensus Analyst Estimates. If the buyer is publicly traded and has analyst coverage, consideration should be given to Street expectations vs. what the diligence process determines. If Street expectations are too high, then the shares may be vulnerable once investors reassess their earnings and growth expectations.
- Valuation. Like profitability, valuation of the buyer’s shares should be judged relative to its history and a peer group presently and relative to a peer group through time to examine how investors’ views of the shares may have evolved through market and profit cycles. Valuation is rarely a catalyst for a stock, but both absolute and relative valuation speak to one aspect of investment risk.
- Share Performance. Sellers should understand the source of the buyer’s shares performance over several multi-year holding periods with returns disaggregated into three components: EPS growth, multiple expansion or contraction, and the impact of reinvested dividends. If the shares have significantly outperformed an index over a given holding period, is it because earnings growth accelerated? Or is it because the shares were depressed at the beginning of the measurement period? Likewise, underperformance may signal disappointing earnings, or it may reflect a starting point valuation that was unusually high.
- Strategic Position. Assuming an acquisition is material for the buyer, directors of the selling board should consider the strategic position of the buyer, asking such questions about the attractiveness of the pro forma company to other acquirers.
- Contingent Liabilities. Contingent liabilities are a standard item on the due diligence punch list for a buyer. Sellers should evaluate contingent liabilities too.
Conclusion: Value, Risk, and the Post-Deal Reality
The list does not encompass every question that should be asked as part of the fairness analysis, but it does illustrate that a liquid market for a buyer’s shares does not necessarily answer questions about value, growth potential and risk profile. When one surveys the M&A history of banks, there is no shortage of sellers who were waylaid by the performance of the buyer’s shares after the deal closed.
We at Mercer Capital have extensive experience in valuing and evaluating the shares (and debt) of financial and non-financial service companies garnered from over four decades of business.
Potential Intersection of Estate Planning During the Divorce Process
Divorce is often an emotionally and financially draining process, and estate planning may be the last thing on the minds of the divorcing parties. However, reviewing estate plans during a divorce can be a step in preparing for the future. Like many aspects of divorce, timing matters and there are both advantages and drawbacks to updating your estate documents while the divorce is still pending.
The Pros of Estate Planning During Divorce
Divorce proceedings can take months or even years. During that time, the current spouse may still have legal authority over health care decisions, financial matters, and inheritances under a preexisting estate plan. Updating documents such as power of attorney, health care proxy, and beneficiary/trustee/guardian designations (if legally allowable as discussed later) can ensure that soon-to-be exes do not have unwanted control over affairs in the event of incapacitation or death before the divorce is finalized. There can also be a form of “reverse” estate planning, such as placing restrictions on certain persons as beneficiaries under a trust.
While everyone wants to know the value of their privately held business, it can be costly, which leads many business owners to go years without a valuation. As seen in our graphic “The Business Transfer Matrix”, death and divorce are two events that lead to the valuation process.
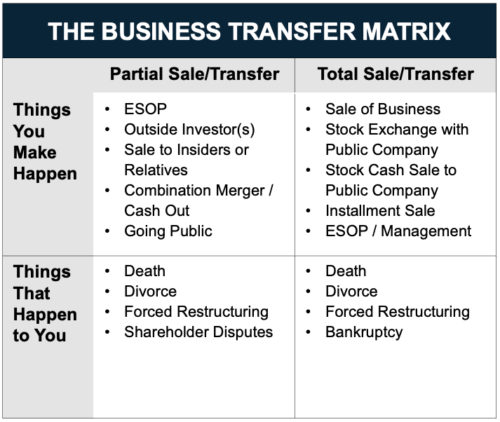
Revising an estate plan contemporaneous to on-going divorce proceedings may lead to efficiencies for divorcing and gifting parties. When a couple owns a business or multiple business interests, the expert fees associated with valuing the businesses can pile up quickly, particularly when there are competing experts, and two sets of attorneys preparing for a contentious trial.
Contrast this to the parties agreeing on one expert to value a business interest which is then transferred for the benefit of the divorcing couple’s children. While this approach may result in lower costs, it may also result in a significant benefit of reduced acrimony in settlement discussions. The in-spouse (the one who stays involved with the business post-divorce) does not want to overpay their spouse just as the out-spouse wants to receive as much in equitable distribution. By transferring the economic interest (perhaps even structuring such that one of the divorcing parties maintains operational control of the business), this can “take valuation off the table” because the business interest would no longer be part of the marital estate in addition to the many benefits of estate planning absent a divorce proceeding.
Transferring the business interest out of the marital estate may also become a last resort if the two valuation experts have irreconcilable valuations for the business. There is the added benefit of potential tax benefits available to married couples such as gift-splitting that will no longer be available post-divorce. While estate planning during divorce is not a one-size-fits-all approach, it can be a creative way to get a case settled and save money in the long-run.
The Cons of Estate Planning During Divorce
Some states impose “automatic temporary restraining orders” (ATROs) during divorce proceedings, which can limit the ability to change beneficiary designations or transfer assets. These rules are designed to prevent one spouse from hiding or dissipating marital property but may also restrict legitimate estate planning modifications. This is an appropriate safeguard and further highlights the need for cooperation to be able to embark upon estate planning during a divorce – something that is frequently not observed. For estate planning to realize optimal outcomes in a divorce process, a proper team should be assembled on the front end of a divorce process, as both parties are well-served to preserve end-goals such as tax planning, rather than have the dispute fall into a process of manipulation for personal-benefit reasons in the divorce process.
Until the divorce is finalized, the parties’ individual financial picture is in flux. We typically assist with the determination of asset values (like a business), equitable distribution, alimony, and child support obligations, that can make it hard to plan accurately for future asset composition. Premature changes to an estate plan might also conflict with the eventual divorce settlement or require costly revisions in the future, particularly if both parties initially agree, then one or both back out of the estate planning process.
One financial concept to think about is “core” and “surplus” capital, a framework that frequently arises in our discussions with wealth advisors. During an estate planning process, it’s important to know how much you can comfortably transfer to future generations or charitable causes. While reducing taxes and increasing proceeds for future generations is an admirable goal, this should not come at the expense of financial uncertainty. Stated plainly, advice we’ve heard is “don’t give away more than you can afford to realize your personal financial objectives”.
The divorce process already introduces a significant amount of uncertainty, going from one family budget to two households, among a host of other changes. Estate planning requires clear thinking and careful consideration — two things that may be in short supply during a divorce. For some, adding another layer of legal work may overcomplicate the process and lead to unwanted delays. This complexity reminds us of estate planning some business owners do in advance of selling their business.
To accomplish successful estate planning during divorce, respective legal counsel may collaborate on certain issues. While some family law groups are part of larger law firms, many others focus exclusively on family law. Firms that possess capabilities in both estate planning and family law may have a built-in advantage to realize a mutually acceptable estate plan during a divorce, but it ultimately comes down to communication amongst the attorneys, and being part of the same firm is not a prerequisite for good communication. Even firms that offer both legal disciplines may not represent the most efficient course of action if an estate plan was already drafted by another firm as it may be easiest to have the initial drafting firm update the documents based on discussions with the family law attorneys.
From a valuation perspective, a firm that is well versed in both family law and estate planning is best positioned to navigate the labyrinth of issues that lead to equitable outcomes. Mercer Capital’s senior professionals are members of the American Academy of Matrimonial Lawyers (AAML) Foundation Forensic & Business Valuation Division and are also regularly engaged by the nationally prominent estate planning attorneys. Our extensive valuation work for both family law and estate planning matters keeps us well informed of material developments in each field and how they may affect valuation and planning strategies.
Conclusion
In short, while estate planning during divorce adds complexity, in the right circumstances it can also be a vital resource — one worth considering depending on the size and composition of the marital estate as well as the cooperation opportunities amongst the divorcing parties. In all scenarios, seasoned legal counsel is advised. Combined with experienced valuation assistance, consideration of estate planning techniques in the midst of a divorce may result in a novel solution to the inherently complex and contentious divorce process.
Takeaways from the Pierce Case: The Importance of Relevant Data and Reasoned Analysis
The 2025 U.S. Tax Court opinion in Kaleb J. Pierce v. Commissioner of Internal Revenue (T.C. Memo 2025-29) offers insight on several issues that regularly feature in the valuations of privately held business interests. By presenting an issue-by-issue analysis, the Pierce decision reinforces an important message for appraisers and estate planners: relevant data and reasoned analysis carry the day in court.
Background
The subject company, Mothers Lounge, LLC, an S corporation for tax purposes, sold mother and baby products. The company sold cheaply manufactured goods directly to consumers. The business relied on a “free, just pay shipping” no returns model, which afforded it a high profit margin, but came with a plethora of unsavory business practices, including copying competitor products, over-charging customers for shipping, undermining wholesalers and marketing affiliates, and suppressing customer reviews.
The business history and practices detailed in the Findings of Fact are sufficient to raise eyebrows in a room full of former FTX executives. The dubious business model invited frequent litigation, with most lawsuits filed for trademark infringement. Two lawsuits were specifically described, one of which was for patent infringement and illegal marketing practices that had “ballooned into an existential threat.” Adding to these murky undercurrents were an affair of one of the business principals and a blackmail demand letter that spurred an FBI investigation. As noted by the Tax Court, these developments had “caused extreme dysfunction with the company’s management and demoralized the workforce” in the timeframe before the valuation date.
The company’s business practices may have raised eyebrows, but they were lucrative. The first successful product, a nursing cover, illustrates the model:

Despite giving the product to customers for “free,” Mothers Lounge, LLC earned a healthy 64% contribution margin on each unit sold, which was more than sufficient to cover all other operating expenses of the business. In 2013, the company had an EBITDA (earnings before interest, taxes, depreciation and amortization) margin of 29%, which many readers will recognize as above average for a consumer products business. The company was debt-free and required minimal investments in depreciating assets, making EBITDA a good proxy for pre-tax cash flow.
The Pierce court had to decide the proper value for gift tax purposes of two minority interests in Mothers Lounge, LLC that were transferred in 2014 (a 29.4% interest and a 20.6% interest).
Expert Witnesses
The taxpayer’s expert prepared a valuation report submitted at trial. During the administrative appeal of the case in 2017, the taxpayer’s expert had also prepared a forecast for the business (the “2017 Forecast”). The taxpayer’s expert did not rely on the 2017 Forecast in his appraisal of the subject interests before the Tax Court, but the valuation expert for the IRS did. To recap, there were two valuation experts at trial, one for the taxpayer and one for the IRS. In preparing his appraisal, the IRS’ valuation expert relied on the 2017 Forecast prepared by the taxpayer’s expert, but the taxpayer’s expert did not rely on the 2017 Forecast in preparing his appraisal.
Key Issues
Forecast
While both experts agreed on the application of the income approach, they relied on different forecasts. The forecast prepared by the taxpayer’s expert for his appraisal report relied on an analysis and assessment of relevant factors and market trends “known or knowable” as of the valuation date, which the Court deemed credible. In contrast, the IRS’ valuation expert relied on the 2017 Forecast “without independent verification,” which the Court easily rejected.
The fact that the taxpayer’s expert prepared the forecasts underlying both his own report and that of the IRS’ valuation expert is a unique feature of the case. While the Pierce court deemed the forecast used by the taxpayer’s expert credible, it declined to ascribe weight to the 2017 Forecast used by the IRS’ valuation expert (which was prepared by the taxpayer’s expert). According to the opinion, the taxpayer’s expert “was in a time crunch” to prepare the 2017 Forecast and he ultimately relied on post-valuation data to support its projections. The Court noted that the 2017 Forecast lacked any analysis or discussion of the events surrounding the FBI investigation and inappropriately relied on post-valuation data. The Court pointedly stated that “this reliance blurs the line between information that was known or knowable as of the valuation date and the information that was not reasonably foreseeable as of the valuation date.”
Tax Affecting
Both experts agreed that tax affecting the earnings of the company (an S corporation) was appropriate and used the Delaware Chancery method to calculate substantially equivalent tax rates (26.2% and 25.8%).
The Court commented that tax affecting earnings of tax pass-through entities can be rejected where “a party fails to adequately explain” its necessity or where the experts “have not accounted for the benefits of S corporation status to shareholders.” We note that the 2017 Tax Cuts and Jobs Act brought C and S corporations closer to parity in taxation, diminishing the additional economic benefits formerly realized by owners of pass-through entities. Nonetheless, the Pierce opinion affirms that the valuation of an interest in a tax pass-through entity should account for the effect, if any, of tax status on the value of the interest.
Discount Rate
Mothers Lounge, LLC had no debt and both experts developed a cost of equity capital (COEC) discount rate using the build-up method. The key differences between the experts were in the presentation of the underlying data and the application of a company-specific risk premium (CSRP).
The taxpayer’s expert used the Kroll Cost of Capital Navigator platform, which includes tables with output results, but does not present the underlying data. In contrast, the IRS’ valuation expert “provided a thorough review of his process and the academic papers that supported his equations.” Citing the lack of supporting data in the taxpayer’s expert report, the Court accepted the COEC rate concluded by the IRS’ valuation expert.
Of particular interest is the issue of company-specific risk premium. The taxpayer’s expert added a CSRP of 5% to the build-up analysis, while the IRS’ valuation expert applied a 0% premium. In discussing the company-specific risk premium, the Court acknowledged that the build-up method allows for the consideration of such risks, but expressed concern that such risk factors may already be accounted for in other elements of the build-up approach (such as the size premium). Ultimately, the Court did not accept the premium applied by the taxpayer’s expert, who had cited five risk factors he considered in arriving at his conclusion for the premium. The Court chided the taxpayer’s expert for failing to provide sufficient details to allow the Court to understand the derivation of the selected premium. The Court’s conclusion confirms the need to support the application of a company-specific risk premiums with reference to available market evidence and the overall reasonableness of the resulting conclusion of value.
Applicable Discounts
Both experts applied discounts for lack of control and lack of marketability in the valuation of the subject minority interests.
- With respect to the discount for lack of control, the experts differed in the approach used to determine the discount and its application. The Court adopted the taxpayer’s expert 5% discount which was based on analysis of the company’s operating agreement, capital market evidence, and consideration of relevant facts and circumstances. In contrast, the IRS’ valuation expert applied a 10% discount, but only to the non-operating assets of the business. In its rejection of the latter approach, the Court once again cited the lack of underlying supporting data and analysis.
- The experts applied similar (25% and 30%) discounts for lack of marketability supported by detailed explanations of their methodologies and conclusions. The Court found the methodology used by the taxpayer’s expert to be “slightly more persuasive.” The Court once more expressed concern that the IRS valuation expert relied on the 2017 Forecast. Of note, the Court’s finding in favor of the (lower) marketability discount proffered by taxpayer’s expert was actually adverse to the taxpayer’s overall position.
Conclusion
The material valuation issues in the Pierce case include the proper data to use in preparing a forecast, tax affecting pass-through earnings, and supporting appropriate risk factors and discounts to be applied in the valuation of closely held business interests.
The Court’s consideration of each issue underscores the importance of marshalling relevant data and presenting reasoned analysis in valuation reports.
All in the Family: X Corp. Merges with x.AI Corp.
Elon Musk Continues to Explore Corporate Governance and Fairness Boundaries
This presentation explores the fairness and corporate governance issues surrounding the March 2025 merger of x.AI Corporation and X Corporation, both controlled by Elon Musk. With a combined enterprise value of $125 billion, the stock-for-stock transaction raises questions about valuation methodology, board independence, conflicts of interest, and procedural rigor. Drawing comparisons to Musk’s past deals—such as Tesla’s acquisition of SolarCity and the leveraged buyout of Twitter—the analysis examines whether this latest “all in the family” merger meets the standards of fairness typically expected in transactions involving controlling shareholders.
Dividends and Shareholder Returns – A Ten-Year Lookback
Morningstar recently reported, given volatility in the equity markets, that U.S. equity funds and ETFs took in a relatively modest $5.7 billion in March 2025, of which $5.6 billion flowed into dividend growth funds. This investor preference for dividends caused us to reevaluate the role of dividends in bank shareholder returns.
An investor’s total return is a function of three variables:
- The stock price change over the holding period
- The cumulative dividends received
- The return on reinvested dividends. The market convention is that a dividend payment is reinvested in the issuer’s common stock. If the issuer’s common stock price increases after receipt of the dividend, this appreciation in value of the reinvested dividend will enhance the shareholder’s total return.
To simplify this analysis, we do not consider taxes.
A Middling Decade
In a period marked by moderate share price appreciation, dividends become a crucial component of shareholders’ total returns. As indicated in Table 1 below, the group of publicly traded banks generated a median total return of 114% over the 2014 to 2024 period, or a 7.9% annualized return. For the median bank, stock price appreciation was 59%, implying that the remainder of the median bank’s 114% total return came from dividends and the return on reinvested dividends.
Returns were rather pedestrian for several reasons.
- The median compound annual growth rate in earnings per share and tangible book value per share, excluding accumulated other comprehensive income, was about 7% over the 2014 to 2024 period. The impact of higher interest rates continues to weigh on banks’ earnings and, therefore, book value growth.
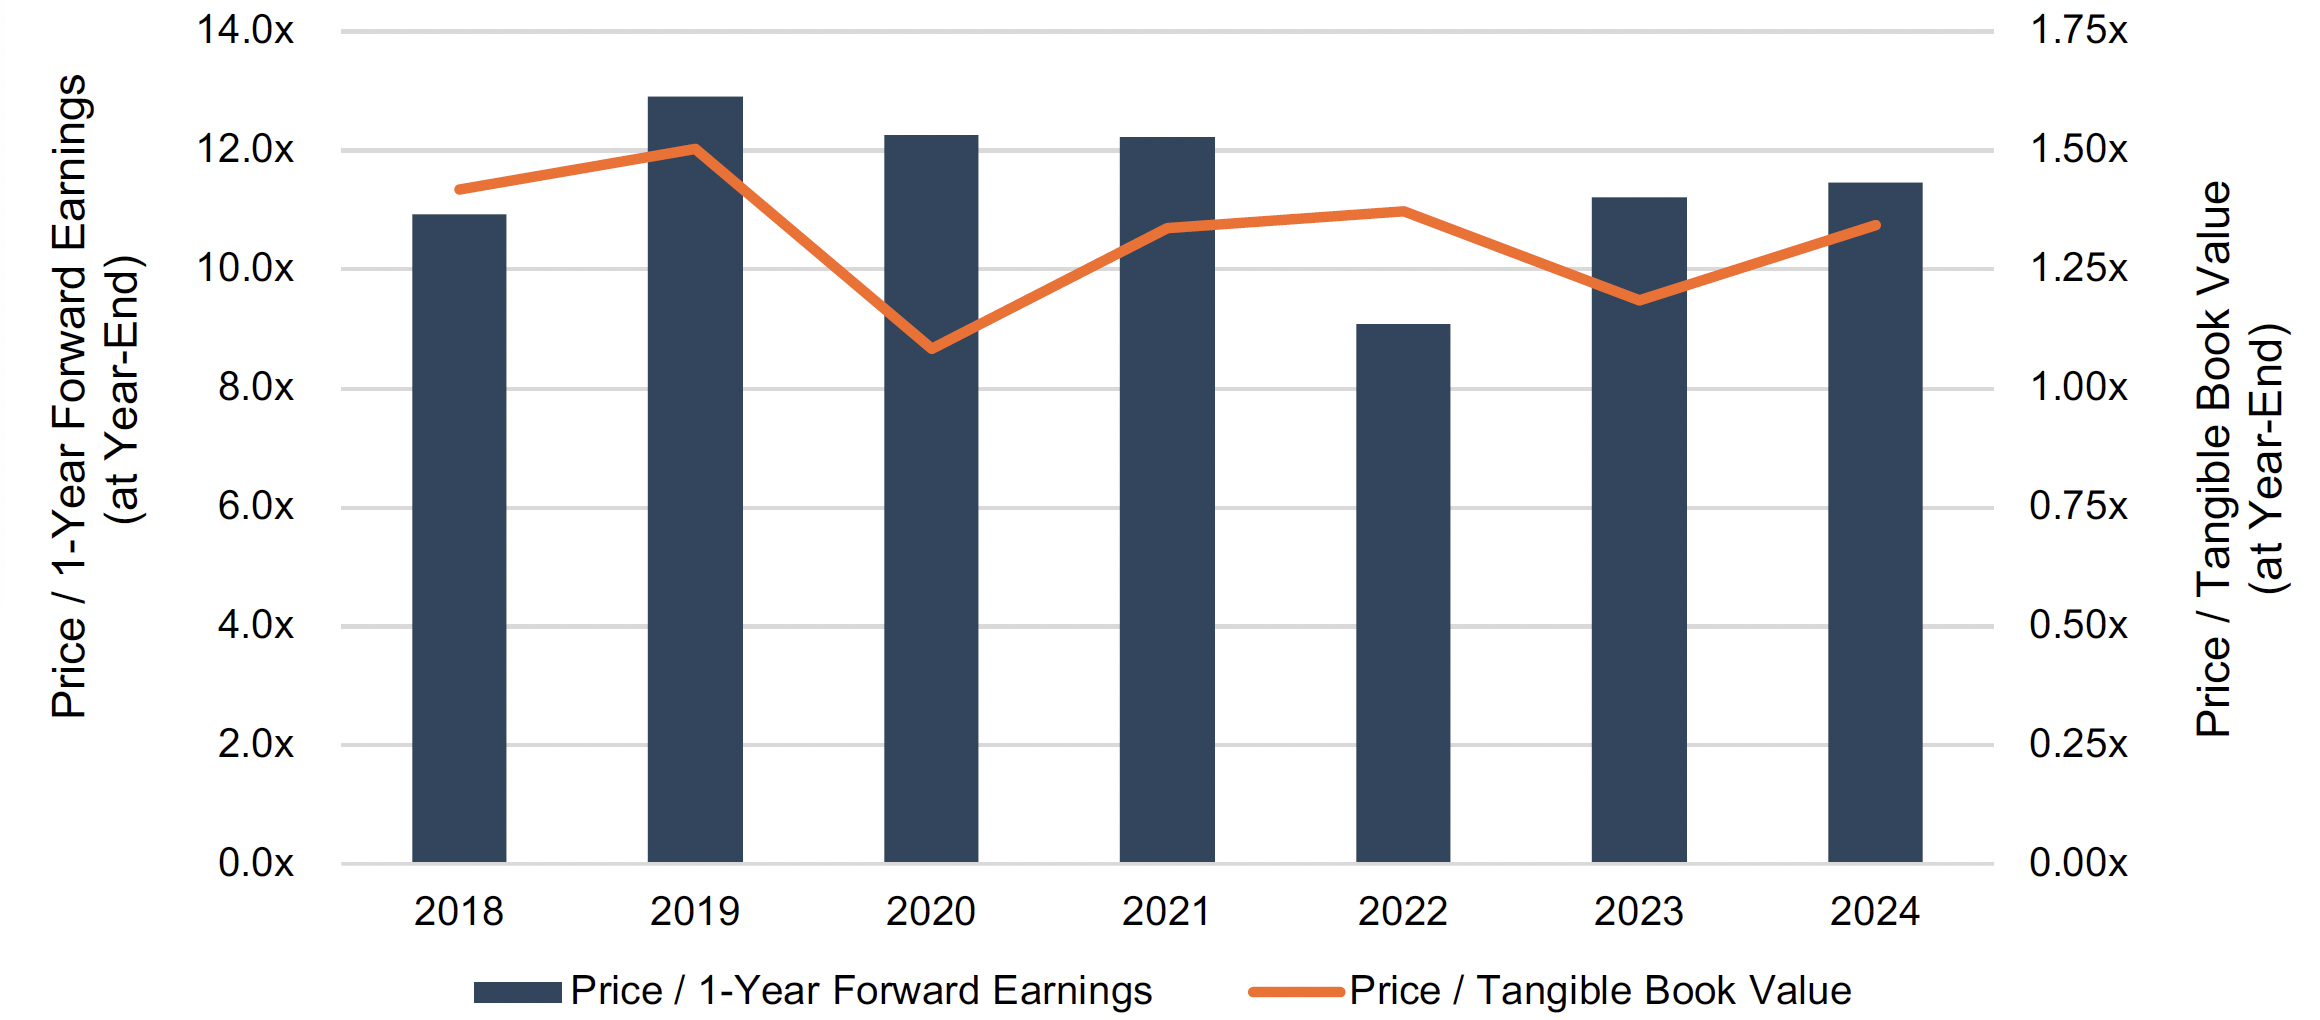
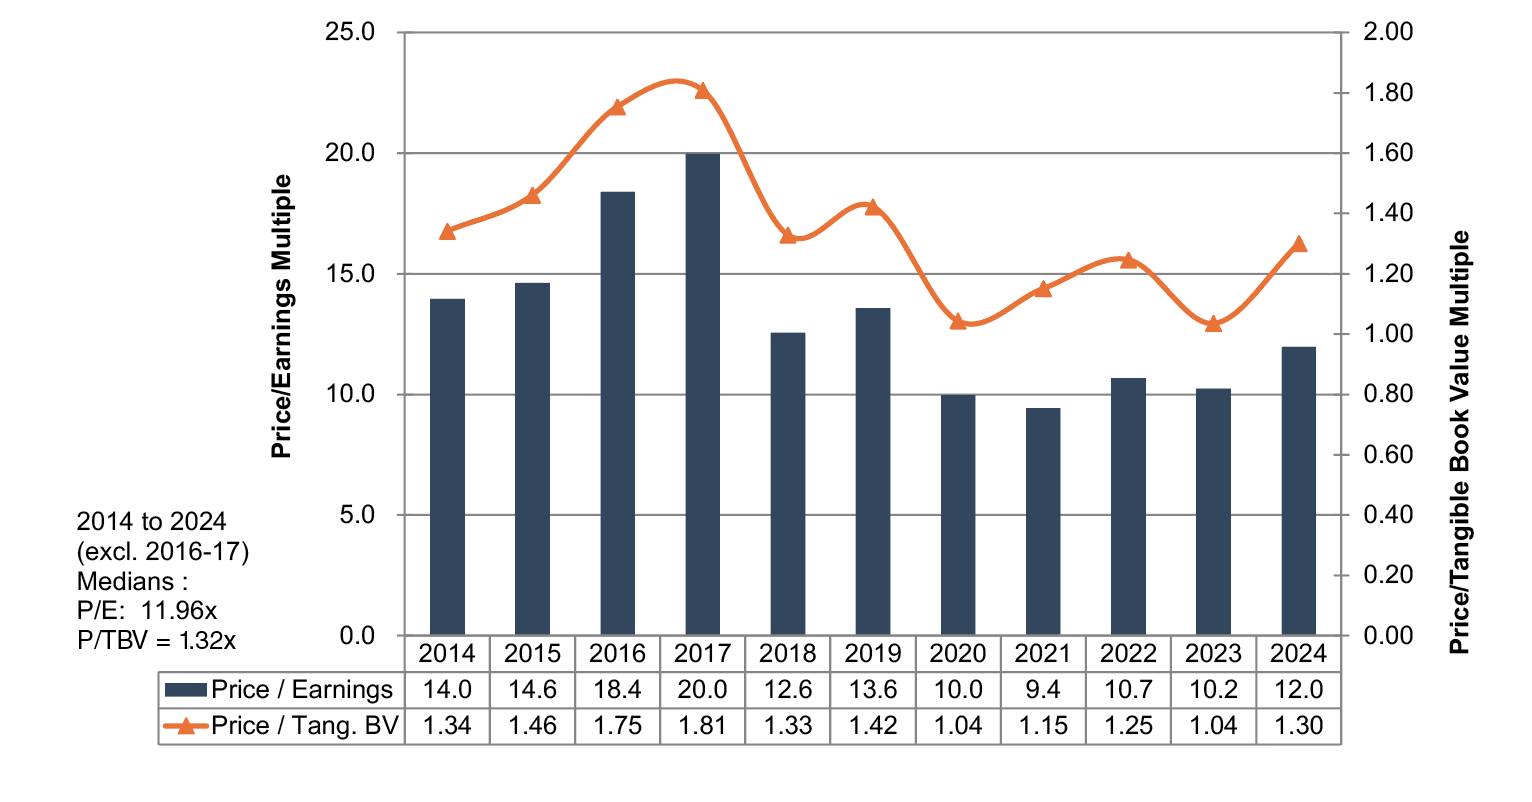
- Multiple compression also weighed on returns. As shown in the chart below, price/earnings multiples compressed between 2014 and 2024, while price/tangible book value multiples would have fallen to a greater extent absent the unrealized losses existing on securities portfolios.
Price/Earnings and Price/Tangible Book Value Multiples
Banks with Assets of $1 – $3 Billion & Return on Tang. Equity 7.5% – 15%
Dividends Make a Difference
In a period marked by moderate share price appreciation, dividends become a crucial component of shareholders’ total returns. As indicated in Table 1 below, the group of publicly traded banks generated a median total return of 114% over the 2014 to 2024 period, or a 7.9% annualized return. For the median bank, stock price appreciation accounted for 59% of investors’ total return, implying that the remainder came from dividends and the return on reinvested dividends.
Table 1
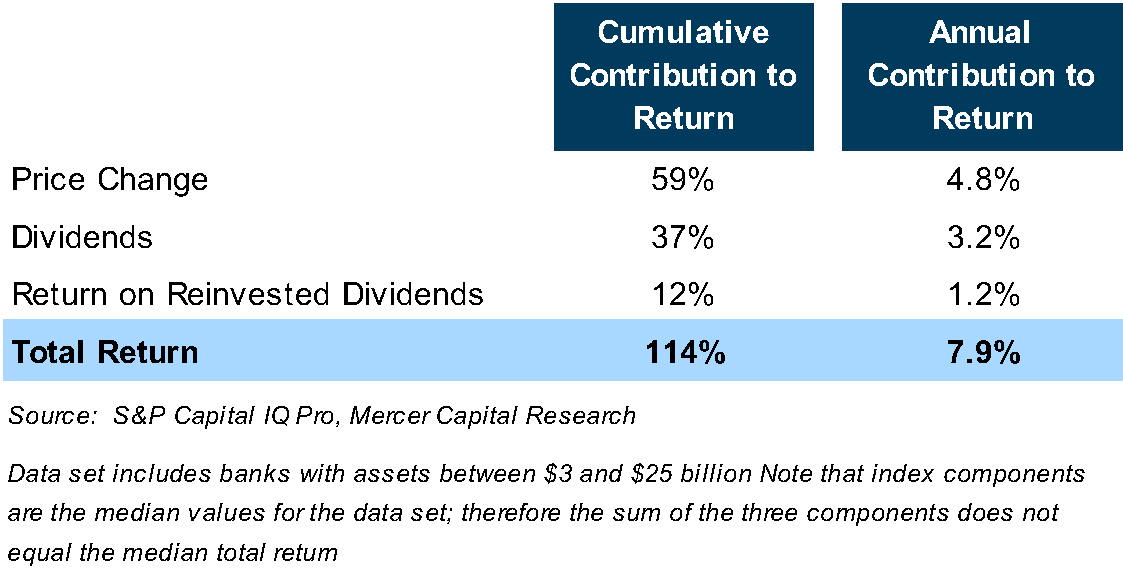
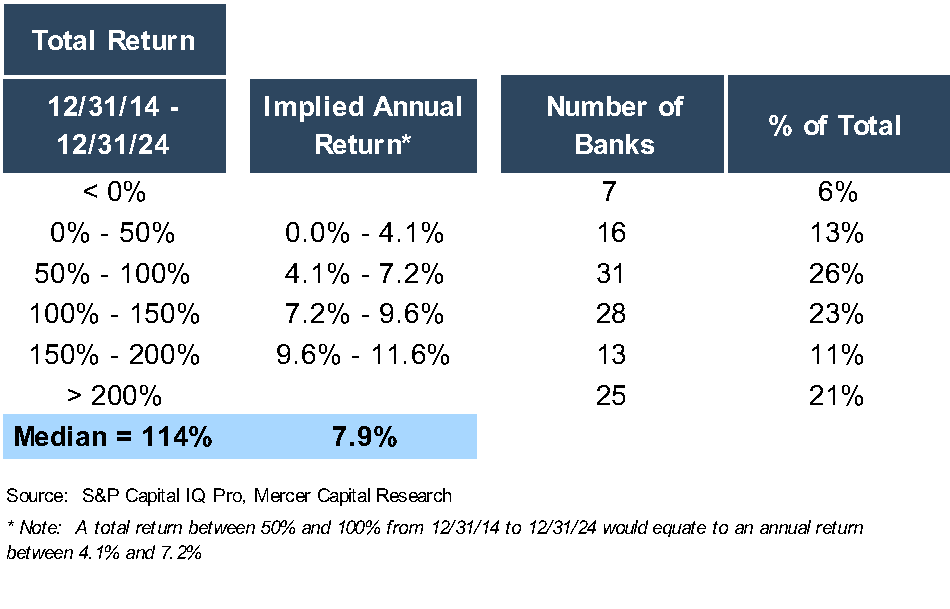
Table 2 stratifies the 120 banks included in the analysis by their total return. Almost one-half of the banks reported a total return between 50% and 150% over the 2014 to 2024 period, which equates to a mid to high single-digit annual return.
Table 2
Implications
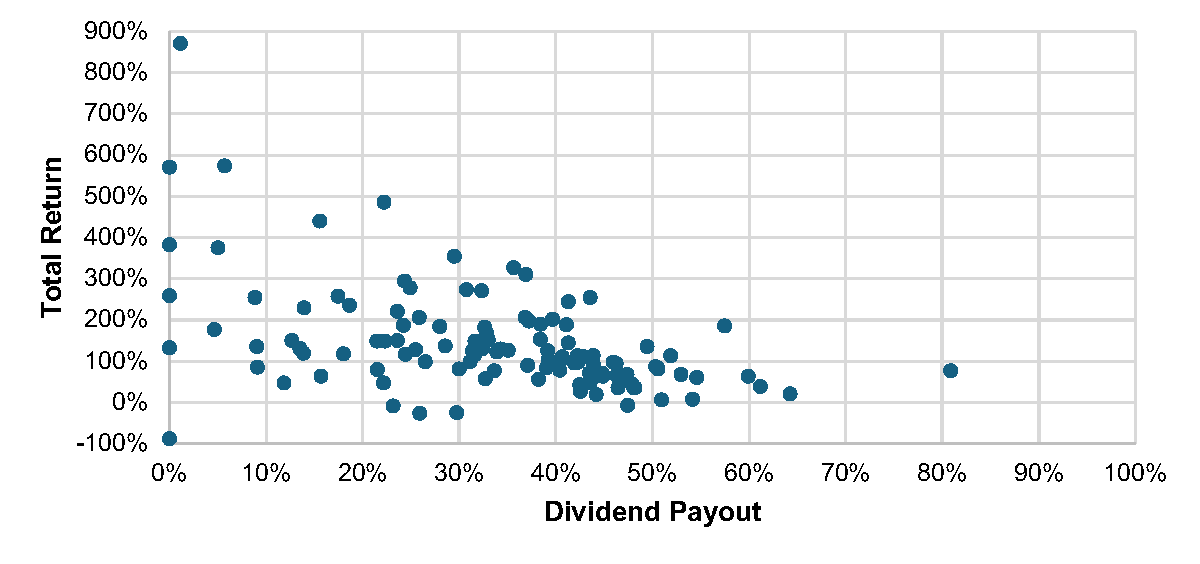
Does the impact of dividends on shareholder returns mean that bank management teams should immediately increase dividend payouts? Not necessarily, as markets reward growth in per share earnings and book value. Table 3 suggests that shareholder returns are negatively correlated with dividend payouts; that is, banks with the highest dividend payouts report the lowest shareholder returns. It is difficult to draw firm conclusions, though, as few banks in the analysis pay dividends of 0% or greater than 50%.
Table 3
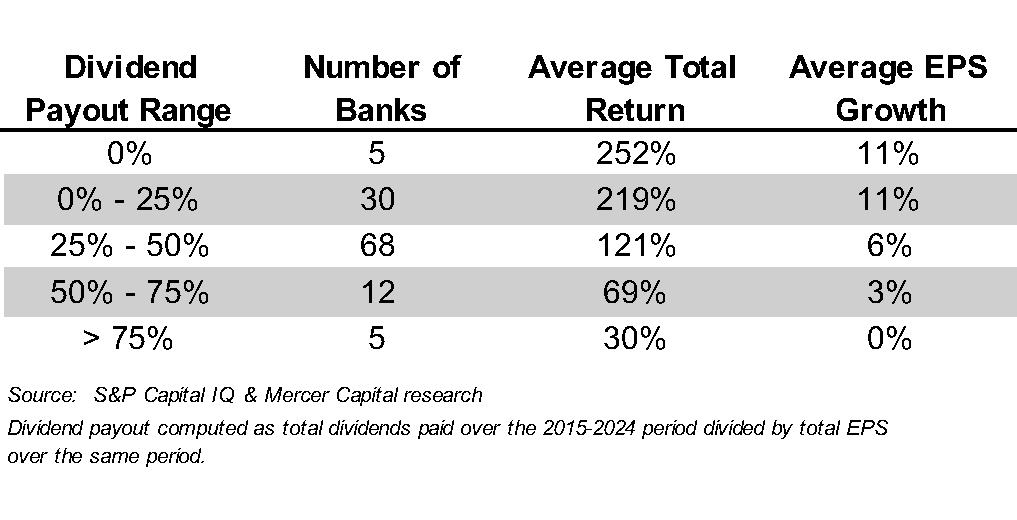
Figure 1 below compares dividend payout ratios and shareholder returns. The scatter plot suggests another factor influencing shareholder return: risk. Banks with low dividend payouts report widely dispersed returns, but returns tend to be more clustered for banks with dividend payouts in the 30% to 50% range. Dividend payout ratios are one way to estimate the potential volatility—and therefore the risk—of an investment, and investors want higher returns for assuming more risk.
Figure 1
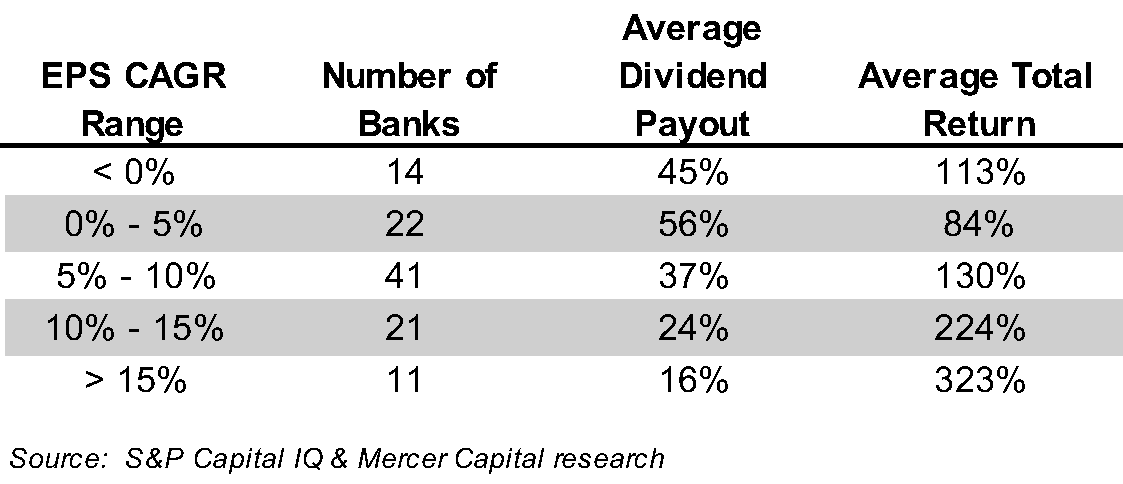
The relationship between shareholder returns and dividend payouts makes sense, as banks with high payouts often have fewer organic growth opportunities and, therefore lower EPS growth. Table 4 stratifies the data set by compound annual growth in EPS over the 2014 to 2024 period, whereby banks with the lowest EPS growth have the highest dividend payout ratios (and lower shareholder returns).
Table 4
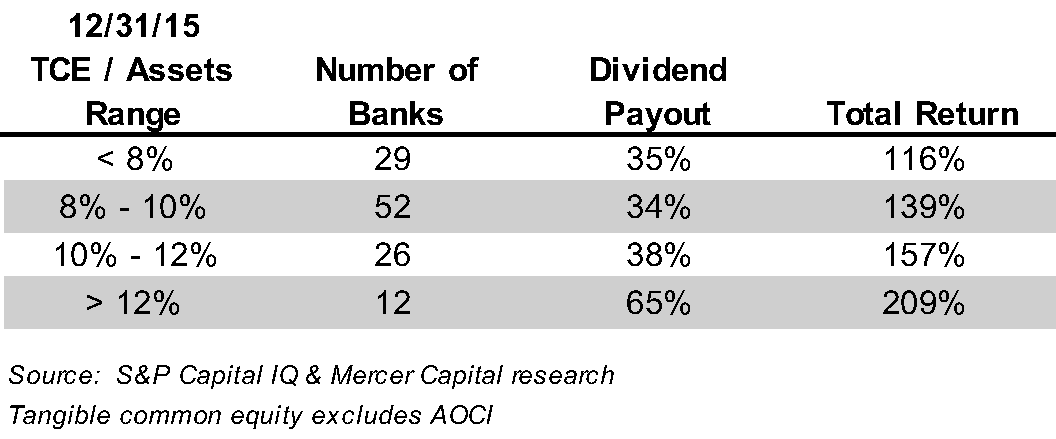
We also evaluated the relationship between the tangible common equity/assets ratio and dividend payouts. One may expect that banks with lower TCE/asset ratios have lower dividend payout ratios, but the data does not support this expectation. We note, though, that banks with excess capital, defined as TCE/asset ratios over 12%, tend to maintain higher dividend payout ratios. These banks can offer a relatively high payout, as well as maintain dry powder for opportunistic initiatives.
Table 5
Conclusions
The analysis shows that dividends, while an important component of shareholder returns, do not necessarily drive shareholder returns. Our analysis includes 120 banks, and 60 have dividend payout ratios between 30% and 50%. With dividend payout ratios clustered in a relatively tight range, it is difficult to make fine distinctions about dividend policies and shareholder returns. The implication is not that a bank with low EPS growth likely will enhance its shareholder returns by reducing its dividend payout ratio.
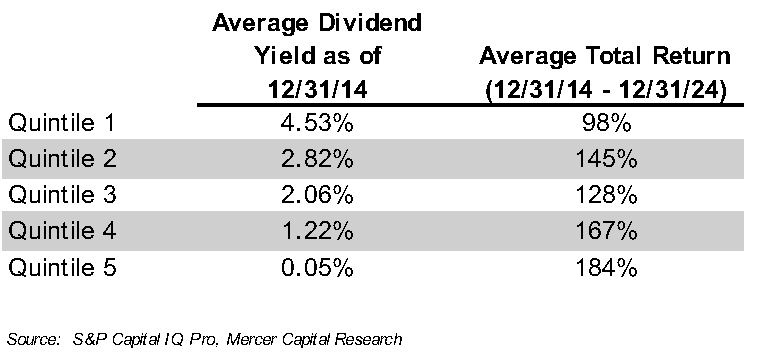
Over a long period, we know that shareholder value is created by growing earnings per share, which leads to rising tangible book value per share. Earnings also enable the dividend policy. Most banks have recognized, though, that they can both invest in growth opportunities and provide immediate return to shareholders through dividends. In challenging market environments, as occurred over the last ten years, this capital management strategy provides a material source of shareholder return.
While BankWatch does not make investment recommendations, we noted a recent article in the Wall Street Journal regarding dividend investing. It proposed, with some historical support, sorting the S&P 500 into quintiles by dividend yield. The research suggests that the quintile with the highest dividend yield underperforms, as high yields often result from financial distress and suggest the risk of future dividend cuts. Rather, investors should invest in the quintile with the second highest dividend yield, which has been shown to outperform the S&P 500.
We replicated this investment strategy for our bank universe. We did find that banks with the highest dividend yields at year-end 2014 underperformed over the next ten years. However, we found no evidence that the second quintile outperformed
(Table 6).
Table 6
Mortgage Banking’s Next Chapter: Is a Recovery Taking Root?
A little over four years ago, we published a two-part series entitled Mortgage Banking Lagniappe (Lagniappe is the Cajun word for “bonus” or “a little extra”) as all-time lows in rates powered big mortgage earnings for banks and non-banks. Since then, a multi-year hangover has developed that causes us to ask: do rates have to fall materially for mortgage bank earnings to “normalize” and begin to contribute to bank earnings?
Figure 1, below, shows the level of and trends in key housing/mortgage data for 2024 and the Mortgage Banking Association’s (MBA) three-year forecast.
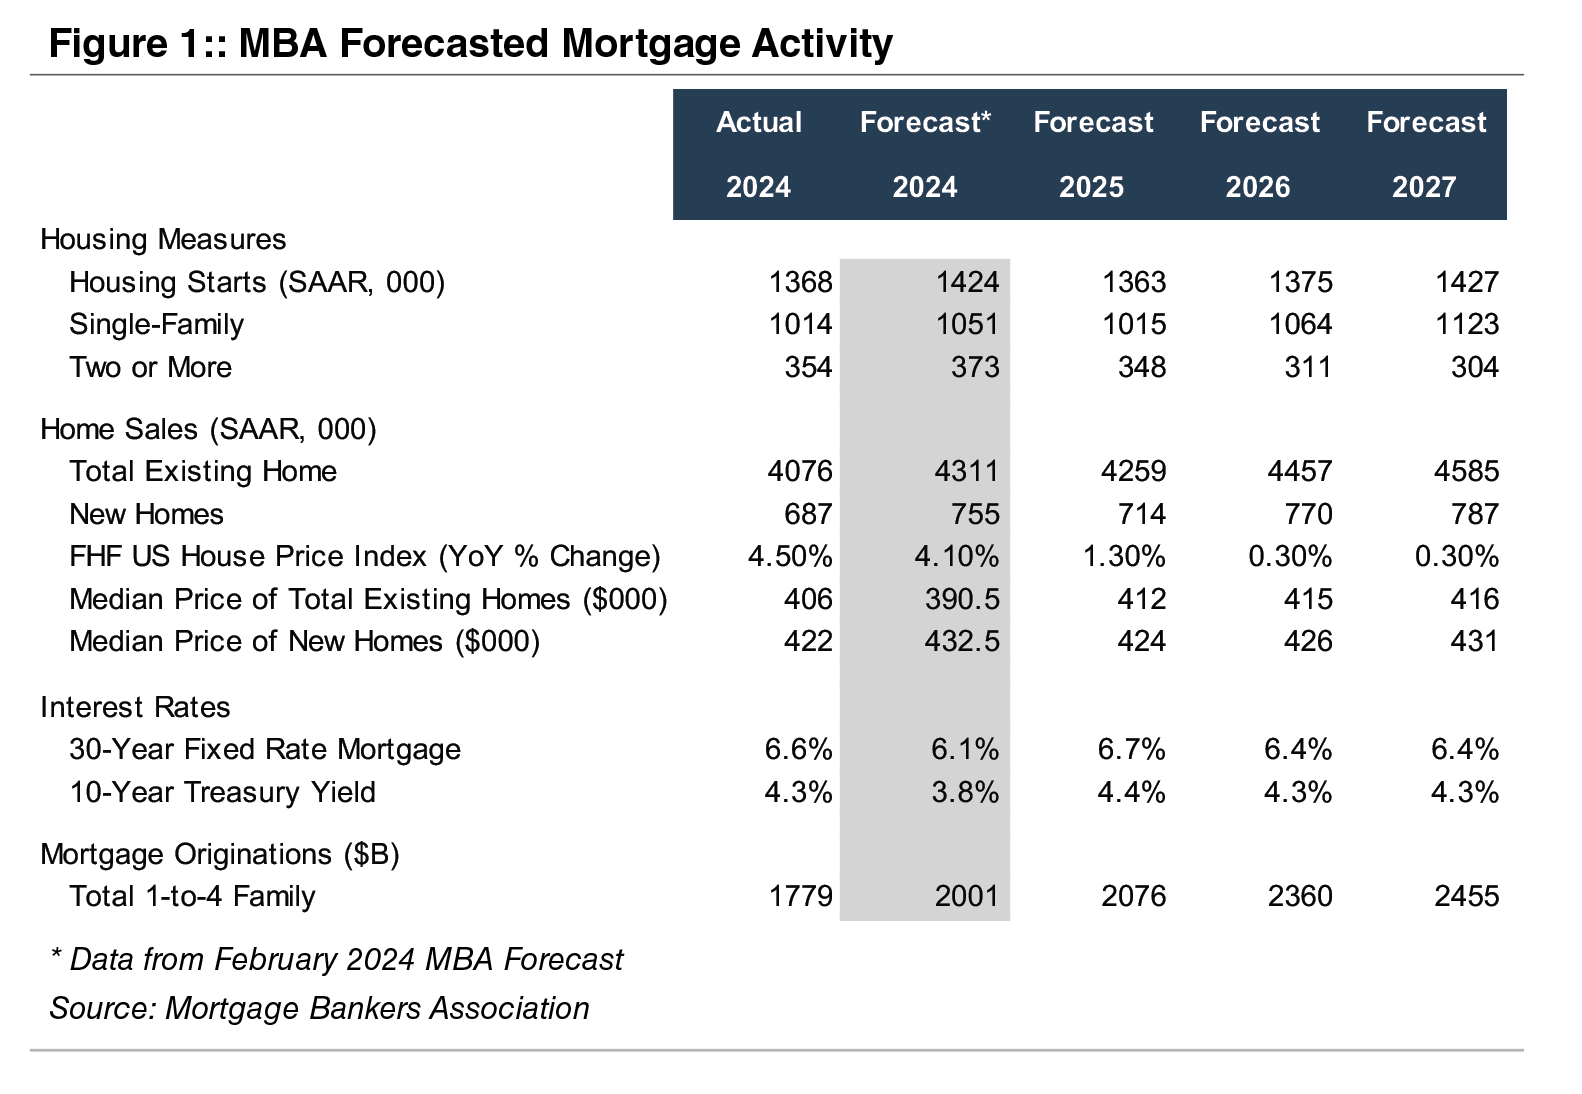
Like many forecasts, our observation of the MBA forecast tends to suffer from recency bias. Around year-end 2023, MBA’s forecast for 2024 projected a much stronger year than occurred because mortgage rates did not decline much even though the Fed cut its overnight policy rates by 100bps.
As a result, housing starts and sales of existing new homes were well below MBA’s forecast. However, the median price of existing homes was $406 thousand at year-end 2024, which equated to a 4.5% increase from the year prior and exceeded the 4.1% forecast increase.
Although inventories of unsold homes are increasing and in some areas are surging, MBA expects home prices to increase modestly in the coming three-year period as mortgage rates are projected to remain in the mid-6 range for a 30-year mortgage. By 2027, home sales are expected to be 12% above 2024 reported figures while mortgage volume is expected to increase nearly 40% as the refi-share picks up. If that comes to pass, mortgage banking earnings may transition to being accretive to commercial bank earnings.
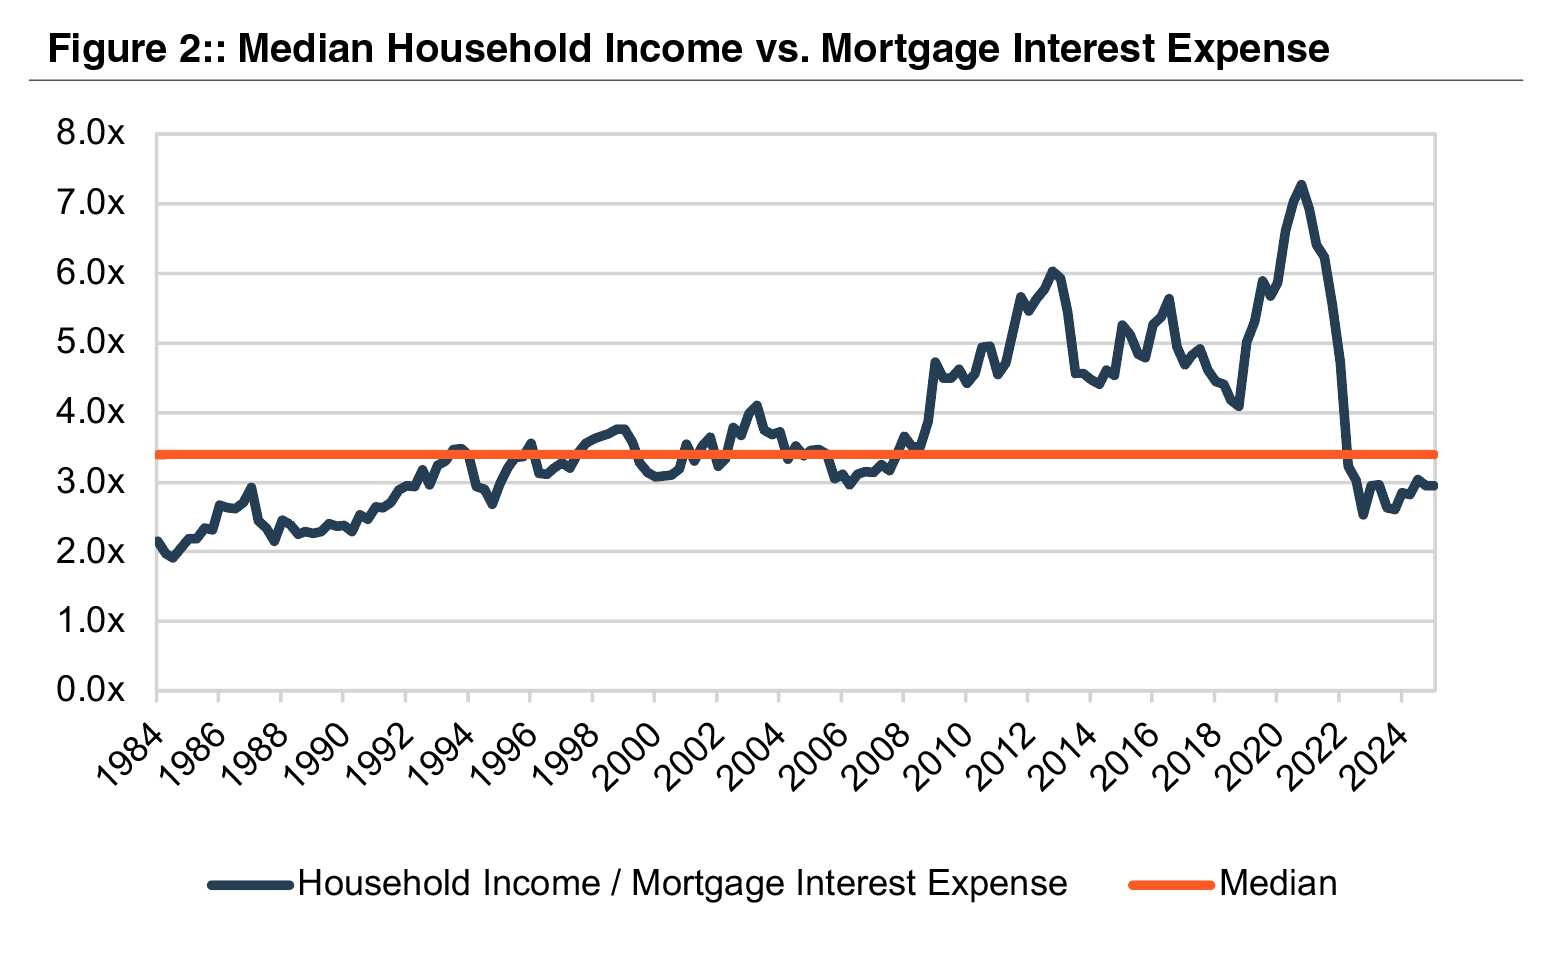
Mortgage rates were around 20% briefly in the early 1980s. Conversely houses were much cheaper. The analysis in Figure 2, on the next page, compares mortgage interest expense (using 30-year average mortgage rates and median U.S. transaction prices) to median household income, since the early 1980s.
As shown, housing was the most expensive at the beginning of this analysis when interest rates were in the mid-teens but trending lower. From 1984 to 1994, affordability improved as housing prices and income increased in-step but rates were nearly cut in half. From 1994 until the beginning of the GFC, relative affordability hugged the median (3.4x) as income and home prices, again, increased together while mortgage rates ranged from 6%-8%.
From the GFC until COVID, income growth outpaced the increase in housing prices while interest rates nearly halved, leading to improved affordability though post-GFC “reforms” made it more difficult to obtain a mortgage.
During COVID, the Fed engineered a sharp drop in long-term rates mortgage rates by buying over $2 trillion of Agency MBS. As a result, home prices skyrocketed but affordability as measured by household income as a multiple of mortgage interest expense rose to nearly 7x vs. a long-term average of 3.4x.
This was a bit of a mirage since 30-year mortgage rates for a while were below 3%; today it is around 6.5% after peaking near 8% in 2023. With normalization of rates since 2022, the household income-to-mortgage interest expense ratio has fallen back to near the long-term average of 3.4x yet housing is unaffordable for many.
So, it may take further increases in housing supply and a mild (or worse) recession to push mortgage rates lower and power a pick-up in mortgage refinancing and origination activity that would thereby drive better mortgage earnings. Some combinations of the following might work: rates down to the high 5s, housing prices decline 10-15%, or income increases 15-20%.
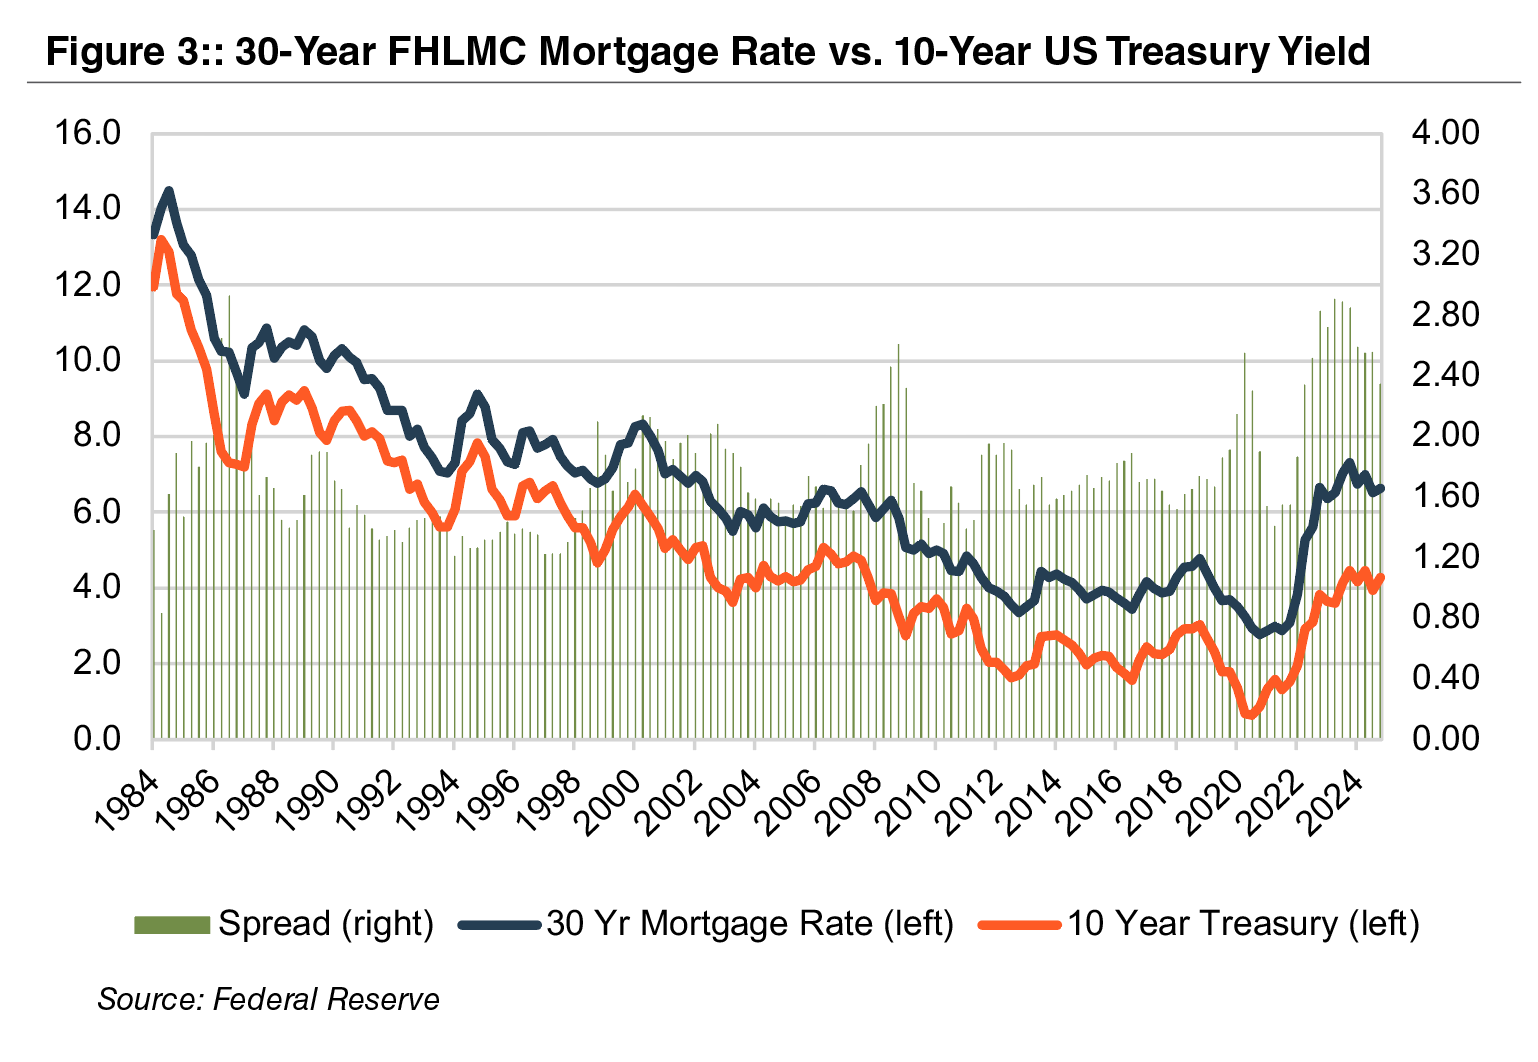
An additional technical factor in the market is working against an improvement in mortgage rates and therefore earnings derived from mortgage banking is the spread between the 10-year UST and mortgage rates.
During the past 40 years, the average spread was 175bps. Once the Fed engaged in “Quantitative Easing” in the post GFC years, the spread began to widen; however, it has gapped to around 250bps the past couple of years as MBS investors are concerned about the potential for the Fed to become an insensitive seller as it presumably needs to shrink its Agency MBS portfolio to make room for more USTs. A return to the 175bps spread average would, all else equal, cause mortgage rates to fall below 6%.
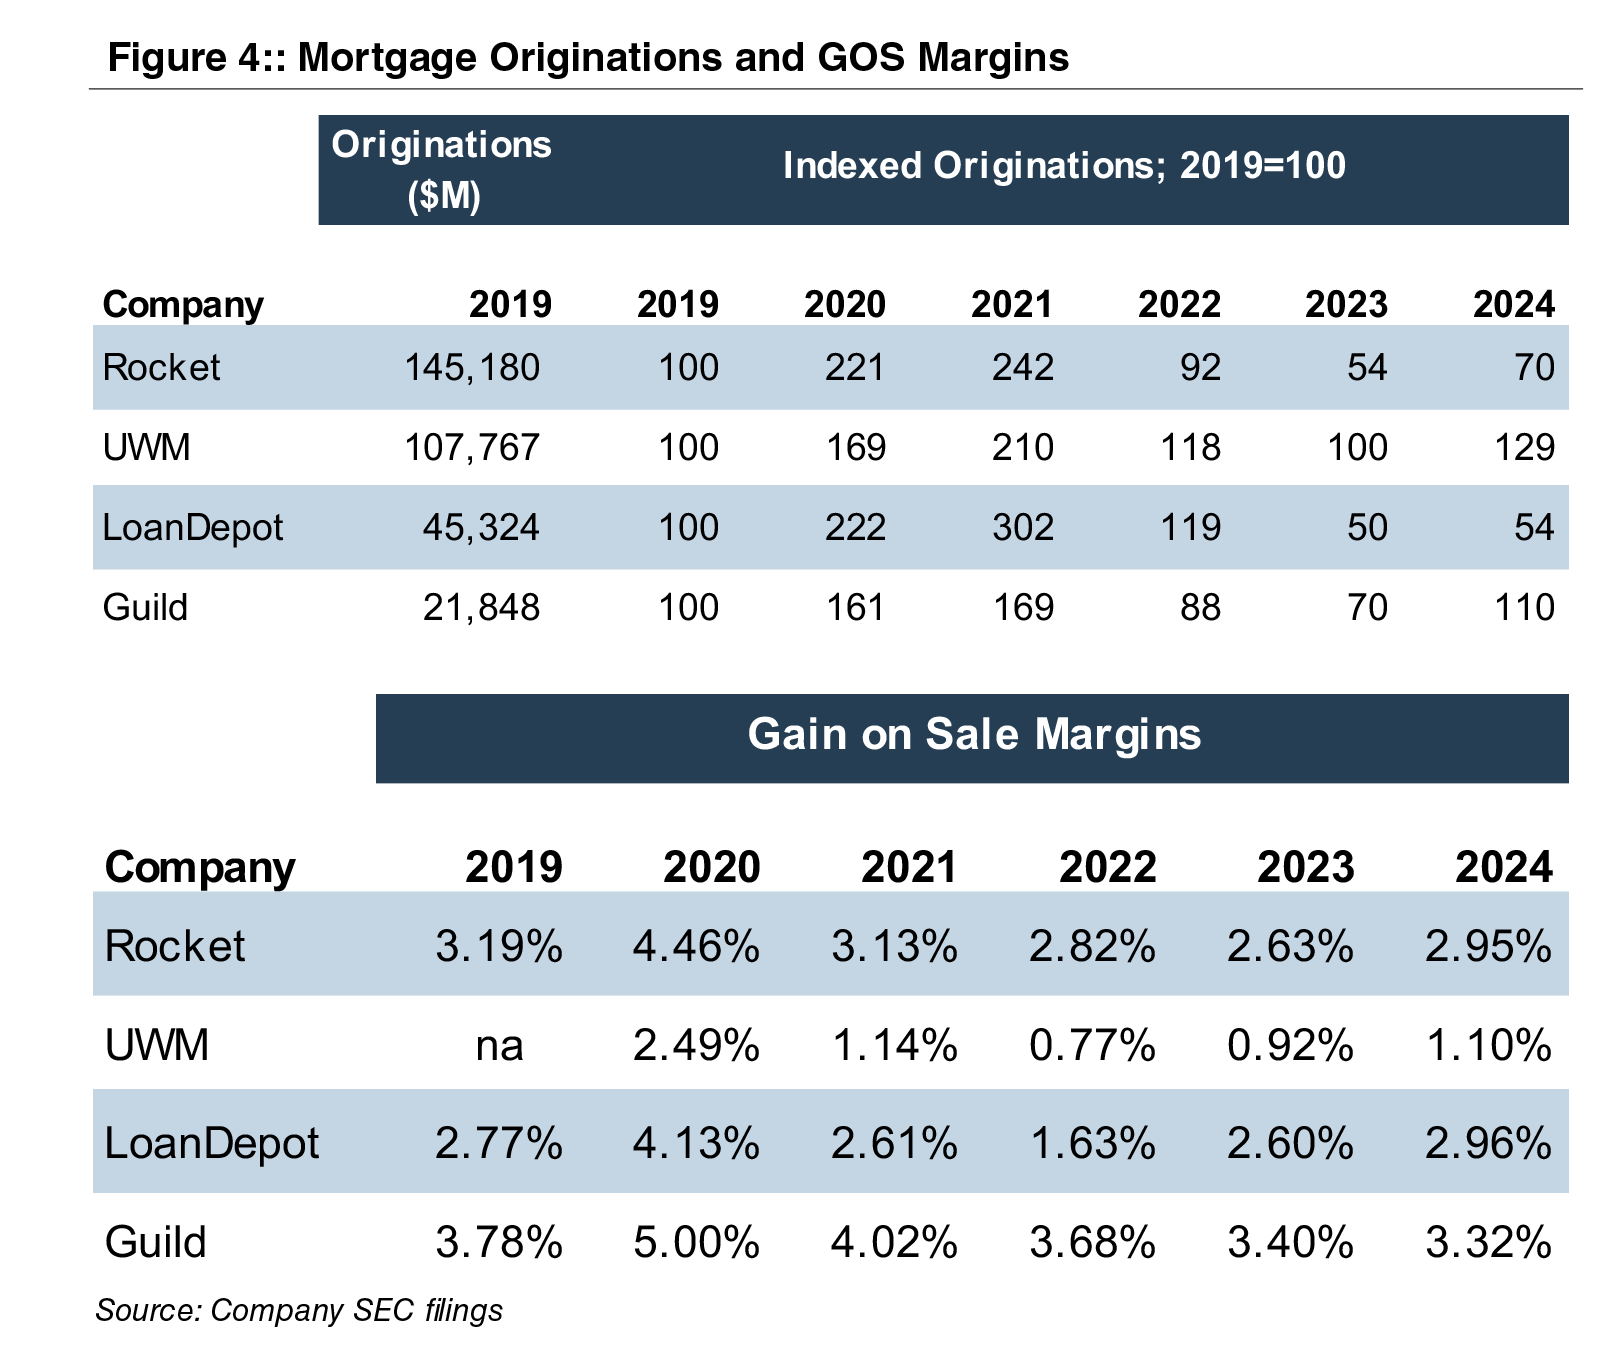
One result of the GFC reforms is that non-bank mortgage companies now originate the majority of residential mortgages. The data in Figure 4 succinctly summarizes the impact of falling and rising rates on origination volumes and gain on sale margins. Not shown is the share of originations that are refinancings, which, since 2022, when rates began to rise, are very low (and consumers switched to draws on HELOCS). Nonetheless, 2024 was somewhat better than 2023 when long-term rates peaked and 2025 may be somewhat better than 2024.
A vote of confidence in the future of mortgage banking has been registered by the largest originator, Rocket Companies, Inc. (NYSE:RKT). On March 10, 2025 RKT announced a $2.4 billion acquisition of Redfin Corporation (NASDAQ:RDFN), the online real estate brokerage business with 50 million monthly viewers. RKT then announced a $9.4 billion acquisition of Mr. Cooper Group Inc. (NASDAQ:COOP), bringing together the largest mortgage originator and servicer in the nation, on March 31. Consideration paid to both RDFN and COOP shareholders will consist solely of RKT common stock, which will result in about 25% ownership dilution to RKT shareholders.
The transaction may signal the bottom is in or maybe was put in 2023 with better times to come for mortgage banking and banks that have meaningful mortgage banking units.
Goodwill Impairment Troubles Cost UPS $45 Million
Executive Summary
A recent $45 million settlement between UPS and the SEC over allegedly flawed goodwill impairment tests and earnings overstatements puts a spotlight on the goodwill impairment testing process. Whether it be market volatility, uncertainty around tariffs, or simply poor performance at a reporting unit (as was the case for UPS), proper evaluation of goodwill impairment testing inputs is critical to getting the process and numbers right and potentially avoiding a fine. The impairment charge in this case may have been a non-cash item but the civil penalty was a real expense.
Summary of the Allegations and Settlement
In November 2024, the SEC announced settled charges and a civil penalty of $45 million against United Parcel Service, Inc. (UPS) for materially misrepresenting its earnings due to flawed goodwill impairment tests related to its UPS Freight reporting unit.
According to the SEC Order, UPS failed to share certain information with its external valuation consultant who prepared the goodwill impairment analyses in 2019 and 2020. When the unit was ultimately sold in early 2021, the sales price was far below the fair value used to support the goodwill. A timeline of key events and issues is summarized below:
- Mid-2019 – An internal UPS corporate strategy group worked with external financial advisors on a months-long process to evaluate whether to sell the underperforming Freight unit. This analysis concluded that the likely sales price for Freight would range from $350 million to $650 million. Meanwhile, the carrying value of the unit on the balance sheet was approximately $1.4 billion.
- July 1, 2019 Goodwill Impairment Test – The company’s annual testing date was July 1, with results of the assessment reported in its third quarter filing released on October 29, 2019. The SEC Order alleges that the assumptions used by the external valuation consultant (and approved by UPS management) differed substantially from those that market participants would use to value the business.
Specifically, the projections used for revenue and profit growth were “aggressive” and the selection of guideline public companies included companies that were “not comparable” to UPS. The resulting valuation from the external valuation consultant was approximately $2.0 billion. This was far higher than the corporate strategy group’s estimated range of $350 million to $650 million (which would have also resulted in a significant impairment charge). Notably, the corporate strategy group’s estimates and projections were not shared with the valuation consultant.
- June – October 2020 Sale Process – In June 2020, UPS began a process to sell its Freight business and soon began negotiations with a potential buyer. Internal documents again suggested that the sale price was unlikely to exceed $650 million. In September 2020, the prospective buyer made a non-binding offer to acquire the unit for between $750 and $800 million, subject to various adjustments which were anticipated to reduce the final net price. In October 2020, UPS and the buyer signed a non-binding term sheet to move forward with the transaction.
- July 1, 2020 Goodwill Impairment Test – The Company again conducted its annual impairment test with the assistance of the external valuation consultant. The SEC Order contends that UPS gave its consultant forecasts for the Freight unit that were inconsistent with how market participants would approach the business. Further, UPS did not share details regarding the proposed sale or existence of the signed term sheet with the consultant. The consultant ultimately valued the Freight unit at $2.0 billion relative to the carrying value of $1.3 billion.
On November 2, 2020, UPS released its third quarter 10-Q, noting that “there were no events or changes in circumstances during the third quarter of 2020 that would indicate the carrying amount of our goodwill may be impaired as of November 2, 2020.”
- Sale and Impairment – On November 3, 2020 (one day after filing its 10-Q for the third quarter), the Board of Directors authorized management to conclude a sale of the Freight unit on terms consistent with the term sheet. Management informed the board that it expected to incur a goodwill impairment charge on the order of $500 million upon closing of the transaction.
On January 25, 2021, UPS announced the sale of the Freight unit for $800 million, subject to working capital and other adjustments, which would result in a pre-tax impairment charge of approximately $500 million. The expected net sale price, after adjustments, was roughly $650 million. The impairment charge reduced net income for fiscal 2020 by 20%, and lowered balance sheet goodwill and shareholders’ equity by 13% and 32%, respectively.
According to the SEC Order, UPS made materially misleading disclosures in 2019 and 2020 regarding its financial reporting that were premised on its determination that no goodwill impairment charges were required for the Freight unit. Had UPS properly valued the Freight unit, its earnings and book value would have been materially lower.
In addition to the $45 million civil penalty, UPS (without admitting or denying the SEC’s findings), agreed to adopt training requirements for certain company individuals and retain an independent compliance consultant to review and make recommendations about the firm’s fair value estimates and disclosure obligations.
Implications and Takeaways
We’ve previously discussed the guidance for goodwill impairment testing under ASC 350 and best practices for conducting interim impairment tests. At a basic level, the financial projections and underlying fair value conclusion must reflect the expectations of market participants for the subject asset or reporting unit. But the UPS situation also illustrates a failure to follow the examples provided in the guidance when assessing events and circumstances that might make it more likely than not that an impairment condition exists. Specifically, entities should consider “changes in the carrying amount of assets at the reporting unit including the expectation of selling or disposing certain assets.”
The role of the external valuation consultant is to assist management in the preparation of a company’s financial statements for financial reporting. Obviously, no one wants to record an impairment charge, but withholding information from the valuation consultant or communicating misleading financial forecasts in the goodwill impairment testing process is not likely to end well. A non-cash impairment charge might sting, but not nearly as much as a $45 million cash settlement and other compliance penalties. This case is also a timely reminder for the valuation consultant assisting in an impairment test to ask – and management to answer, truthfully – whether the company is contemplating a sale of the subject reporting unit at the relevant measurement date(s).
Conclusion
The goodwill impairment testing process can be complex, particularly in times of market volatility and when certain business units have underperformed expectations. But the accounting guidance and valuation methodologies around fair value are well-established. The UPS case shows what can happen when the guidance and best practices are not followed.
The valuation specialists at Mercer Capital have experience in implementing both the qualitative and quantitative aspects of goodwill impairment testing under ASC 350 for public and private companies. If you have questions, please contact a member of Mercer Capital’s Financial Statement Reporting Group.
The Value of Carried Interest: A Guide for Matrimonial Litigation
Carried Interest Explained
What is carried interest? It is the profits interest that a private equity, venture capital, or hedge fund principal receives if the fund exceeds certain performance benchmarks. Carried interest can also be referred to as performance allocation, incentive allocation, or promote interest in the case of real estate funds. Separately, fund principals also receive income and potential distributions from management fees and direct investments in the fund.
Fund Structures and Carried Interest Allocation
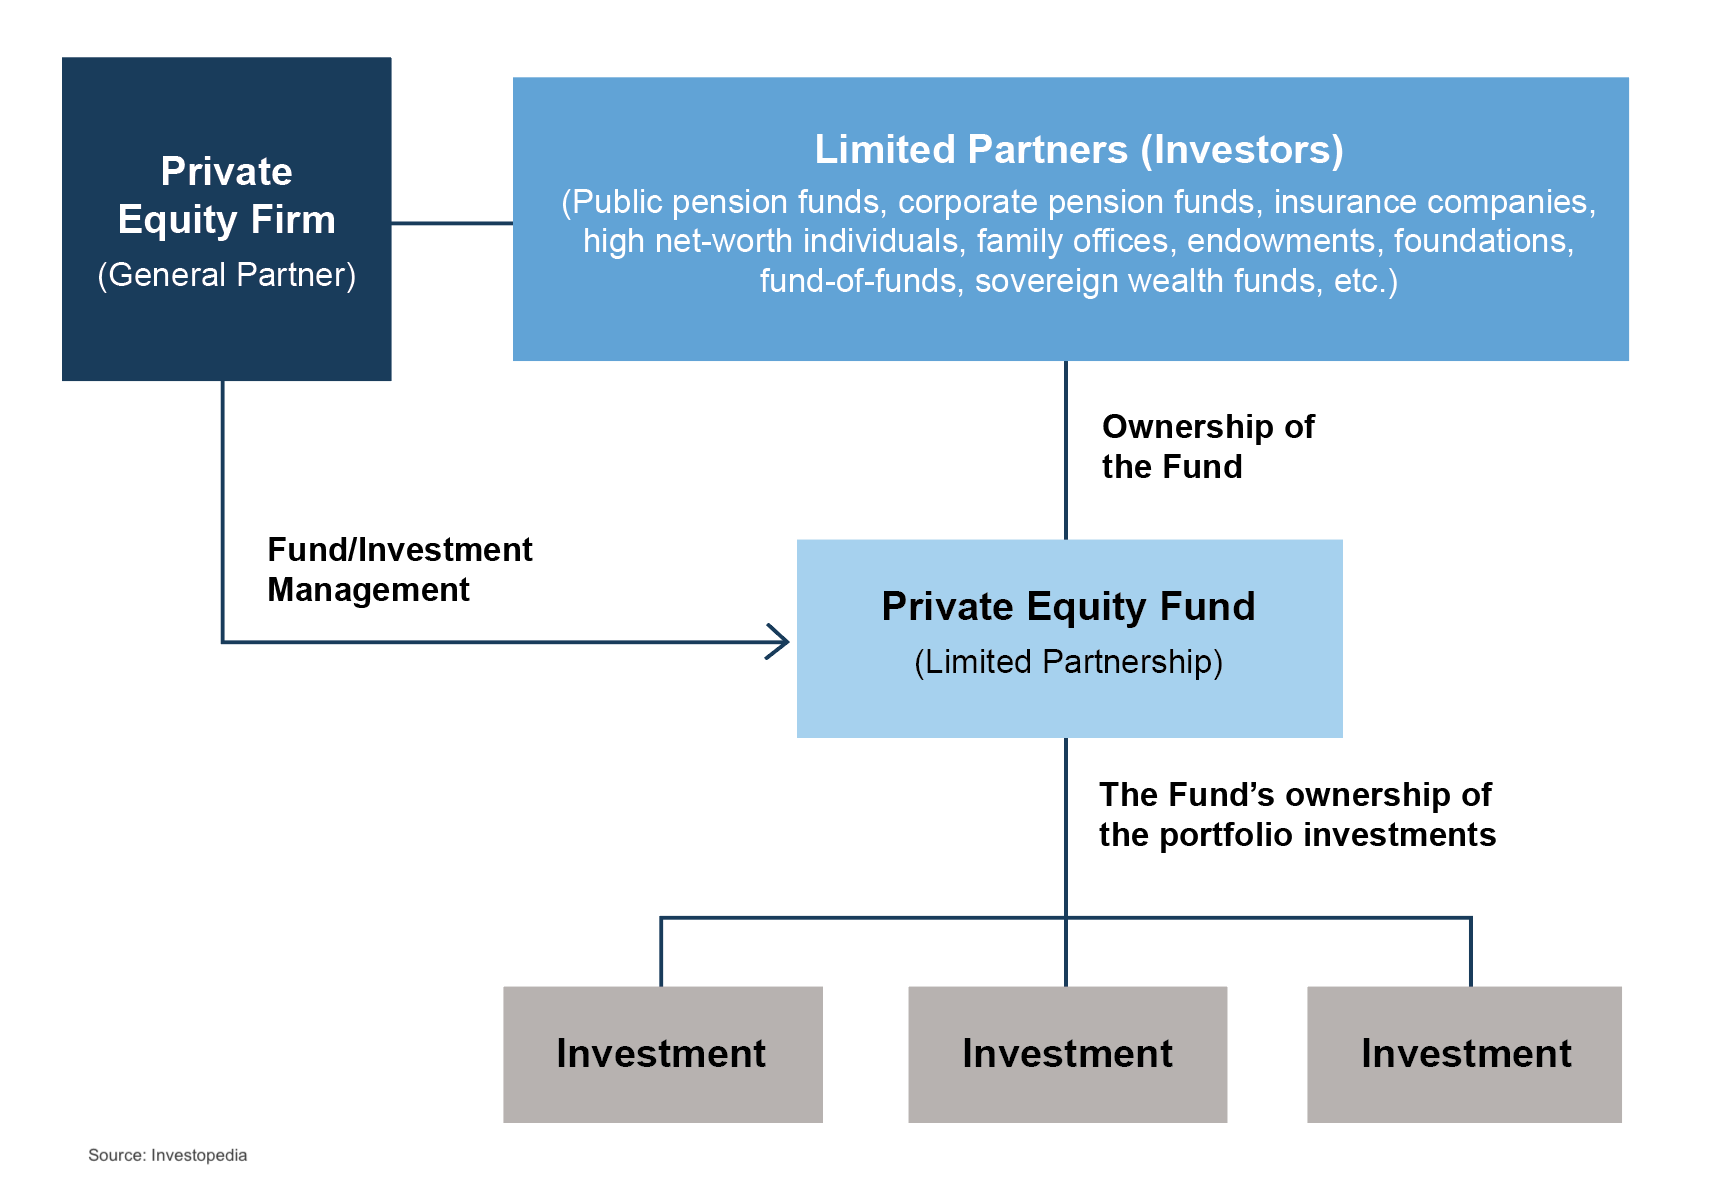
A basic private equity fund structure is shown below. Typically, the fund principals form a general partner entity and a management company entity. The principals then raise capital from limited partners and make investments over the term of the fund. The management company receives management fees, often around 2% per year, for investment management services provided. The general partner entity typically invests alongside the limited partners and would receive its pro-rata share of returns along with the limited partners. If the fund exceeds certain benchmarks, the general partner would also receive carried interest, often around 20% of fund returns beyond the benchmark.
It is important to note that private equity fund structures come in many forms, from basic to complex. Even though this article is focused primarily on private equity funds, similar concepts apply to certain hedge funds and venture capital funds.
Navigating Uncertainty and Valuation Challenges
Uncertainty exists regarding the fund’s performance, typically more so earlier in the fund’s life. When the fund entities are formed, and before capital is raised, there is also uncertainty regarding how much capital will be raised. These uncertainties result in lower values for the fund entities at inception. The fund entity values will increase throughout the life of the fund if the fund is able to successfully raise capital and achieve investment returns beyond the benchmark to generate carried interest cash flows.
At inception, the values of the fund entities will be relatively low, particularly the value of potential carried interest. As the fund raises capital and then begins to make investments, the values of the fund entities will change, potentially significantly.
Challenges in Valuing Interests in Fund Entities
A appraisal prepared by a qualified appraiser with prerequisite experience is paramount when determining the value of fund entity interests given the complexity involved. In addition to fund structure, other items that require appraiser familiarity with carried interest include the following:
- Fundraising: For new funds, what is the fund’s target size? And will the fund offer special terms for early investors or for a large “anchor” investor? For funds already operating, how much capital has been raised and how much additional capital does the fund expect to raise? And are there different classes of investors with different terms?
- Fund investment strategy: For new funds, what types of investments will the fund make in terms of asset classes, industries, size of interests, number of investments, etc.? How will the fund’s investments shape expected returns for the fund? What is the expected holding period for the fund’s investments? Will capital from the sales of investments be reinvested? Will the fund use leverage? And for funds already operating, what types of investments does the fund hold? What have the returns been to date? What is the outlook for the fund’s investments in terms of future returns and remaining holding periods?
- Fund terms: How is the management fee calculated and how often will it be assessed? Who will pay for fund expenses? Is there a general partner catch-up after the hurdle is reached? Are distributions made on a deal-by-deal basis, or on a cumulative basis? Can the general partner waive management fees associated with their direct investments in the fund? And for funds already operating, has any carried interest been accrued yet?
Funds already operating can be more complicated to value than new funds. In addition to understanding all of these items, the fund’s performance to date has to be reconciled with expectations going forward.
TIP: For new funds, the Private Placement Memorandum will typically be a good starting point to answer many of these questions. Additionally, governing documents for the limited partnership, the general partnership, the management company, and any other entities related to the fund will be useful. For existing funds, financial statements for each of the entities are needed to value the entities, in addition to the information needed for new funds.
Conclusion
In conclusion, valuing fund entities, including carried interest, in newly formed or existing funds requires a complex and thorough analysis. It is essential to work with qualified appraisers familiar with the complexities of fund structures, tax regulations, and local matrimonial law statutes to ensure optimal outcomes. Engaging with experienced advisors can increase the likelihood of an equitable outcome in divorce.
The professionals at Mercer Capital have experience in the valuation of carried interests. For more information or to discuss a valuation issue, feel free to contact us.
Medical Device Industry Outlook – Five Long-Term Trends to Watch
Medical Devices Overview
The medical device manufacturing industry produces equipment designed to diagnose and treat patients. Medical devices range from simple tongue depressors and bandages to complex programmable pacemakers and sophisticated imaging systems. Major product categories include surgical implants and instruments, medical supplies, electro-medical equipment, in-vitro diagnostic equipment and reagents, irradiation apparatuses, and dental goods.
The following outlines five structural factors and trends that influence demand and supply of medical devices and related procedures.
1. Demographics
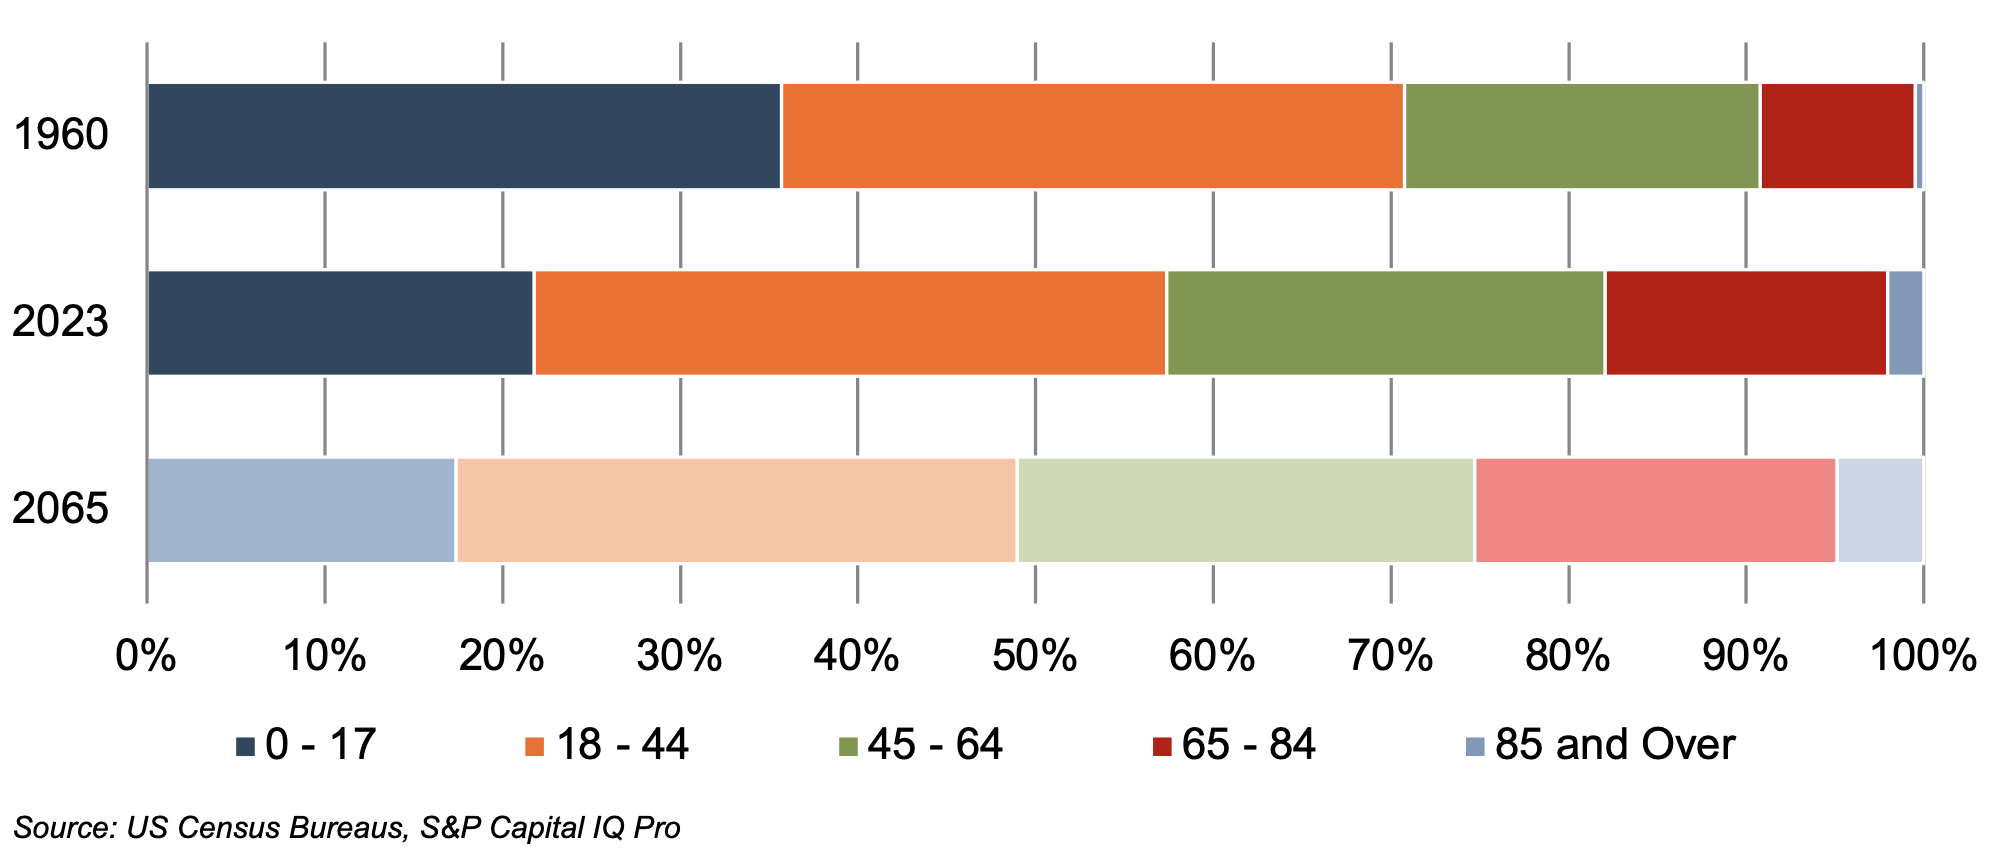
The aging population, driven by declining fertility rates and increasing life expectancy, represents a major demand driver for medical devices. The U.S. elderly population (persons aged 65 and above) totaled 60.0 million in 2023 (18% of the population). The U.S. Census Bureau estimates that the elderly will number 92.7 million by 2065, representing more than 25% of the total population.
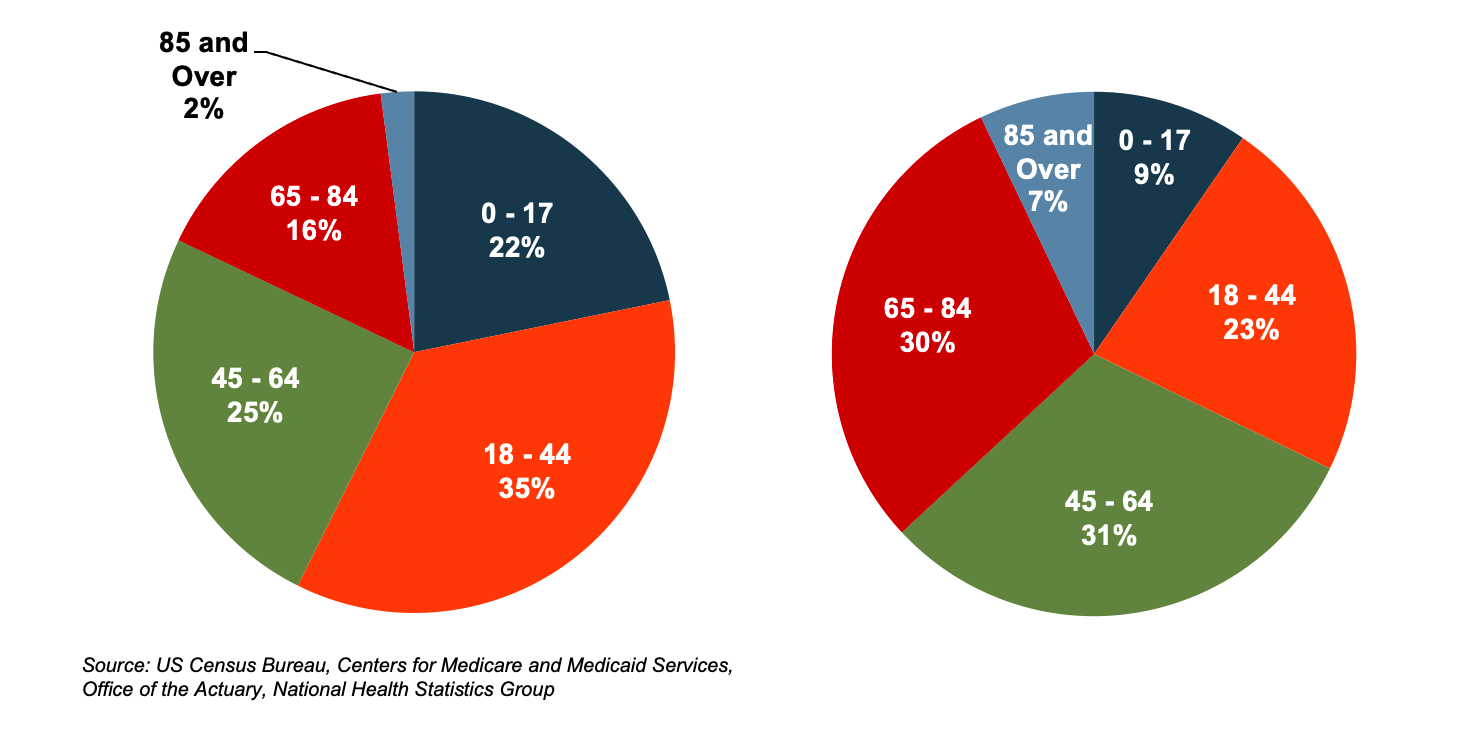
The elderly account for nearly one third of total healthcare consumption in the U.S. Personal healthcare spending for the population segment was approximately $22,000 per person in 2020, 5.5 times the spending per child (about $4,000) and more than double the spending per working-age person (about $9,000).
U.S. Population Distribution by Age Group
(Left) U.S. Population Distribution by Age Group
(Right) U.S. Healthcare Cost Distribution by Age Group
World Population 65 and Over (% of Total)
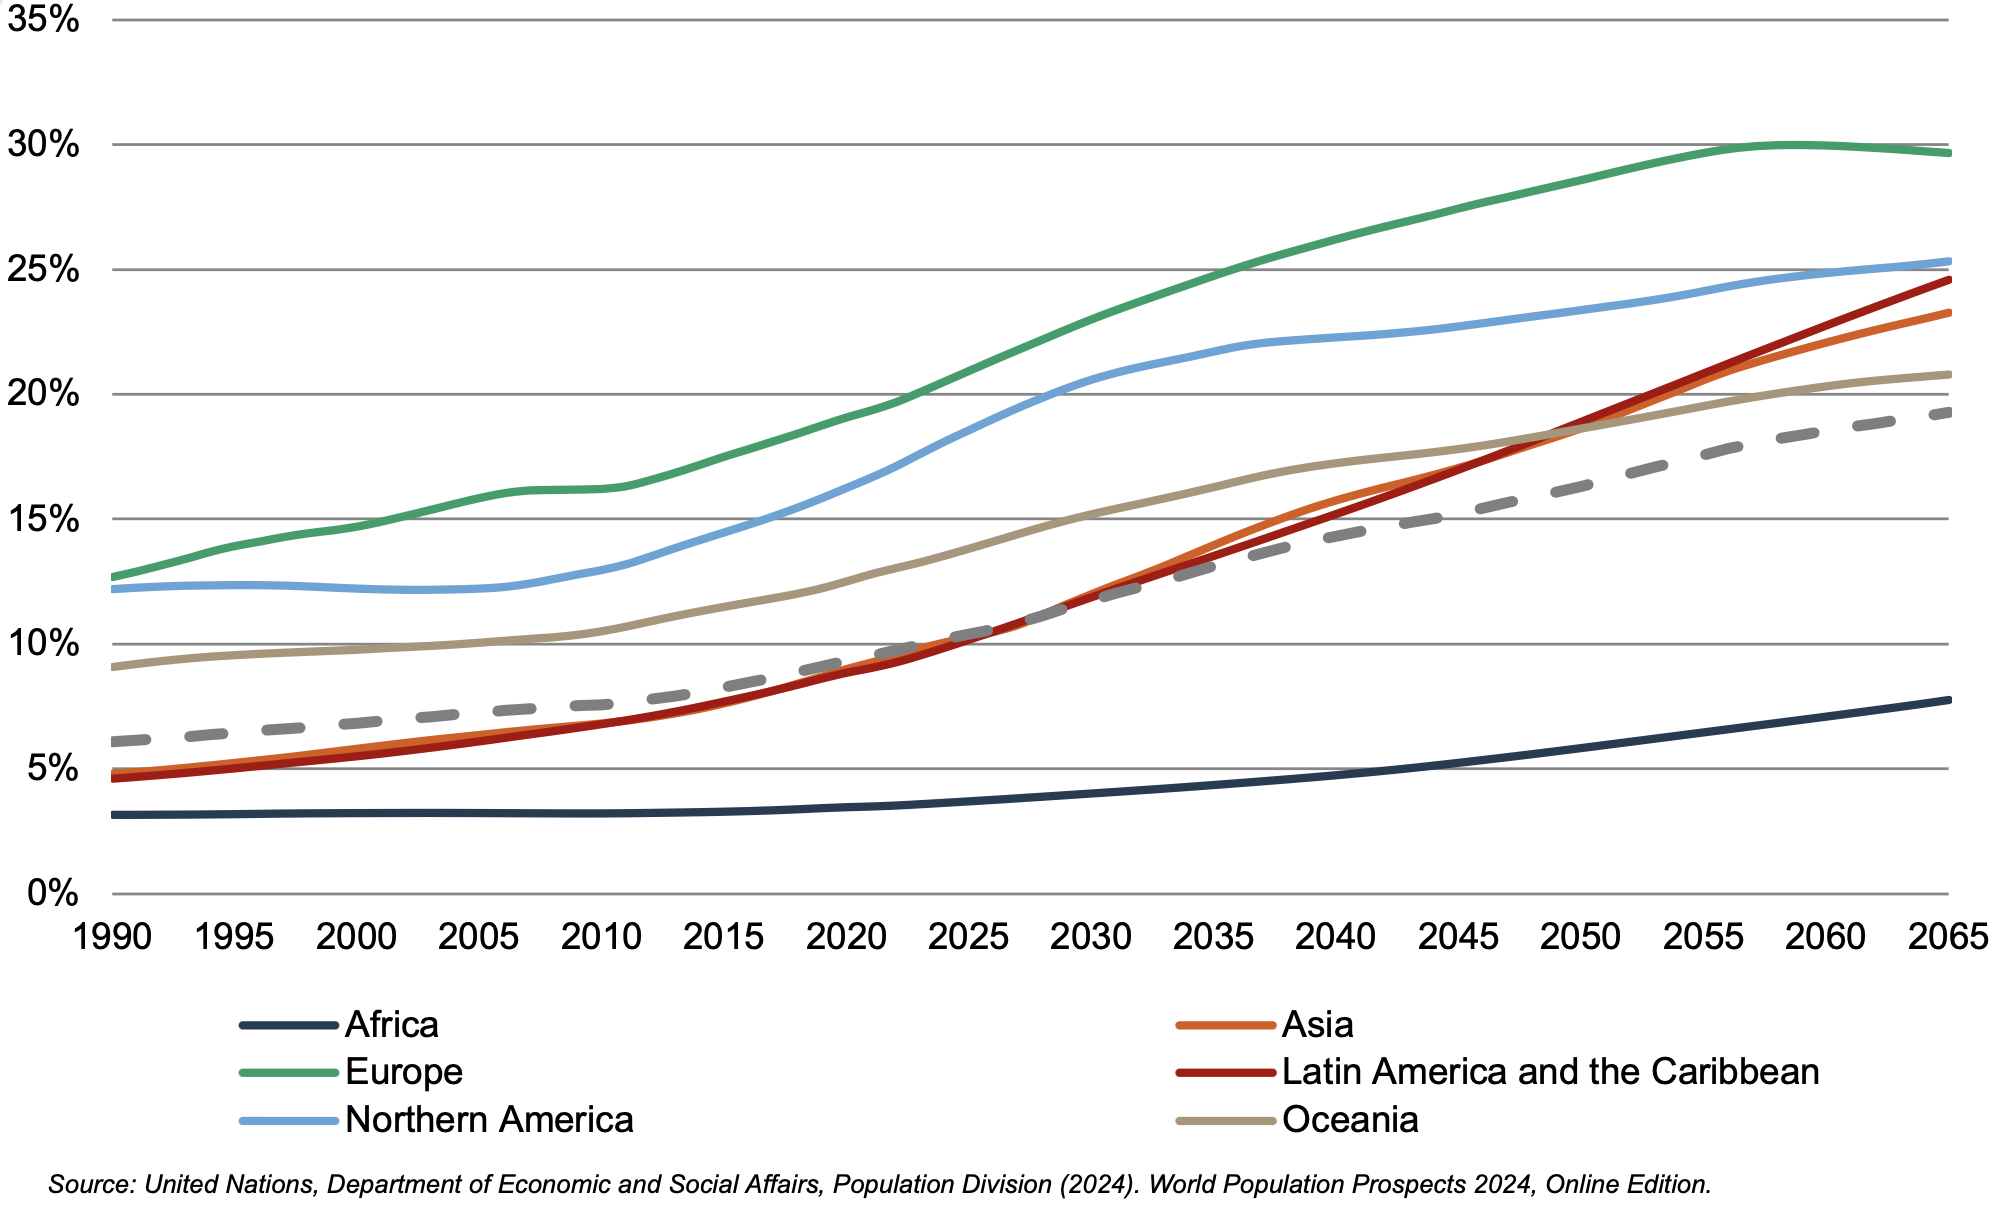
According to United Nations projections, the global elderly population will rise from approximately 809.0 million (10% of world population) in 2023 to 1.9 billion (19.3% of world population) in 2065. Europe’s elderly made up 20.1% of the total population in 2023, and the proportion is projected to reach 29.7% by 2065, making it the world’s oldest region. Latin American and the Caribbean is currently one of the youngest regions in the world, with its elderly at 9.5% of the total population in 2023, but this region is expected to undergo drastic transformation over the next several decades, with the elderly population expected to expand to 24.6% of the total population by 2065. North America has an above-average elderly population as of 2023 (17.6%) and is projected to expand to 25.3% by 2065.
2. Healthcare Spending and the Legislative Landscape in the U.S.
Demographic shifts underlie the expected growth in total U.S. healthcare expenditure from $4.9 trillion in 2023 to $7.7 trillion in 2032, an average annual growth rate of 5.6%. This projected average annual growth rate is slightly higher than the observed rate of 5.1% between 2013 and 2022, implying some acceleration in expected spending. Projected growth in annual spending for Medicare (average annual growth of 7.0%) and Medicaid (average annual growth of 5.2%) is expected to contribute substantially to the increase in national health expenditure over the coming decade. Growth in national healthcare spending, after significant growth in 2020 of 10.6%, slowed to 3.2% in 2021 and 4.1% in 2022 before increasing to 7.5% in 2023. Healthcare spending as a percentage of GDP is expected to increase from 17.6% in 2023 to 19.7% by 2032.
U.S. Healthcare Consumption Payor Mix and as a % of GDP
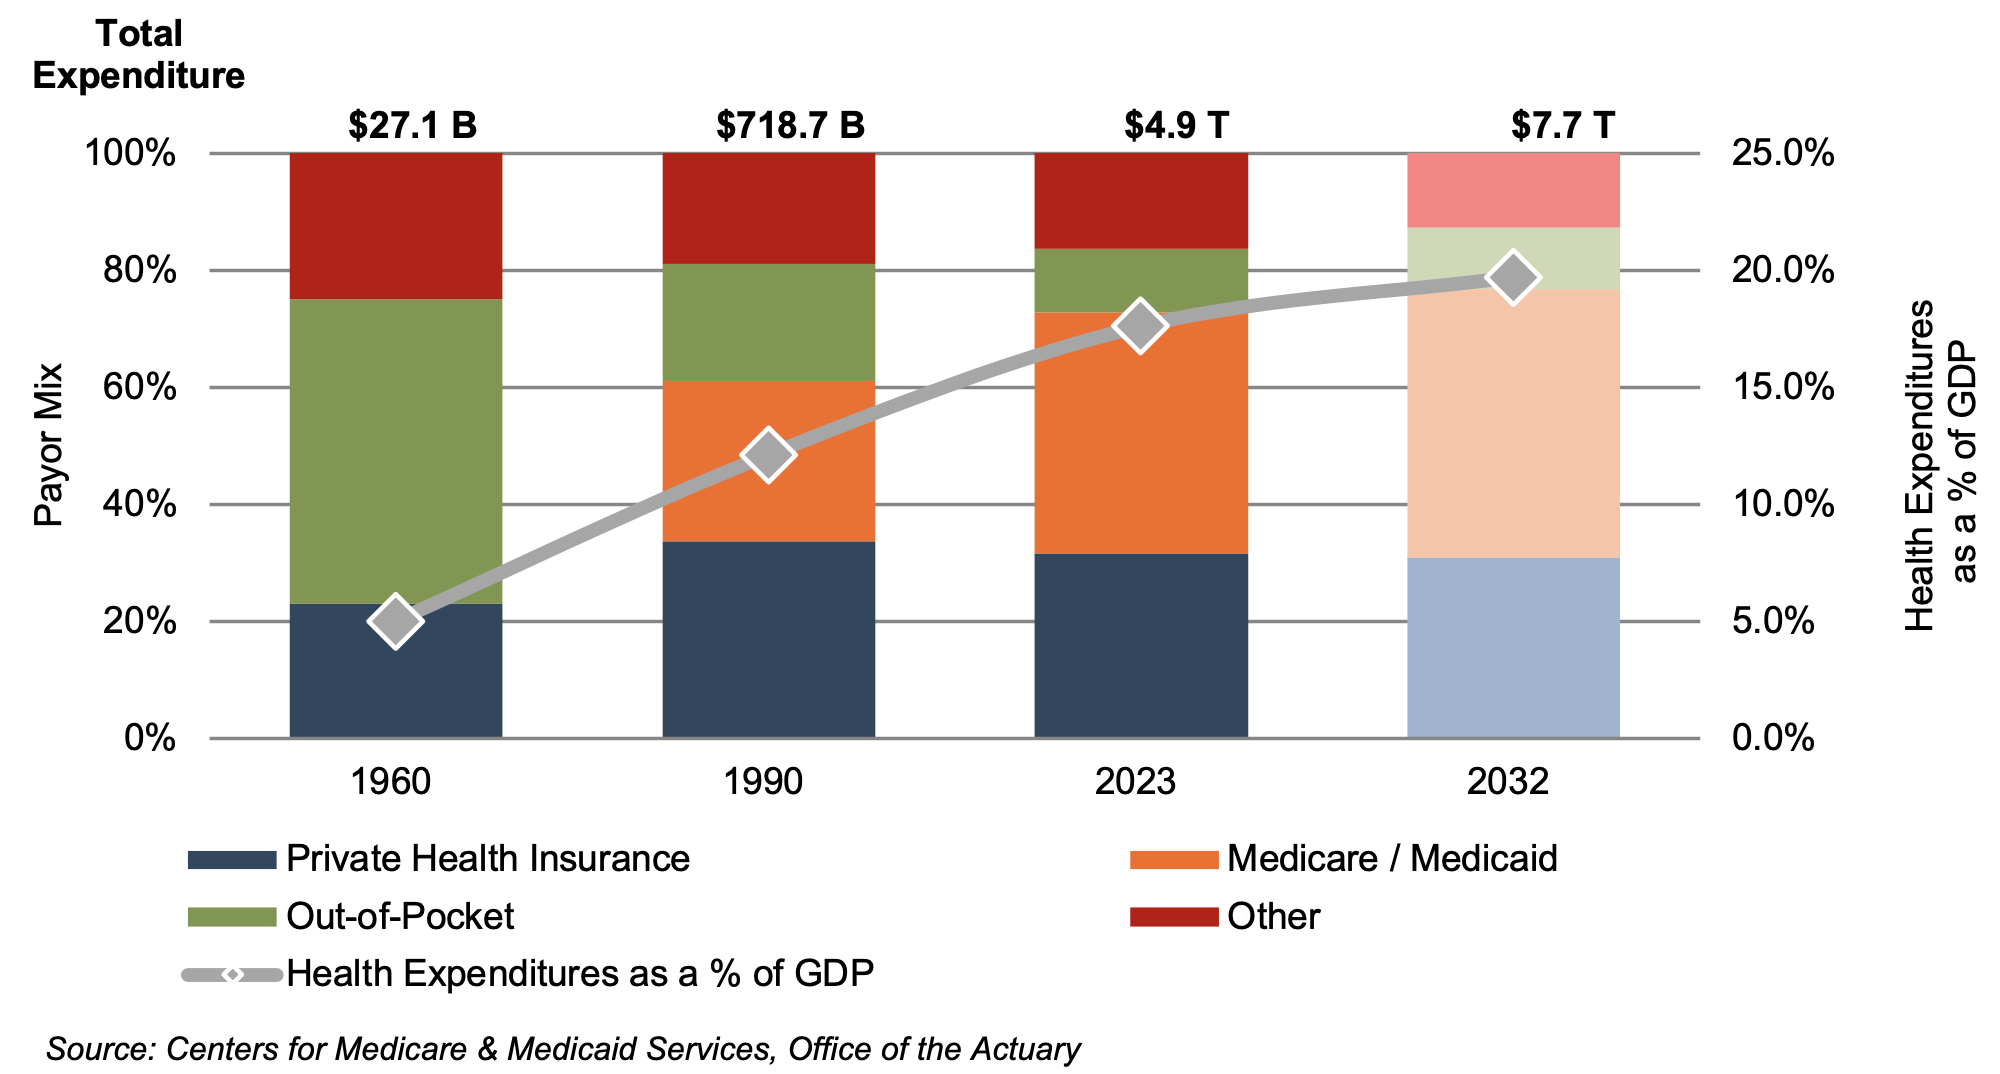
Since inception, Medicare has accounted for an increasing proportion of total U.S. healthcare expenditures. Medicare currently provides healthcare benefits for an estimated 65 million elderly and disabled people, constituting approximately 10% of the federal budget in 2021. Medicare spending growth is expected to average 7.1% from 2025 to 2026. Medicare represents the largest portion of total healthcare costs, constituting 21% of total health spending in 2021. Medicare accounts for 26% of spending on hospital care, 26% of physician and clinical services, and 32% of retail prescription drugs sales.
Average Spending Growth Rates, Medicare and Private Health Insurance
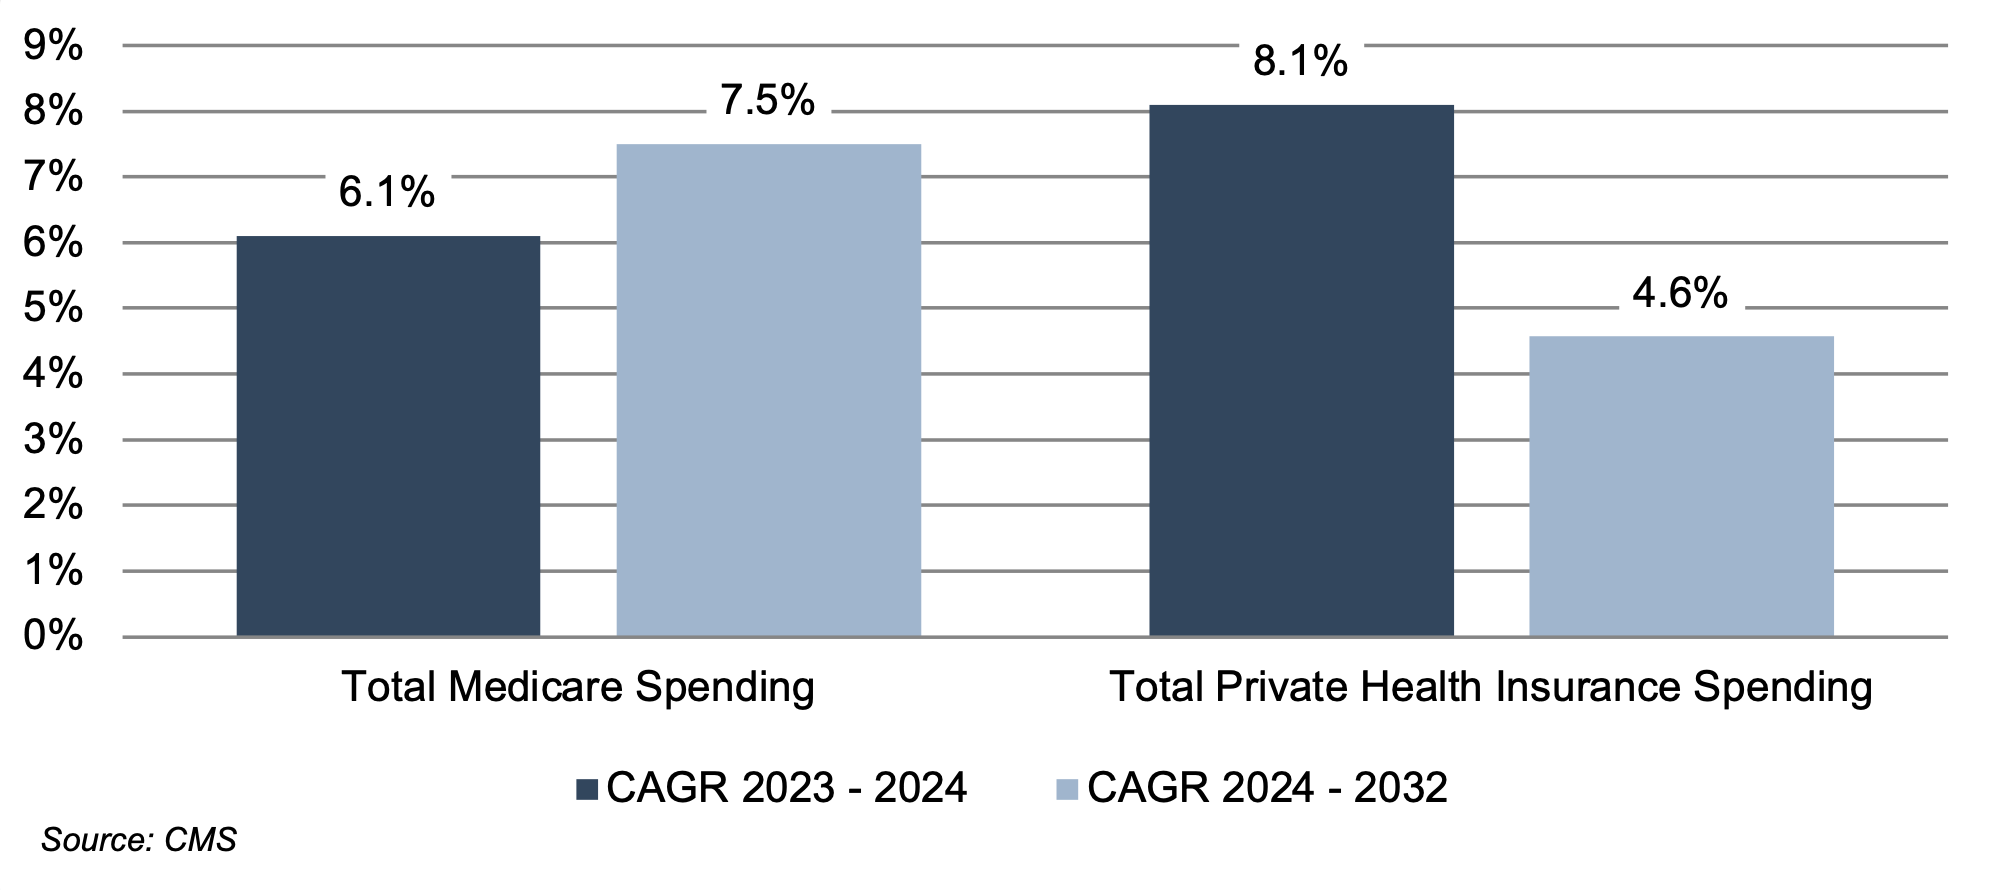
Due to the growing influence of Medicare in aggregate healthcare consumption, legislative developments can have a potentially outsized effect on the demand and pricing for medical products and services. In early 2025, there were indications of potential scrutiny of Medicare and Medicaid. Future updates of this outlook will incorporate any changes that may occur. Total Medicare spending totaled $1.0 trillion in 2023 and is expected to reach $1.9 trillion by 2032.
The Inflation Reduction Act (“IRA”) was signed into law in August 2022 by the Biden administration. Among other items, the IRA aims to lower prescription drug costs and improve access to prescription drugs for Medicare enrollees. Two healthcare spending-related items in the IRA include out-of-pocket caps for insulin products (capped at $35 for each monthly subscription under Part D and Part B) and a $2,000 out-of-pocket annual spending cap for drugs under Medicare Part D. These provisions could have significant effects on the growth rates for out-of-pocket spending for prescription drugs, which are projected to decline by 5.9% and 4.2% 2024 and 2025, respectively.
3. Third-Party Coverage and Reimbursement
The primary customers of medical device companies are physicians (and/or product approval committees at their hospitals), who select the appropriate equipment for the consumers (patients). In most developed economies, the consumers themselves are one (or more) step removed from interactions with manufacturers, and therefore pricing of medical devices. Device manufacturers ultimately receive payments from insurers, who usually reimburse healthcare providers for routine procedures (rather than for specific components like the devices used). Accordingly, medical device purchasing decisions tend to be largely disconnected from price.

Third-party payors (both private and government programs) are keen to reevaluate their payment policies to constrain rising healthcare costs. Hospitals and other care settings form the largest market for medical devices. Lower reimbursement growth will likely persuade hospitals to scrutinize medical purchases by adopting i) higher standards to evaluate the benefits of new procedures and devices, and ii) a more disciplined price bargaining stance.
The transition of the healthcare delivery paradigm from fee-for-service (FFS) to value models is expected to lead to fewer hospital admissions and procedures, given the focus on cost-cutting and efficiency. In 2015, the Department of Health and Human Services (HHS) announced goals to have 85% and 90% of all Medicare payments tied to quality or value by 2016 and 2018, respectively, and 30% and 50% of total Medicare payments tied to alternative payment models (APM) by the end of 2016 and 2018, respectively. A report issued by the Health Care Payment Learning & Action Network (HCPLAN), a public-private partnership launched in March 2015 by HHS, found that 33.7% of (traditional) Medicare payments were tied to APMs categorized as 3B and above in 2023, compared to 30.2% in 2022. HCPLAN has set goals of reaching 50% in 2024, 60% in 2025 and 100% in 2030. These goals are aligned with the CMS Innovation Center (CMMI) goal of having 100% of traditional Medicare beneficiaries with Parts A and B in care relationships with accountability for quality and total cost of care.
In 2020, CMS released guidance for states on how to advance value-based care across their healthcare systems, emphasizing Medicaid populations, and to share pathways for adoption of such approaches. CMS states that value-based care advances health equity by putting focus on health outcomes of every person, encouraging health providers to screen for social needs, requiring health professionals to monitor and track outcomes across populations, and engaging with providers who have historically worked in underserved communities. Ultimately, lower reimbursement rates and reduced procedure volume will likely limit pricing gains for medical devices and equipment.
The medical device industry faces similar reimbursement issues globally, as the European Union (EU) and other jurisdictions face similar increasing healthcare costs. A number of countries have instituted price ceilings on certain medical procedures, which could deflate the reimbursement rates of third-party payors, forcing down product prices. Industry participants are required to report manufacturing costs, and medical device reimbursement rates are set potentially below those figures in certain major markets like Germany, France, Japan, Taiwan, Korea, China, and Brazil. Whether third-party payors consider certain devices medically reasonable or necessary for operations presents a hurdle that device makers and manufacturers must overcome in bringing their devices to market.
4. Competitive Factors and Regulatory Regime
Historically, much of the growth of medical technology companies has been predicated on continual product innovations that make devices easier for doctors to use and improve health outcomes for the patients. Successful product development usually requires significant R&D outlays and a measure of luck. If viable, new devices can elevate average selling prices, market penetration, and market share.
Government regulations curb competition in two ways to foster an environment where firms may realize an acceptable level of returns on their R&D investments. First, firms that are first to the market with a new product can benefit from patents and intellectual property protection giving them a competitive advantage for a finite period. Second, regulations govern medical device design and development, preclinical and clinical testing, premarket clearance or approval, registration and listing, manufacturing, labeling, storage, advertising and promotions, sales and distribution, export and import, and post market surveillance.
Regulatory Overview in the U.S.
In the U.S., the FDA generally oversees the implementation of the second set of regulations. Some relatively simple devices deemed to pose low risk are exempt from the FDA’s clearance requirement and can be marketed in the U.S. without prior authorization. For the remaining devices, commercial distribution requires marketing authorization from the FDA, which comes in primarily two flavors.
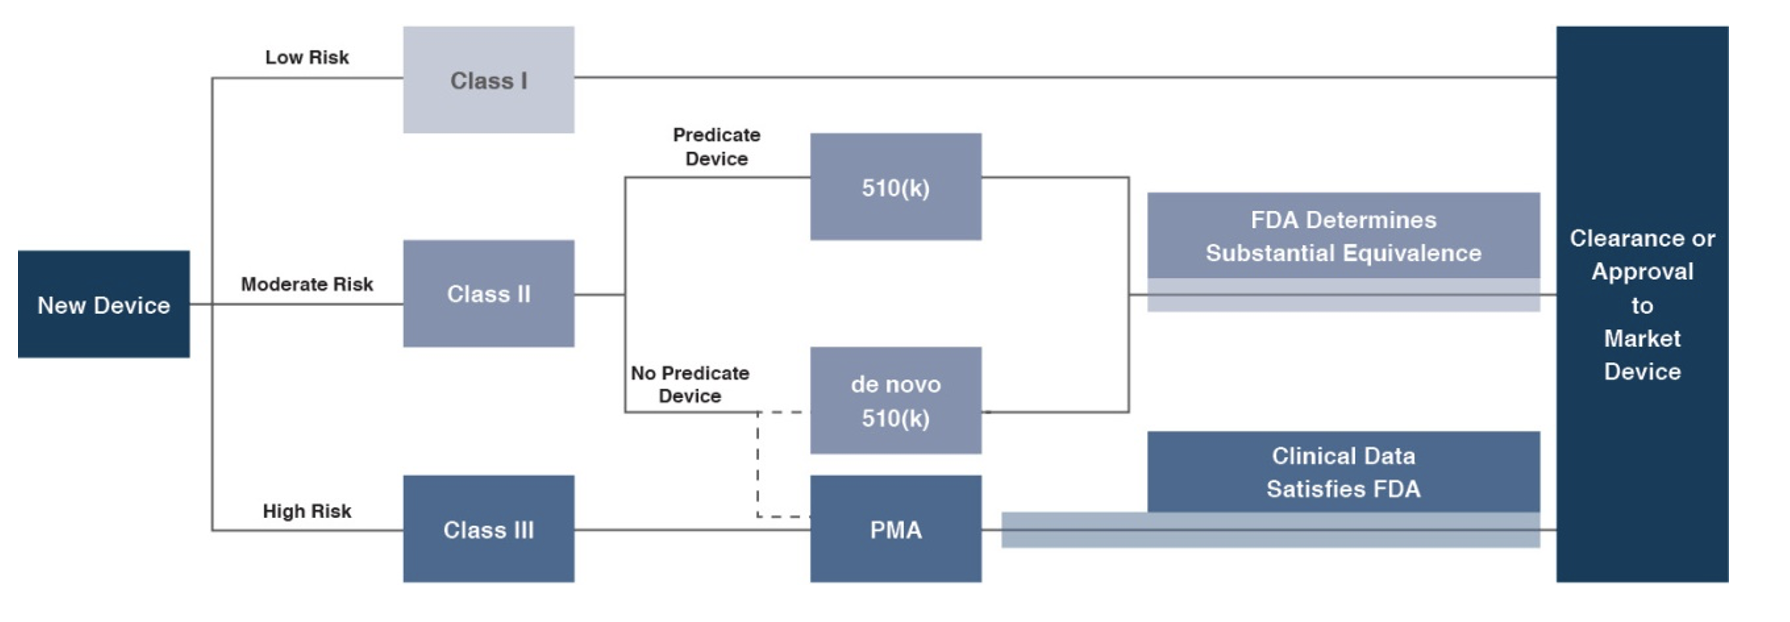
1) The premarket notification (“510(k) clearance”) process requires the manufacturer to demonstrate that a device is “substantially equivalent” to an existing device (“predicate device”) that is legally marketed in the U.S. The 510(k) clearance process may occasionally require clinical data and generally takes between 90 days and one year for completion. In November 2018, the FDA announced plans to change elements of the 510(k) clearance process. Specifically, the FDA plan includes measures to encourage device manufacturers to use predicate devices that have been on the market for no more than 10 years. In early 2019, the FDA announced an alternative 510(k) program to allow medical devices an easier approval process for manufacturers of certain “well-understood device types” to demonstrate substantial equivalence through objective safety and performance criteria. In February 2020, the FDA launched its voluntary pilot program: electronic Submission Template and Resource (eSTAR) as an interactive submission template that may be used by the medical device submitters to prepare certain pre-market submissions for a device. Starting in October 2023, all 510(k) submissions were required to be submitted using eSTAR unless exempted.
2) The premarket approval (“PMA”) process is more stringent, time-consuming, and expensive. A PMA application must be supported by valid scientific evidence, which typically entails collection of extensive technical, preclinical, clinical, and manufacturing data. Once the PMA is submitted and found to be complete, the FDA begins an in-depth review, which is required by statute to take no longer than 180 days. However, the process typically takes significantly longer and may require several years to complete.
Pursuant to the Medical Device User Fee Modernization Act (MDUFA), the FDA collects user fees for the review of devices for marketing clearance or approval. The current iteration of the Medical Device User Fee Act (MDUFA V) came into effect in October 2022. Under MDUFA V, the FDA is authorized to collect $1.8 billion in user fee revenue for the five-year cycle, an increase from the approximately $1 billion in user fees under MDUFA IV, between 2017 and 2022. A significant change from MDUFA IV to MDUFA V relates to performance goals for De Novo Classification requests (requests for novel medical devices for which general controls alone provide reasonable assurance of safety and effectiveness for the intended use). There has also been updated PMA guidance, with the FDA conducting substantive reviews within 90 calendar days for all original PMAs, panel-track supplements, and 180-Day supplements.
Regulatory Overview Outside the U.S.
The European Union (EU), along with countries such as Japan, Canada, and Australia all operate strict regulatory regimes similar to that of the FDA, and international consensus is moving towards more stringent regulations. Stricter regulations for new devices may slow-release dates and may negatively affect companies within the industry.
Medical device manufacturers face a single regulatory body across the EU: Regulation (EU 2017/745), also known as the European Union Medical Device Regulation (EU MDR). The regulation was published in 2017, replacing the medical device directives regulation that was in place since the 1990s. The requirements of the MDR became applicable to all medical devices sold in the EU in May 2021. The EU is the second largest market for medical devices in the world with total medical device sales expected to exceed approximately €170 billion by 2027, behind only the United States. The EU MDR has introduced stricter requirements for medical device manufacturers, including increased clinical evidence and post-market surveillance. Consequently, there is increased risk for longer approval processes and delays in manufacturing of these devices.
5. Emerging Global Markets
Emerging economies are claiming a growing share of global healthcare consumption, including medical devices and related procedures, owing to relative economic prosperity, growing medical awareness, and increasing (and increasingly aging) populations. According to the WHO, middle income countries, such as China, Turkey, and Peru, among others, are rapidly converging towards outsized levels of spending as their income scales. When countries grow richer, the demand for health care increases along with people’s expectation for government-funded healthcare. Upper-middle income countries accounted for 17.5% of total global healthcare spending in 2021, up from 10.5% in 2000.
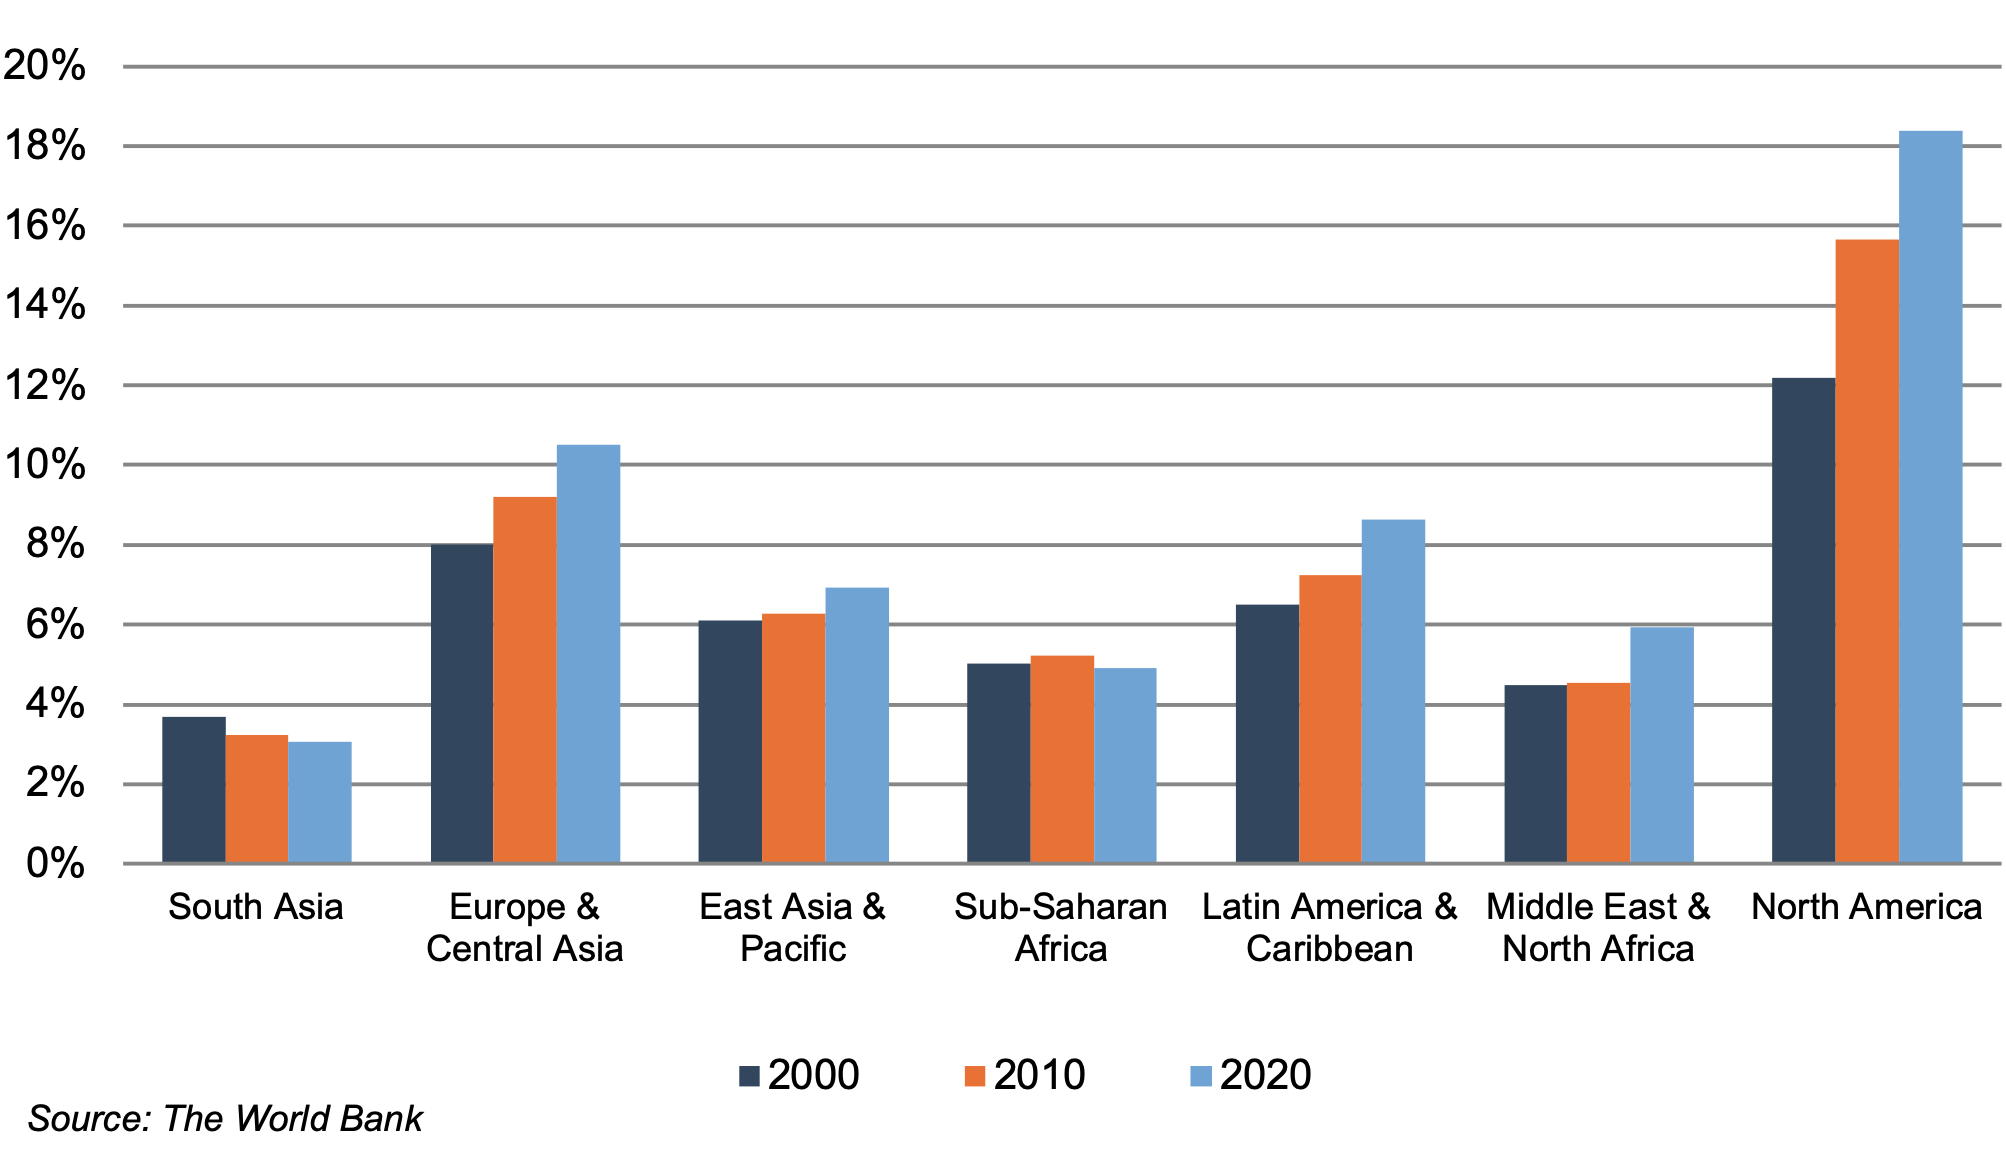
As global health expenditure continues to increase, sales to countries outside the U.S. represent a potential avenue for growth for domestic medical device companies. According to the World Bank, all regions (except Sub-Saharan Africa and South Asia) have seen an increase in healthcare spending as a percentage of total output over the last two decades.
Global medical device sales are estimated to increase 6.3% annually from 2024 to 2032, reaching nearly $887 billion according to data from Fortune Business Insights. While the Americas are projected to remain the world’s largest medical device market, the Asia Pacific market is expected to expand at a relatively quicker pace over the next several years.
World Health Expenditure as a % of GDP
Summary
Demographic shifts underlie the long-term market opportunity for medical device manufacturers. While efforts to control costs on the part of the government insurer in the U.S. (and elsewhere) may limit future pricing growth for incumbent products, a growing global market provides domestic device manufacturers with an opportunity to broaden and diversify their geographic revenue base. Developing new products and procedures is risky and usually more resource intensive compared to some other growth sectors of the economy. However, barriers to entry in the form of existing regulations provide a measure of relief from competition, especially for newly developed products.
Post-Script – Outlook for the Balance of 2025
The medical device industry, if not the broader body politic, looked to have put the COVID-19 pandemic firmly behind it by 2024. COVID-era convulsions specific to the industry on the demand and supply sides included deferrals of many elective procedures in the early part of the pandemic and disruptions to the (global) supply chains involved in the manufacture of devices and equipment. Procedure volumes were largely caught up by a couple of years after the pandemic and most manufacturers appeared to have worked through their supply chain and inventory issues by 2024. Back to focusing on the more routine longer-term demographic and other trends?
Well, maybe not quite so fast. As we were updating this note in mid-April, a few new items came to light that many observers may not have been adequately attuned to even at the advent of the new year. First, the U.S. has embarked on a deliberate push to alter the global trade landscape. While the specifics of the new regime remain uncertain and in flux, it is fair to assume a higher degree of trade friction will affect device manufacturers that rely on global supply chains. And such friction will surely introduce costs, including welfare losses, that will be borne to varying degrees by everyone involved – component suppliers, manufacturers, caregivers, end-user patients, and entire nations.
Second, changes in the payor landscape in the U.S. could potentially materialize as the government appears ready to scrutinize Medicaid and Medicare programs. Again, the specifics of these changes (if any) are unknown and uncertain. However, following our discussion of the second trend in an earlier section of this article, it bears considering that any changes to these programs will percolate to care settings, potentially affecting everyone involved.
Finally, in this space we are fond of mentioning likely technological changes ahead of us. Last year, we highlighted GLP-1 drugs, and deservedly so even after the benefit of hindsight. At the current moment, artificial intelligence has come to dominate the zeitgeist. For medtech companies, AI has the potential to bring about technological change across a wide range of functions from product design/testing, to incorporation of large datasets (and analysis) to enhance procedure outcomes, to business process improvements. We will remain highly curious observers over both the short term and long term.
Stryker Corporation (SYK): Many Acquisitions in 2024
Stryker Corporation (NYSE:SYK) is a global leader in medical technologies, offering products and services in MedSurg, Neurotechnology, and Orthopedics that help improve patient and healthcare outcomes. Divestiture of the Spine division was completed in 2025. The company sells its products to physicians, hospitals, and other healthcare facilities through company-owned subsidiaries and branches, as well as third-party dealers and distributors in approximately 75 countries. The company is based in Portage, Michigan.
During 2024, Stryker Corporation completed a number of acquisitions, with a further announcement in early January 2025. Since the beginning of 2024, Stryker’s stock price has grown 34% from $296.23 per share to $397.17 per share in early February 2025. Stryker CEO Kevin Lobo highlighted the company’s recent acquisitions in October 2024, stating that he expects the acquisitions to contribute $300 million to its 2025 sales. Additionally, Mr. Lobo stated Stryker has “significant financial capacity for future deals,” having already spent $1.6 billion, and that “M&A will be the number one use of the company’s cash going forward.” On the following page, we summarize our observations related to some of Styker’s recent acquisitions and the company’s stock price at the relevant dates.

Click here to expand the image above
(A): Stryker Corporation agreed to acquire 100% of Webdr.ai Inc. (fka Care.ai inc.), a Florida-based company, on August 12, 2024. The acquisition was completed on September 17, 2024. The terms of the deal were undisclosed. On the day of announcement, Stryker’s stock price was $325.20 per share. Webdr.ai develops and operates a sensor-based platform that detects and evaluates a range of patient behaviors. Primarily, it offers an artificial intelligence (AI) powered platform that detects and predicts adverse events. The acquisition aims to strengthen Stryker’s growing healthcare IT offering and wirelessly connected medical device portfolio.
(B): Stryker Corporation agreed to acquire 100% of Vertos Medical Inc. (fka X-Sten Corp.), a California-based company, on August 22, 2024. The acquisition was completed on October 1, 2024. The terms of the deal were undisclosed. On the day of announcement, Stryker’s stock price was $350.72 per share. Vertos, a medical device company, develops minimally invasive treatments for lumbar spinal stenosis. The Vertos acquisition aims to strengthen Stryker’s Orthopedics and Spine segment.
(C): Stryker Corporation acquired 100% of NICO Corporation, an Indiana-based company, on September 20, 2024. The terms of the deal were undisclosed. Stryker’s stock price at the transaction date was $364.81 per share. NICO designs and develops technology and products for the field of corridor surgery, including cranial, ENT, spinal, and otolaryngology. It offers its products through distributors to physicians and hospitals in North America, the Middle East, Israel, Oceania, Australia, and New Zealand. The acquisition aims to complement Stryker’s Neurotechnology and Spine segments.
(D): Stryker Corporation agreed to acquire 100% of Inari Medical, Inc. (NASDAQGS:NARI), a California-based company, on January 6, 2025 for a total of $4.8 billion. Under the terms of the offer, Stryker will commence a tender offer for all outstanding shares of common stock for $80 per share in cash. On the day of announcement, Stryker’s stock price was $361.36 per share. Inari builds minimally invasive, novel, and catheter-based mechanical thrombectomy devices and accessories for specific diseases in the United States. This acquisition should be accretive to Stryker’s Neurovascular business, per management. Mr. Lobo noted “the acquisition of Inari expands Stryker’s portfolio to provide life-saving solutions to patients who suffer from peripheral vascular diseases.” At announcement, the deal’s enterprise value to total revenue multiple was 8.37x.
The Value of Carried Interest in Estate Planning: A Guide for Newly Formed Funds
As we stated in the March 2025 issue of Value Matters®, we believe that prudent federal estate and gift tax planning involves a lifetime horizon with adherence to best practices that yield optimal outcomes. When economic and market conditions present an opportunity for estate planning, assets with low current values and potential for significant appreciation should be considered for efficient estate planning. One type of asset that fits this category is carried interest.
This article explores the strategic incorporation of carried interests in estate planning, particularly for newly formed private equity funds. It discusses the benefits and complexities of leveraging such interests under current economic conditions and tax regulations to optimize estate outcomes. We will discuss specific valuation approaches and methods in the valuation of carried interests in a future article.
Carried Interest Explained
What is carried interest? It is the profits interest that a private equity, venture capital, or hedge fund principal receives if the fund exceeds certain performance benchmarks. Carried interest can also be referred to as performance allocation, incentive allocation, or promote interest in the case of real estate funds. Separately, fund principals also receive economics from management fees and direct investments in the fund.
Fund Structures and Carried Interest Allocation
A basic private equity fund structure is shown below. Typically, the fund principals form a general partner entity and a management company entity. The principals then raise capital from limited partners and make investments over the term of the fund. The management company receives management fees, often around 2% per year, for investment management services provided. The general partner entity typically invests alongside the limited partners and receives its pro-rata share of returns along with the limited partners. If the fund exceeds certain benchmarks, the general partner also receives carried interest, often around 20% of fund returns beyond the benchmark.

It is important to note that private equity fund structures come in many forms, from basic to complex. Even though this article is focused primarily on private equity funds, similar concepts apply to certain hedge funds and venture capital funds.
Navigating Uncertainty and Valuation Challenges
Uncertainty exists regarding the fund’s performance, more so earlier in the fund’s life. When the fund entities are formed, and before capital is raised, there is also uncertainty regarding how much capital will be raised. These uncertainties result in low values for the fund entities at inception. The fund entity values will appreciate significantly if the fund is able to successfully raise capital and achieve strong investment returns.
Why would a newly formed fund entity have any value before capital is raised? The IRS’ Revenue Procedure 93-27 provides that if a person receives a profits interest for the provision of services to or for the benefit of a partnership in a partner capacity or in anticipation of being a partner, the IRS will not treat the receipt of such an interest as a taxable event for the partner or the partnership. It has been argued that 93-27 means that a profits interest has no value at issuance. However, the IRS has made it clear that 93-27 is not applicable to valuing carried interest.
Challenges in Valuing Interests in Fund Entities
A qualified appraisal prepared by a qualified appraiser with experience valuing carried interest is paramount when making estate planning transfers with newly formed fund entity interests given the complexity involved. In addition to fund structure, other items that require appraiser familiarity with carried interest include the following:
- Fundraising: What is the fund’s target size? What is the minimum required investment? Will the fund offer special terms for early investors or for a large “anchor” investor?
- Fund investment strategy: What types of investments will the fund make in terms of asset classes, industries, size of interests, number of investments, etc.? How will the investments shape expected returns for the fund? What is the expected holding period for the investments? Will capital from the sales of investments be reinvested? Will the fund use leverage?
- Fund terms: How is the management fee calculated and how often will it be assessed? Who will pay for fund expenses? Is there a general partner catch-up after the hurdle is reached? Are distributions made on a deal-by-deal basis, or on a cumulative basis? Can the general partner waive management fees associated with their direct investments in the fund?
Conclusion
In conclusion, carried interests in newly formed fund entities present a valuable estate planning opportunity, particularly during times of economic uncertainty and where there is potential for fund appreciation.
It is essential to work with qualified appraisers familiar with the complexities of fund structures and tax regulations to ensure optimal outcomes. Engaging with experienced advisors can significantly enhance the outcomes of your estate planning efforts.
The professionals at Mercer Capital have experience in the valuation of carried interests. For more information or to discuss a valuation issue in confidence, feel free to contact us.
Personal vs. Enterprise Goodwill: Issues to Consider in Divorce Valuations
For this month’s edition of Family Law Valuation and Forensic Insights, we revisit a timely article on personal vs. enterprise goodwill. This topic is especially relevant as our family law team gears up to speak in a BVR webinar this week titled, “Personal vs. Enterprise Goodwill in Valuations for Divorce.” Registration for this webinar is linked below.
What Is Goodwill?
Goodwill is the difference between the value of a business less its tangible net assets such as fixed assets. Goodwill is synonymous with intangible assets, and the value of a business is the value of tangible assets + value of intangible assets. Some of the intangible assets can be separated and valued, such as assembled workforce; others fall into the catch-all goodwill category.
What Is Personal Goodwill?
Personal goodwill generally is interpreted as representing attributes that are unique to, and inseparable from, an individual, not able to be transferred. The other portion of goodwill, referred to as enterprise or business goodwill, generally is interpreted as representing value that is owned and/ or that has been created by an enterprise and that can be transferred.
Attributes typically classified within the personal goodwill category include the following:
- Personality
- Reputation
- Personal skill, expertise and knowledge
- Personal relationships
In essence, personal goodwill is represented by certain attributes that are deemed to be incorporated into the very being of an individual, and, therefore, are unable to be sold or transferred to another individual.
What Is Enterprise Goodwill?
Identifiable intangible assets typically classified within the enterprise goodwill category include the following:
- Trademarks and trade names
- Patented and unpatented technology
- Copyrights
- Customer lists and relationships (patient files/records)
- Contracts (employment, noncompete agreements)
- Phone number
- Leasehold
- Trained and assembled workforce
- Location
Why and How Is Personal Goodwill Important?
Many states identify and distinguish between personal goodwill and enterprise goodwill, and further allocate that . This may have a significant impact on the division of the marital estate. However, beyond the business valuation and division, the income derived from the personal goodwill may still be factored into division and/or future support, depending on the state.
Is Personal Goodwill More Common in Professional Services Industries?
Yes – personal goodwill tends to be more prevalent in certain industries than others and varies from matter to matter. The concept of personal goodwill is easier identified and more prevalent in professional service industries such as law practices, accounting firms, and physician practices. Does that mean it doesn’t apply to other industries such as retail, manufacturing, transportation, etc? In order to evaluate the potential carve-out of personal goodwill in an industry/business, the owner/ principal would have to exhibit a unique set of skills that specifically translates to the heightened performance of their business, unable to be transferred to another person/business.
The Goodwill Transition from Personal to Enterprise, Relative to Business Size
The image below illustrates the relationship of changing attributes of business size relative to proportion personal versus business/enterprise goodwill.
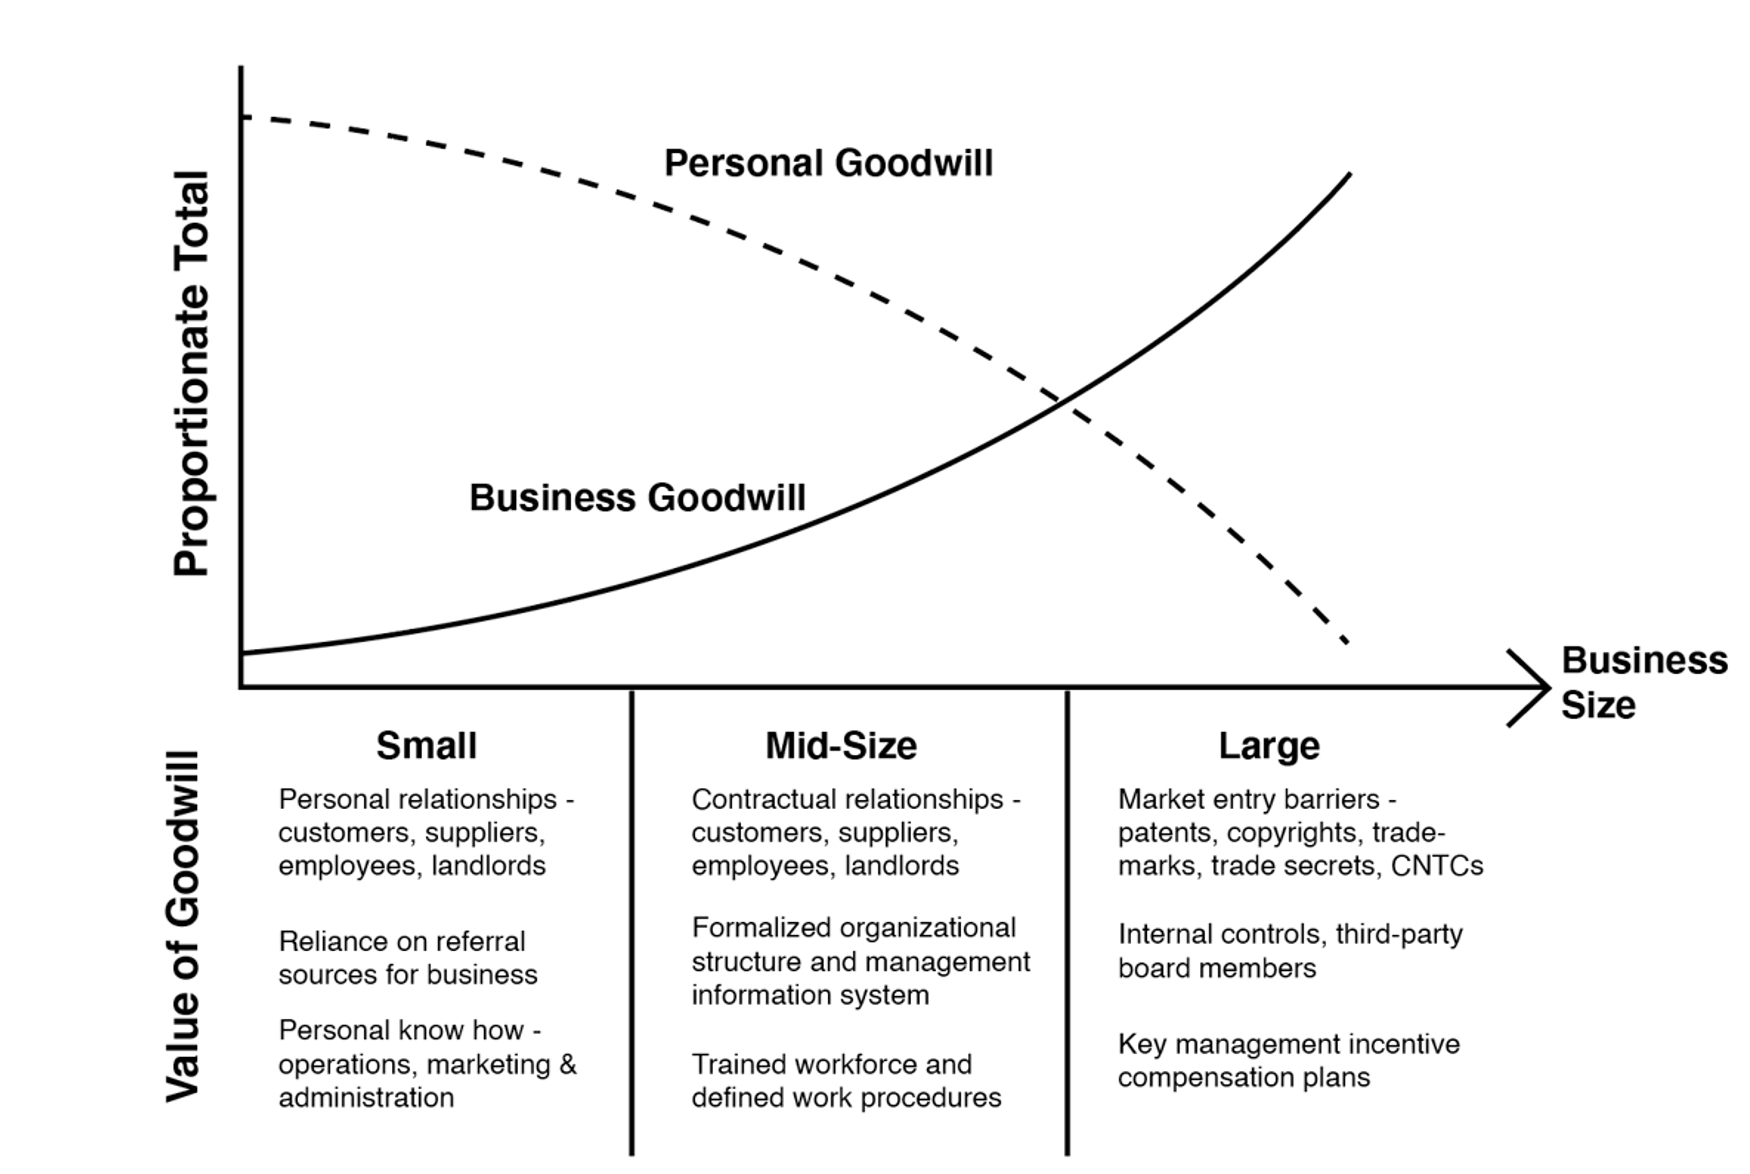
Source: BVR’s Guide to Personal v. Enterprise Goodwill
The inverse relationship between business size and percentage allocation makes intuitive sense. One person can only work so much, and their personal impact cannot be scaled like an enterprise, increasing the value attributable to the platform, i.e. the business itself.
Conclusion
There is no one-size-fits-all methodology or approach to allocating personal vs. enterprise goodwill. It will depend on the industry, history of the company, and relative contributions of the divorcing spouse(s) as well as contributions of all other employees, among other factors. From a theoretical perspective, personal goodwill should show the difference in value of the business with and without the contributions from the divorcing party. Personal goodwill has become a common battleground and the need for supportable analyses and subject matter expertise can greatly assist the marital dissolution process. Mercer Capital has extensive experience in this complex topic across various industries and business sizes.
Navigating Uncertainty: Estate Planning Amid IRS Changes and Tax Reforms
Recent reports indicate the current administration’s intent for major changes related to the staffing, structure, and operations of the Internal Revenue Service. Layoffs of as much as 50% of IRS personnel logically equate to a significant reduction in enforcement activity.
As a further complication for estate planning, sunset provisions of the 2017 TCJA loom at the end of the year. Legislation has been introduced in both the House1 and Senate2 to “permanently repeal” the federal estate and generation skipping taxes.
These events converge to result in an environment of significant uncertainty for federal estate tax planning.
Some taxpayers may conclude that they may be able to devote less attention to estate and gift tax reporting matters. Other taxpayers may think that they can skip planning for federal estate taxes under the guise of permanent repeal.
We believe that prudent federal estate and gift tax planning involves a lifetime horizon with adherence to best practices that yield optimal outcomes. Enforcement levels during one administration do not provide a precedent for the enforcement activities of a future administration.
Importantly, due to the lifetime structure of the estate and gift tax regime in the United States, gift tax transactions are subject to inquiry or examination at death.
With respect to estate tax “repeal,” even if such legislation is enacted, the fact that both the House and Senate proposals do not repeal the gift tax strongly suggests that Congress wants the discretion to bring back the estate tax at a future date.
For estate planning that involves the transfers of material interests in privately held business interests, best practices include thoughtful planning, execution and reporting of such transfers that often provide the foundation for intergenerational wealth planning. Foremost in the taxpayer’s arsenal is the Adequate Disclosure Regulations for Gifts. Adherence to the criteria in these regulations provides taxpayers with a proactive approach to start the three-year statute of limitations that commences upon filing of the gift tax return.
In conclusion, estate planning for the long-term is the best course of action.
Those individuals currently subject to estate tax exposure are well-advised to continue periodic planning activities and keep current planning architectures in place.
Given the systematic fiscal challenges facing the federal government, taxpayers who maintain a course of consistent and vigilant estate planning will be best positioned to achieve their planning objectives and successfully thwart future challenges once the pendulum of enforcement activity and tax policies inevitably swing in the opposite direction.
A Cautiously Optimistic Outlook for Bank M&A: AOBA 2025 Recap
We recently attended Bank Director’s 2025 Acquire or Be Acquired Conference (“AOBA”) in Phoenix, Arizona. AOBA is a two-and-a-half-day conference that covers a wide range of topics, including the nuts and bolts of bank M&A, an overview of bank valuation trends and drivers, growth strategies (both organic and inorganic), and FinTech strategies.
Phoenix’s warm and sunny weather reflected the generally optimistic and upbeat mood of the 2025 conference. We discuss three primary themes below that stuck out to us.
Banks Turned a Corner in 2024
This theme was noted in several sessions, and the data observed for publicly traded banks was often cited as evidence of the turnaround. Small-cap publicly traded banks experienced negative returns in 2022, 2023, and the first half of 2024. On average, publicly traded bank’s earnings per share declined in 2023 and 2024. This reflected a combination of headwinds, including NIM compression, higher operating expenses, slower growth, and increased provision expense (although credit quality and the macro economy generally remained strong from 2022-2024, pockets like CRE in certain markets/niches began to impact provisions for some banks).
However, a shift in sentiment appeared to occur in mid-2024, and small-cap banks increased 23% in the second half of the year. This reflected that sentiment began to shift towards a no (or perhaps extremely soft) landing for the economy, the uninverted yield curve, and bank net interest margins and cost of funds bottoming out in mid-2024. This provided a foundation for banks from which NIM expansion could occur and a tailwind for EPS growth in 2025. For 2025, EPS growth was forecast to be driven by a combination of NIM expansion from lower funding costs, higher yields as legacy assets continue to mature and/or reprice higher, and higher loan growth.
In addition to the more optimistic earnings outlook, it was noted that capital market availability for banks (opportunities to raise capital through debt and equity issuances) was on the rise. Several presenters noted evidence of this trend, with a few common equity raises by banks in the second half of 2024 that helped fund M&A, inorganic growth, and/or balance sheet repositioning. Earnings and capital growth were expected to fuel banks to position themselves for organic or inorganic growth (through M&A) in 2025.
Optimism That Bank M&A Will Accelerate
Consistent with the theme of turning the corner and greater capital market availability for M&A, there was noted optimism that bank M&A will accelerate in 2025. The reasons cited beyond banks generally turning the corner include the following:
- Pent-Up M&A Demand. The number of announced transactions and % contraction in the industry was below the long-term averages for the last few years. This has created a backlog of would-be sellers and buyers that could lead to enhanced discussions and merger activity as conditions improve.
- Buyer Needs. Elements that exist for buyers that could enhance M&A include capital market availability, a continued focus on improving efficiency and returns by achieving greater scale, the need to diversify and/or enhance loan/deposit mix, expanding geographically, and having improved valuations (relative to year-end 2023) to facilitate using their stock as acquisition currencies in deals.
- Seller Needs. For sellers, a number of the trends that could be drivers for M&A are an aging management/ownership/board and a need for liquidity for shareholders; a need for additional scale to enhance efficiency, technological, and/or profitability; and relatively low tax rates (present vs. historical).
- Continued Need for Scale/Size in Light of Competitive Environment. The growing number of attendees and presenters at AOBA illustrated a talking point that came up in several sessions. Banking remains a highly competitive marketplace with competition from traditional players (banks, CUs), non-traditional players (non-bank and alternative lenders), and emerging players (FinTechs). A few sessions discussed at what level of scale a bank needs to be for peak efficiency. While these discussions often led to further debate than a definitive answer, added size/scale was often cited as necessary to achieve better operating leverage and to have the earnings to fuel necessary investments in staff, facilities, and technology over time.
- Potential for Less Regulation. Although many sessions noted the significant uncertainty around the regulatory outlook, the potential for a less stringent regulatory environment in light of the changeover in administration is a factor that could lend itself to more M&A. This potential for a less stringent and more efficient regulatory approval process could shorten timelines to closing and be a tailwind for M&A.
Potential Headwinds to Bank M&A Still Persist
Despite improving conditions and the optimism around bank M&A in 2025 noted above, some of the headwinds that have kept deal and consolidation levels below historical norms in the last ~2 years were also frequent discussion topics in sessions. A few of the persistent headwinds include the following:
- Fair Value Marks and Pressure on Pro Forma Capital Ratios. Discounts on acquired assets, particularly long-term fixed rate loans and securities, pressure pro forma tangible capital ratios and may limit the number of viable and interested buyers and reduce buyers’ valuation of the seller for those that remain interested.
- Scarcity of Buyers. We talked about pent-up demand for M&A, but another aspect that came up in a few sessions is how consolidation over the years has reduced the number of potential buyers willing, able, and interested in acquiring a particular bank. CUs and private equity have expanded the pool of potential buyers and helped offset this headwind to some extent, but some community banks still have a scarcity of buyers.
- Bid-Ask Spread Between Buyers and Sellers. The current environment is often conducive to a disconnect between buyers’ valuations and sellers’ expectations. The improved earnings outlook for 2025 could widen this disconnect between buyers and sellers.
- Economic Uncertainty and Interest Rate Volatility. Although we noted some favorable economic and interest rate trends for banks in recent months/quarters, a significant amount of economic uncertainty and interest rate volatility remains. This could lead some would-be buyers and sellers to sit on the sidelines until greater certainty and less volatility emerge.
- Regulatory Uncertainty. While hope exists for lighter regulations and a shorter timeline to closing, hope in and of itself is not a strategy and regulatory uncertainty still persists. It will be interesting to see if that trend starts to surface in 2025.
Conclusion
In conclusion, the discussions and talking points across different sessions led me to think that “cautious optimism” for bank M&A is the best description of the overall theme and mood of AOBA 2025. We look forward to discussing these issues further with clients in 2025 and monitoring how they evolve within the banking industry over the next year.
As always, Mercer Capital is available to discuss these trends as they relate to your financial institution, so feel free to call or email. Mercer Capital can assist financial institution clients with various valuation needs as well as transaction advisory services.
2024 Recap: Bank Stock Performance
After the twin shocks of rapidly rising interest rates in 2022 and regional bank failures in 2023, community and regional bank stocks finally staged a recovery in 2024. The S&P Small Cap Bank index appreciated by 15% in 2024 (see Figure 1) but nevertheless remains 4% below the level at year-end 2021. Mid-cap and large-cap banks outperformed small-cap banks, which is attributable to expectations of better net interest margin performance, M&A opportunities, and capital markets activity among the largest banks.
Figure 1
What Goes Down…
Figure 2 provides a stratification of bank stock price changes. In our year-end 2023 bank stock performance recap, we noted that 36% of banks experienced year-over-year stock price appreciation in 2023. This improved to 74% of banks in 2024. The median bank reported share price appreciation of 12% in 2024. Index returns occasionally can be biased by unusual factors influencing component companies, such as the bank failures in 2023. Focusing on the change in share price performance for the median bank provides another perspective.
Figure 2
Figure 3 illustrates stock price performance in 2024, as stratified by asset size. Nearly all banks with assets over $100 billion (95% of all such banks) reported positive share price appreciation in 2024, with a median appreciation of 28%. For the very largest banks, this reflects the strength of their capital markets businesses, which performed well in 2024 due to both a strong backdrop for trading and capital raising while M&A advisory was better vs 2023 but not booming. The outlook for 2025 assumes the deregulatory inclination of the Trump Administration will support the large banks’ consumer units and M&A advisory fees as corporate M&A presumably increases.
Figure 3
Banks with assets below $5 billion reported weaker performance, with approximately 70% reporting higher stock prices at year-end 2024 and a median share price change of 8% to 10%. Margin compression remained a challenge for many banks in this group, and many are burdened with low yielding assets that will constrain their 2025 net interest margin and return on assets.
Figure 4 repeats the analysis in Figure 3 but covers the entire rising rate cycle, beginning from year-end 2021. Despite significant capital accumulation over this period, the median bank reported a share price change of exactly 0%. It is notable that this period of weak performance occurred in the absence of significant credit costs. In one sense, bank investors are fortunate, as adding higher credit costs to a period marked by significant NIM pressure would have been much more stressful.
Figure 4
The weakest performance was among banks with assets of less than $1 billion, which reported a median share price change of negative 14% from 2021 to 2024. Some of these banks may face pressure from investors to consider strategic alternatives.
We have noted in prior years the correlation between net interest margin management and share price performance. This trend continued in 2024, with share prices rising by only 4% for banks with NIM compression between the fourth quarter of 2023 and third quarter of 2024 versus 14% for banks with NIM expansion (see Figure 5).
Figure 5
EPS Estimates & Valuation
Analysts expect EPS to decline by 8% in 2024, relative to the prior year (see Figure 6), but are much more optimistic for 2025 and 2026. The estimates do not appear far-fetched, assuming a few basis points of net interest margin expansion, expense control, and low credit costs. Some bugaboos remain, though. Short-term rates may remain higher for longer, limiting NIM expansion for banks with higher funding costs and substantial legacy fixed rate assets. Credit issues remain a concern for low rate loans, with maturities and repricing dates moving ever closer. While boosting earning asset yields, maturities and repricings of loans from the 2020 and 2021 vintages may come at the cost of higher credit costs. This effect may become more evident, if it occurs at all, in 2025 as the loans from the 2020 vintage with five year terms mature or reprice.
Figure 6
Figure 7 illustrates historical price/one-year forward earnings and price/tangible book value multiples. The median P/E multiple was 11.5x at year-end 2024, which is consistent with the long-term average. Although the effect of Trump’s deregulatory policies on bank valuations is unquantifiable, the market data would suggest that future bank stock returns will be driven by EPS growth rather than P/E multiple expansion.
Figure 7
Conclusion
An inflection point occurred in 2024, with both net interest margins and stock prices reaching a base from which expansion can occur. With NIM expansion proving a tailwind, for the banks in our analysis, EPS growth in 2025 should be positive for the first time since 2022. However, many banks remain burdened with excessive assets originated in the 2020 and 2021 vintages, which will restrain the normalization in return on assets towards historical levels. While credit costs are expected to remain benign, analysts’ EPS estimates contain little cushion in the event of asset quality deterioration. Finally, broad market indices, such as the NYSE or Nasdaq, are richly valued. A pull back in these indices may drag down bank stock prices too.
6 Ways to Evaluate Business Value
Along the road to building the value of a business it is necessary, and indeed, appropriate, to examine the business in a variety of ways. Each provides unique perspective and insight into how a business owner is proceeding along the path to grow the value of the business and if/when it may be ready to sell. Most business owners realize the obvious events that may require a formal valuation: potential sale/acquisition, shareholder dispute, death of a shareholder, gift/estate tax transfer of ownership, etc. A formal business valuation can also be very useful to a business owner when examining internal operations.
So, how does a business owner evaluate their business? And how can advisers or formal business valuations assist owners examining their businesses? There are at least six ways and they are important, regardless of the size of the business. All six of these should be contemplated within a formal business valuation.
1. At a Point in Time
The balance sheet and the current period (month or quarter) provide one reference point. If that is the only reference point, however, one never has any real perspective on what is happening to the business.
2. Relative to Itself over Time
Businesses exhibit trends in performance that can only be discerned and understood if examined over a period of time, often years.
3. Relative to Peer Groups
Many industries have associations or consulting groups that publish industry statistics. These statistics provide a basis for comparing performance relative to companies like the subject company.
4. Relative to Budget or Plan
Every company of any size should have a budget for the current year. The act of creating a budget forces management to make commitments about expected performance in light of a company’s position at the beginning of a year and its outlook in the context of its local economy, industry and/or the national economy. Setting a budget creates a commitment to achieve, which is critical to achievement. Most financial performance packages compare actual to budget for the current year.
5. Relative to its Unique Potential
Every company has prospects for “potential performance” if things go right and if management performs. If a company has grown at 5% per year in sales and earnings for the last five years, that sounds good on its face. But what if the industry niche has been growing at 10% during that period?
6. Relative to Regulatory Expectations or Requirements
Increasingly, companies in many industries are subject to regulations that impact the way business can be done or its profitability.
Why is it important to evaluate a company in these ways? Together, these various ways of examining a company provide a roadmap for business owners and key managers to continuously reassess and adjust their performance to achieve optimal results.
The Elements of a Quality Business Valuation: A Guide for Estate Planners
In the course of a business valuation practice, a business appraiser may either be involved in an examination of an opinion that they have issued or serve as a consulting expert to assist legal counsel in an opinion issued by an unaffiliated business appraiser.
While an accepted-as-filed resolution of an independent and objective opinion of value for a federal tax matter is the desired outcome, an IRS examination also provides an opportunity for appraisers to critically evaluate their work, and, in so doing, strengthen future work product.
As Mercer Capital is frequently requested to provide expert consulting services related to federal tax valuation matters under examination, this issue of Value Added® explores the elements of a quality valuation that increase the prospects of a favorable resolution of an examined matter, or the desired accepted-as-filed outcome at an initial reporting stage.
Elements of a Quality Valuation
Quality business valuations possess four common elements:
- Identification of the rights and benefits of the business interest being valued;
- Relevant and sufficient capital market evidence;
- Sound financial analysis; and,
- Effective reporting to the intended audience.
Identification of the Rights & Benefits of the Business Interest
Fundamental to any sound valuation is a thorough understanding of the rights and benefits of the business interest being valued.
Most often this involves a close review of the basic governance documents of the business such as corporate articles of incorporation and bylaws, partnership or limited liability operating agreements, buy/sell agreements, and additional legal documents that address the rights and benefits related of the subject business interest. Absent formal governance documents, relevant statutory provisions in the entity’s state of domicile provide this guidance. This guidance directs the appraiser as to the appropriate level of value for the assignment, i.e., controlling interest, minority interest or veto block interest.
While it is not the role of the business appraiser to be the ultimate arbiter of the legal rights and benefits related to the interest, it is the responsibility of the appraiser to have as complete an understanding as they can of these defining attributes. In cases of ambiguous governance documents or situations of default to statutory provisions, assistance from legal counsel is warranted to provide legal direction as to the attributes of an interest.
Once a complete understanding of the legal rights and benefits of the interest is gained, it is critical for the business appraiser to keep this understanding at hand throughout the appraisal process and report on this understanding in a concise and clear manner.
Relevant and Sufficient Capital Market Evidence
A cornerstone of every sound opinion of value resides in the capital market evidence that is relied upon for its support. Relevancy and sufficiency are two essential concepts for consideration in evaluating capital market evidence.
Relevance
The relevance of capital market evidence is a key component of the valuation of interests in privately held businesses, as often there is a dearth of pertinent capital market evidence related to the interest being valued. This reality illustrates the inherent challenge associated with the valuation of privately held business interests; by definition financial and transactional information related to private businesses is most often not in the public domain. As a consequence, business appraisers frequently look to capital market evidence related to publicly traded businesses to find the capital market evidence necessary to support their opinion. Material differences between the subject business interest and the capital market evidence relied upon must be reconciled and explained.
Sufficiency
Sufficiency is the second core concept related to capital market evidence. The time-tested adage that “one sale does not make a market” certainly applies.
Often, the business appraiser is faced with a scenario of capital market evidence of limited quantity. In such instances the appraiser should expand search parameters in order to obtain capital market evidence with similar investment risk attributes as the subject interest.
A default to the opinion based on the personal experience of the appraiser without sufficient market evidence will be subject to intensive scrutiny, and quite likely, may be considered a failure of the opinion for its intended use.
Sound Financial Analysis
Thorough and sound financial analysis is crucial to any supportable valuation. The fundamental valuation principle is that the value of a business is a function of three components: (1) expected cash flows, (2) risk profile, and (3) growth prospects.
Expected Cash Flows
Identifying and estimating the expected cash flows of a business requires careful consideration of historical financial results, anticipated economic and industry conditions, and the capital needs of the business (a more exhaustive list of data and factors that should be considered is included in IRS Revenue Ruling 59-60).
Risk
An evaluation of the risk profile of a business cannot be done without understanding the key drivers of the business. A business is subject to and impacted by a litany of factors including market risks, operational risks, and financial risks that must be evaluated.
Growth
An appraiser’s assessment of growth prospects should consider growth due to market share, growth of the market, growth from profitability, and the sustainability of each.
Business appraisers should conduct robust financial analyses and due diligence to evaluate these three components, and quality appraisals will provide sound and reasonable support for the concluded estimates of each.
Effective Reporting to the Intended Audience
The most important aspect of the valuation may well be how effectively the appraiser communicates to the intended audience of the valuation report.
For federal transfer tax valuation matters, the intended audience consists of estate planning and tax attorneys as well as Internal Revenue Service trust & estate examining attorneys.
For federal income tax matters the intended audience consists of tax attorneys, certified public accountants, enrolled agents and Internal Revenue Service agents, typically individuals with an accounting and tax background.
As the readers of a valuation report may be more verbally rather than numerically oriented, a valuation report prepared for a transfer tax matter should be written in a communication style and structure that matches this orientation. In contrast, it may be more appropriate for reports prepared for income tax matters to have a quantitative tilt.
Conclusion
While the examination of a federal tax valuation matter can be a challenging exercise laden with complexity, past examination experience also provides opportunities to focus on the fundamentals of the valuation process that underlie a quality valuation.
Adherence to the concepts presented in this article will improve the likelihood of accepted-as-filed outcomes as well as place the valuation work product in a position of strength in the event of an examination.
At Mercer Capital, we diligently incorporate each of the four elements of quality valuations into our reports. To discuss your valuation need on a confidential basis, please contact one of our professionals.
Bank M&A 2024 — Off the Bottom
In our year ago M&A epistle, we speculated that activity would improve and that a related theme could be equity recap transactions. The prediction was hardly heroic because M&A activity in 2023 represented a multi-decade low, while low public market multiples for a small subset of banks with high CRE exposure signaled investor expectations that an equity infusion was possible.
M&A activity rose off the bottom in 2024, but not by much while pricing remained modest by historical standards. There were 126 transactions as of December 23 that equated to 2.7% of January 1 bank charters compared to the multi-decade low of 101 transactions in 2023 (2.1%). Transactions with a disclosed value increased to 54 with an aggregate value of $16.8 billion from 26 deals in 2023 ($4.2 billion), though the aggregate value this year was the sixth lowest since 1990.
There were two notable equity recaps (Flag Financial, NYSE: FLG; First Foundation, NASDAQ: FFWM) and lots of equity raises to fund balance sheet restructurings, including a $2.8 billion equity raise by KeyCorp (NYSE: KEY). We look for more equity raises in 2025.
The set-up as of year-end 2024 is for much more M&A activity in 2025.
- Institutional investors have supported M&A by funding nine common raises buyers undertook to strengthen post-closing capital ratios.
- Bank stocks as acquisition currencies improved as P/E multiples have expanded to 11-13x consensus 2025 estimates compared to 9-11x consensus 2024 estimates last year.
- Earnings are expected to improve in 2025 after two years of contraction for many banks as NIMs stabilize or improve while credit costs increase only modestly.
- The incoming Trump Administration is expected to pursue policies that are business friendly, including the appointment of bank regulators who nix or modify a range of burdensome regulatory edicts and more quickly approve merger applications.
How much, if any, M&A activity accelerates with or without improved pricing in 2025 remains subject to multiple variables as always. The economy and bank credit quality are in good (or good enough) shape and public market multiples have improved.
Also, spreads on high-yield bonds and leverage loans are tight at multi-year lows, reflecting investor optimism about credit quality for the time being. The corollary is that credit marks for most sellers were limited compared to the existing loan loss reserve before factoring in the CECL “double counting” reserve build.
Figure 1 – National Bank M&A Activity
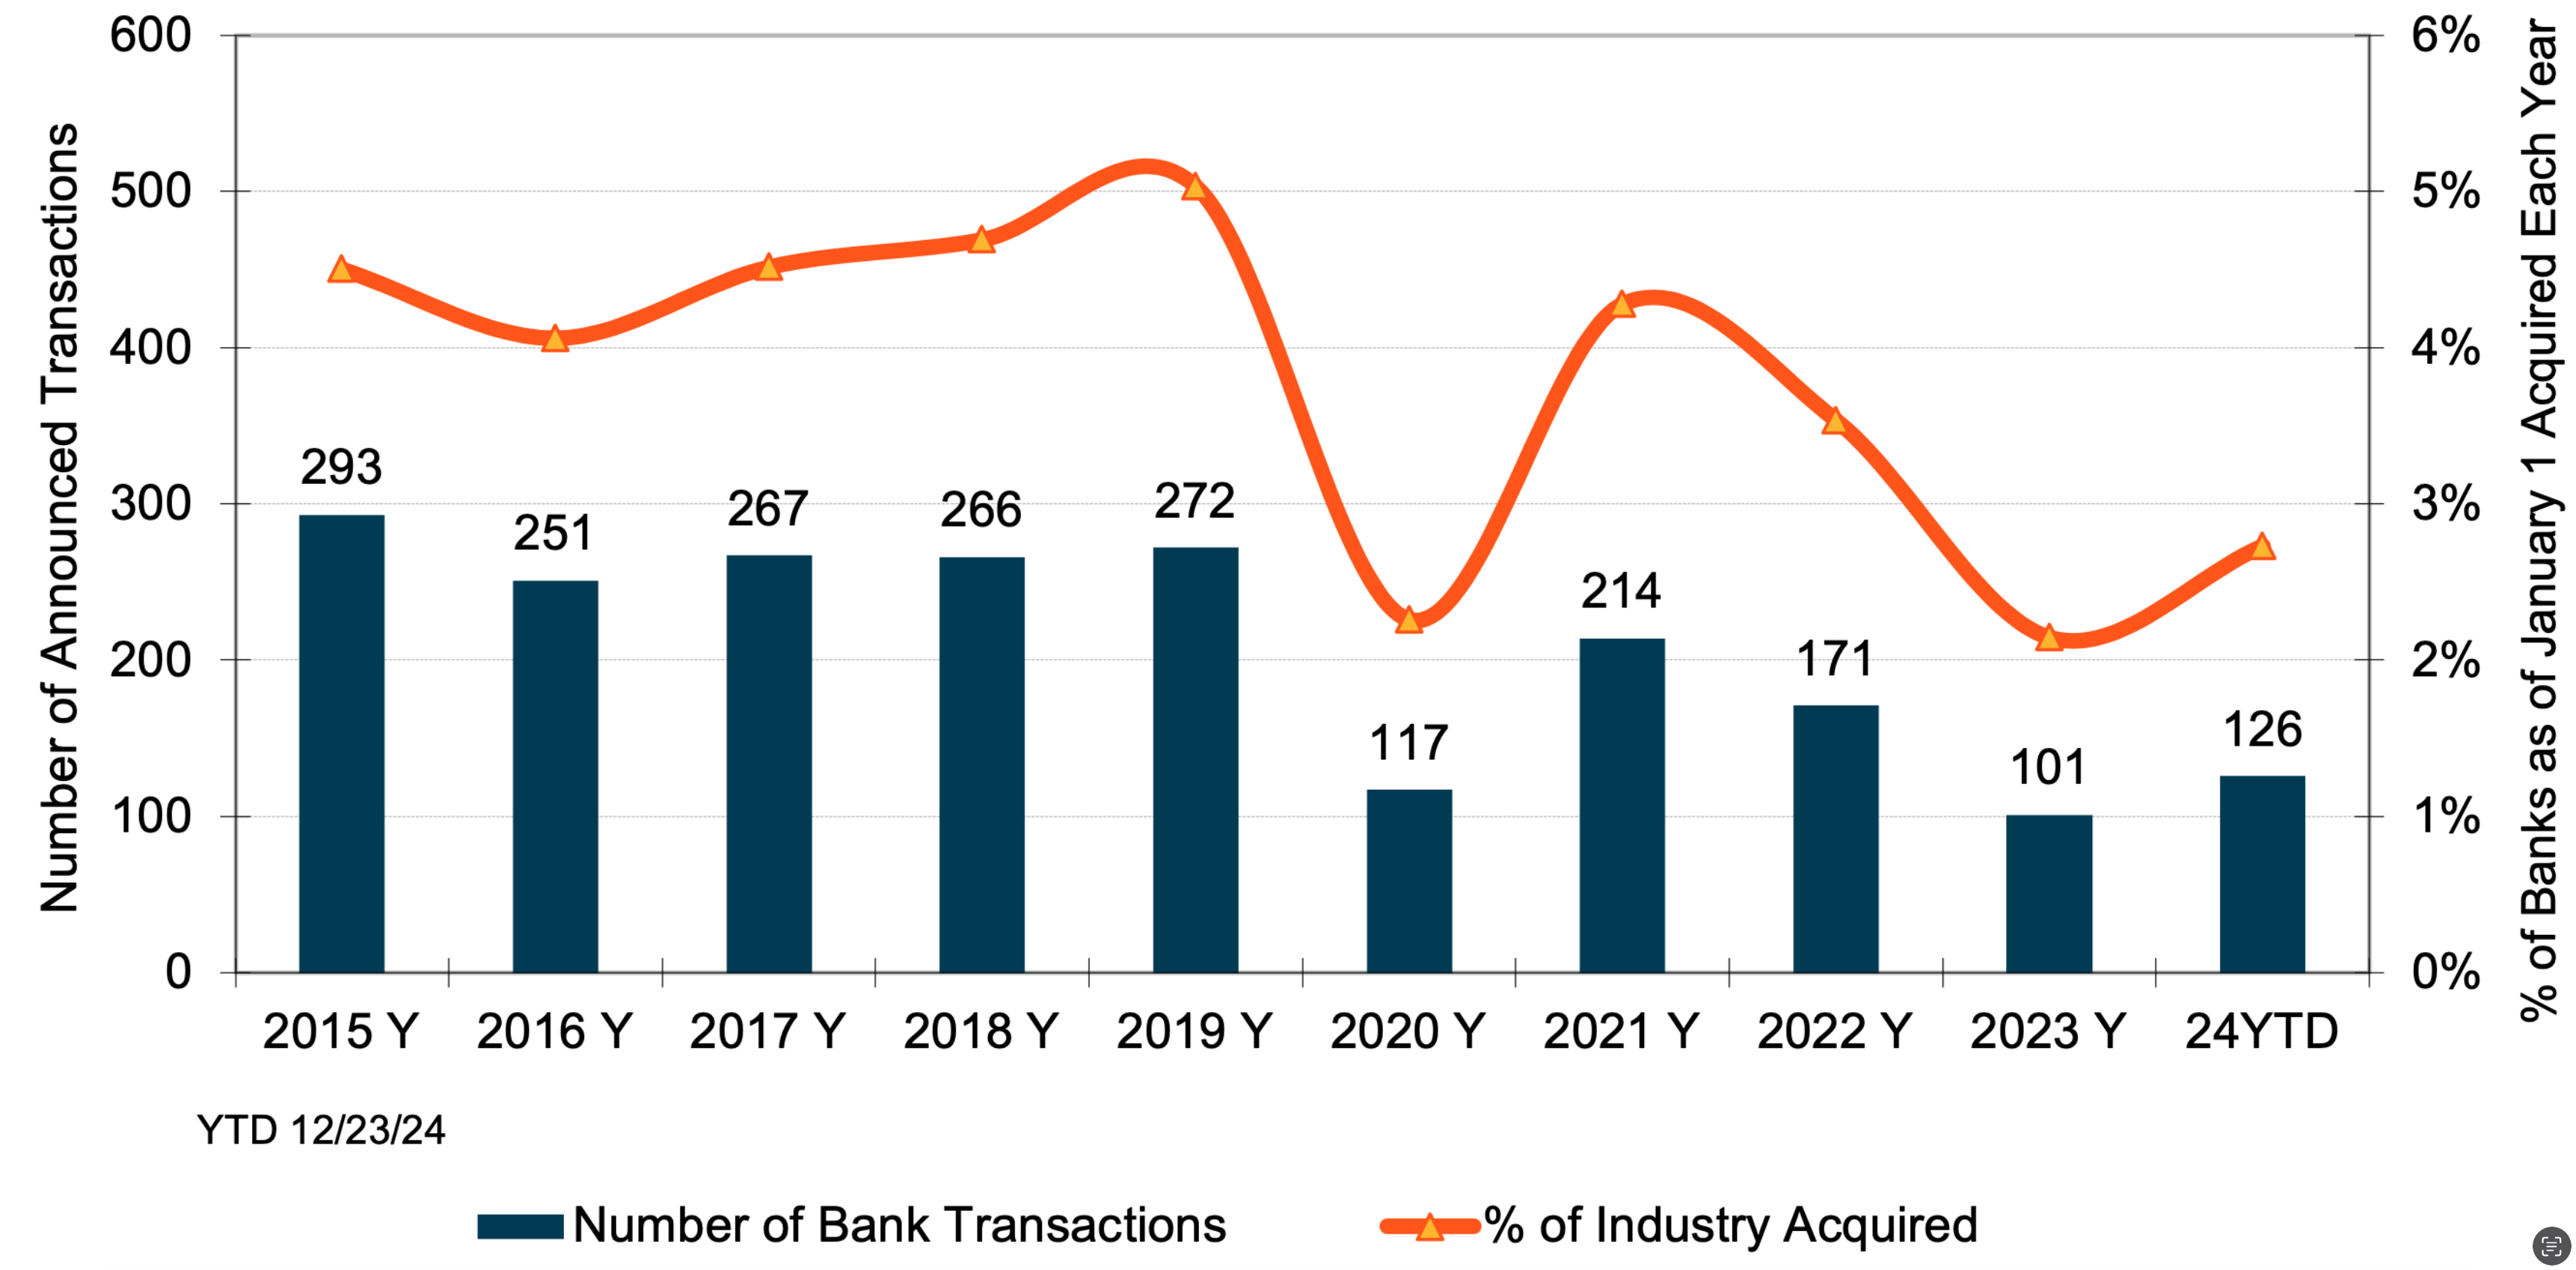
However, there is one roadblock that remains: the bond market. Since the first Fed rate cut in mid-September, yields along the belly and long-end of the UST curve have increased 60-80bps with yields approaching the October 2023 cycle highs. Mark-to-market of would-be sellers fixed-rate loan and bond portfolios is a much greater pricing hurdle for buyers and sellers than was the case in September as unrealized losses are, in effect, realized as far as merger accounting is concerned.
The “why” market determined rates have risen could impact bank M&A activity, too. If rising rates signal an expected strengthening in the economy, then lending and bank earnings should improve, which would support M&A. Alternatively, M&A activity may remain depressed if rising rates signal more inflation, which in turn probably would weigh on public market P/E multiples.
Multi-Decade Low Pricing (x-GFC Years)
As shown in Figure 2, the average M&A P/TBV multiple declined to 120%, a multi-decade low excluding the post-GFC clean-up years of 2009-2012. The post-GFC peak average multiple of 174% occurred in 2018 as public market multiples expanded in 2017 with the reduction in corporate tax rates and then gradually rising short-term rates that caused NIMs to expand without much mark-to-market drawbacks. Since then, multiples have trended lower as the flat yield curve of 2019 gave way to COVID in 2020, sharply rising rates in 2022, the failure of SVB in March 2023 and a deeply inverted yield curve that only recently un-inverted.
Figure 2 – National Average M&A Multiples
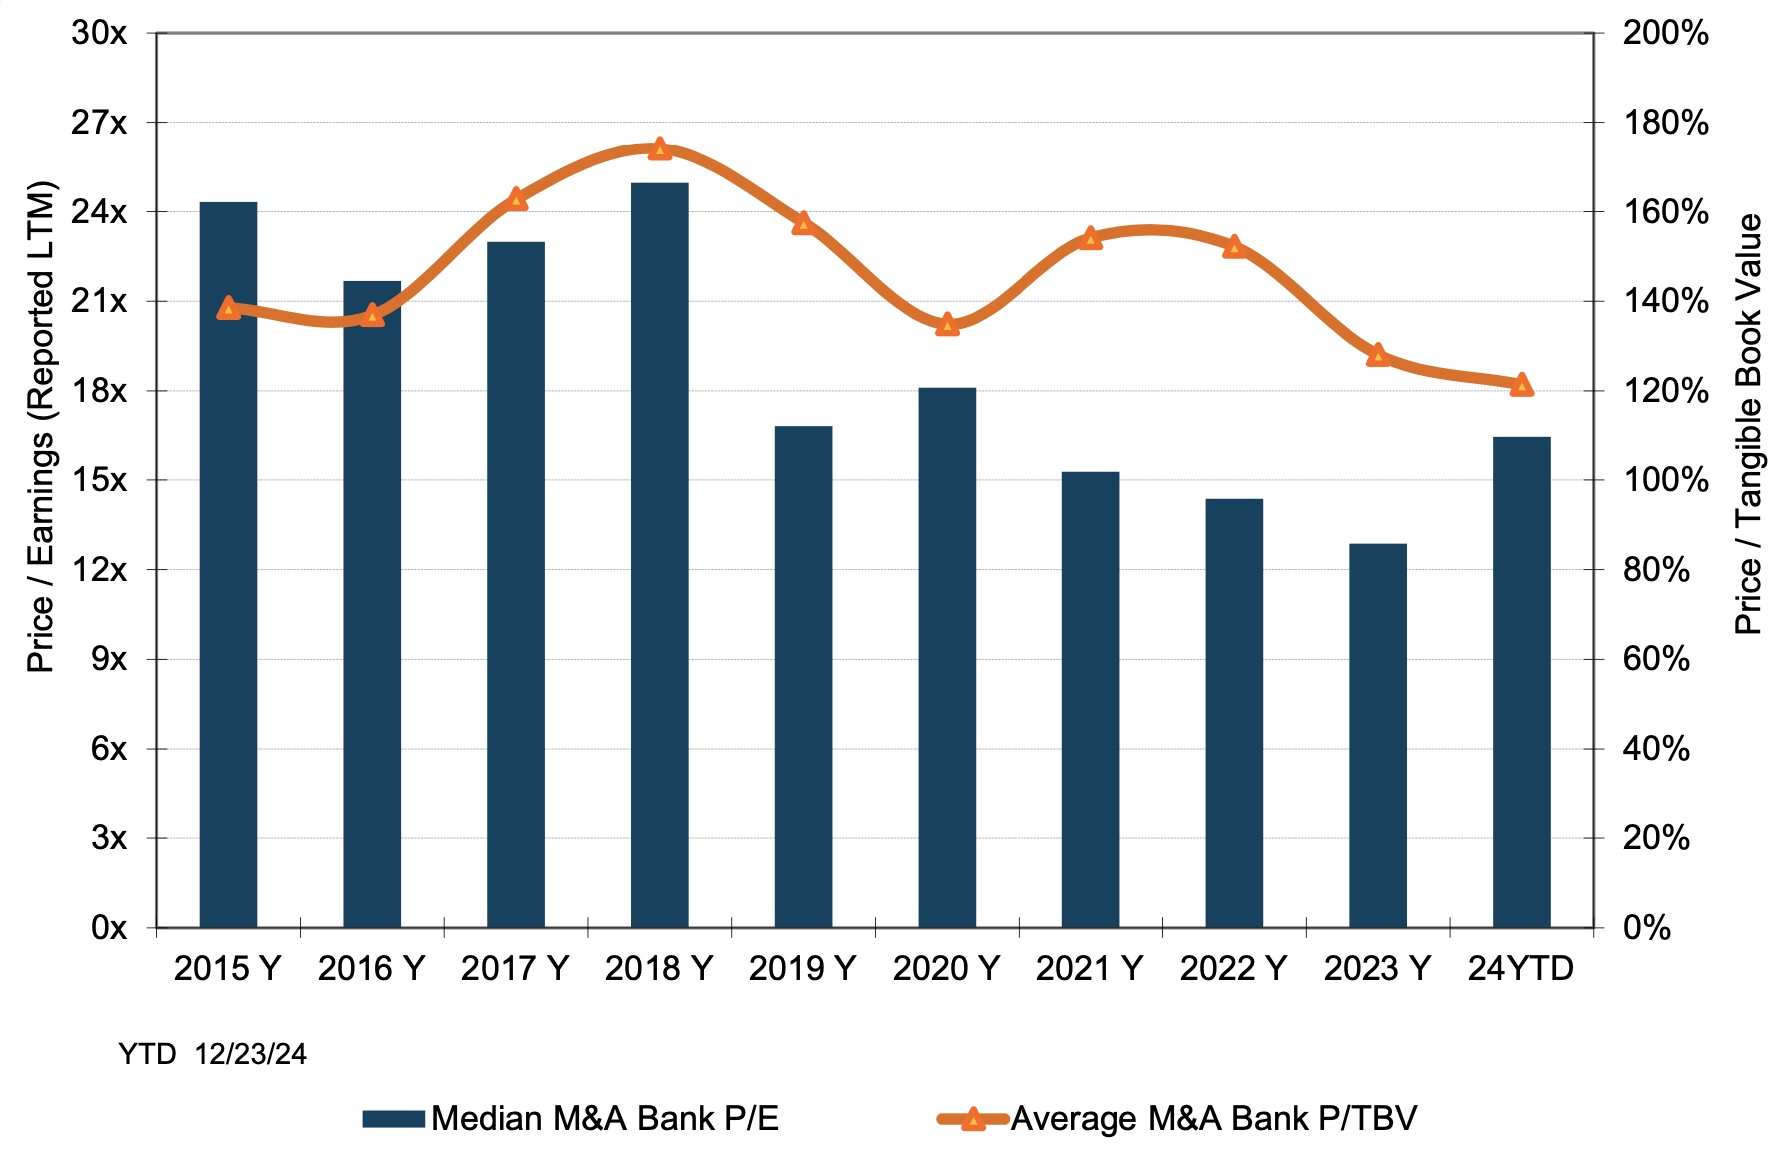
The median P/E improved to 16.4x in 2024 from 12.9x in 2023 largely because sellers had lower profitability as reflected in reported trailing 12-month earnings vs 2023 sellers whose earnings reflected higher NIMs. Regardless, buyers are focused on proforma earnings as measured by the sum of core earnings plus after-tax expense savings. Generally, proforma P/Es are in the range of 6x to 9x when buyers are public and report the metric to investors though pricing has tended toward (or below) 6x for community bank sellers the past two years.
Modest multiples inclusive of expense saves are necessary to generate EPS accretion, and EPS accretion is necessary to recoup day one dilution to TBVPS. Since the GFC, investors have been intensely focused on the time to recover TBVPS dilution as a means to limit buyers’ pricing flexibility. Our take on current pricing is that investors want recovery in 2-3 years, in part because there is too much uncertainty about future EPS accretion vis-à-vis certainty about day one dilution.
Figure 3 – Notable Deals with Common Raises
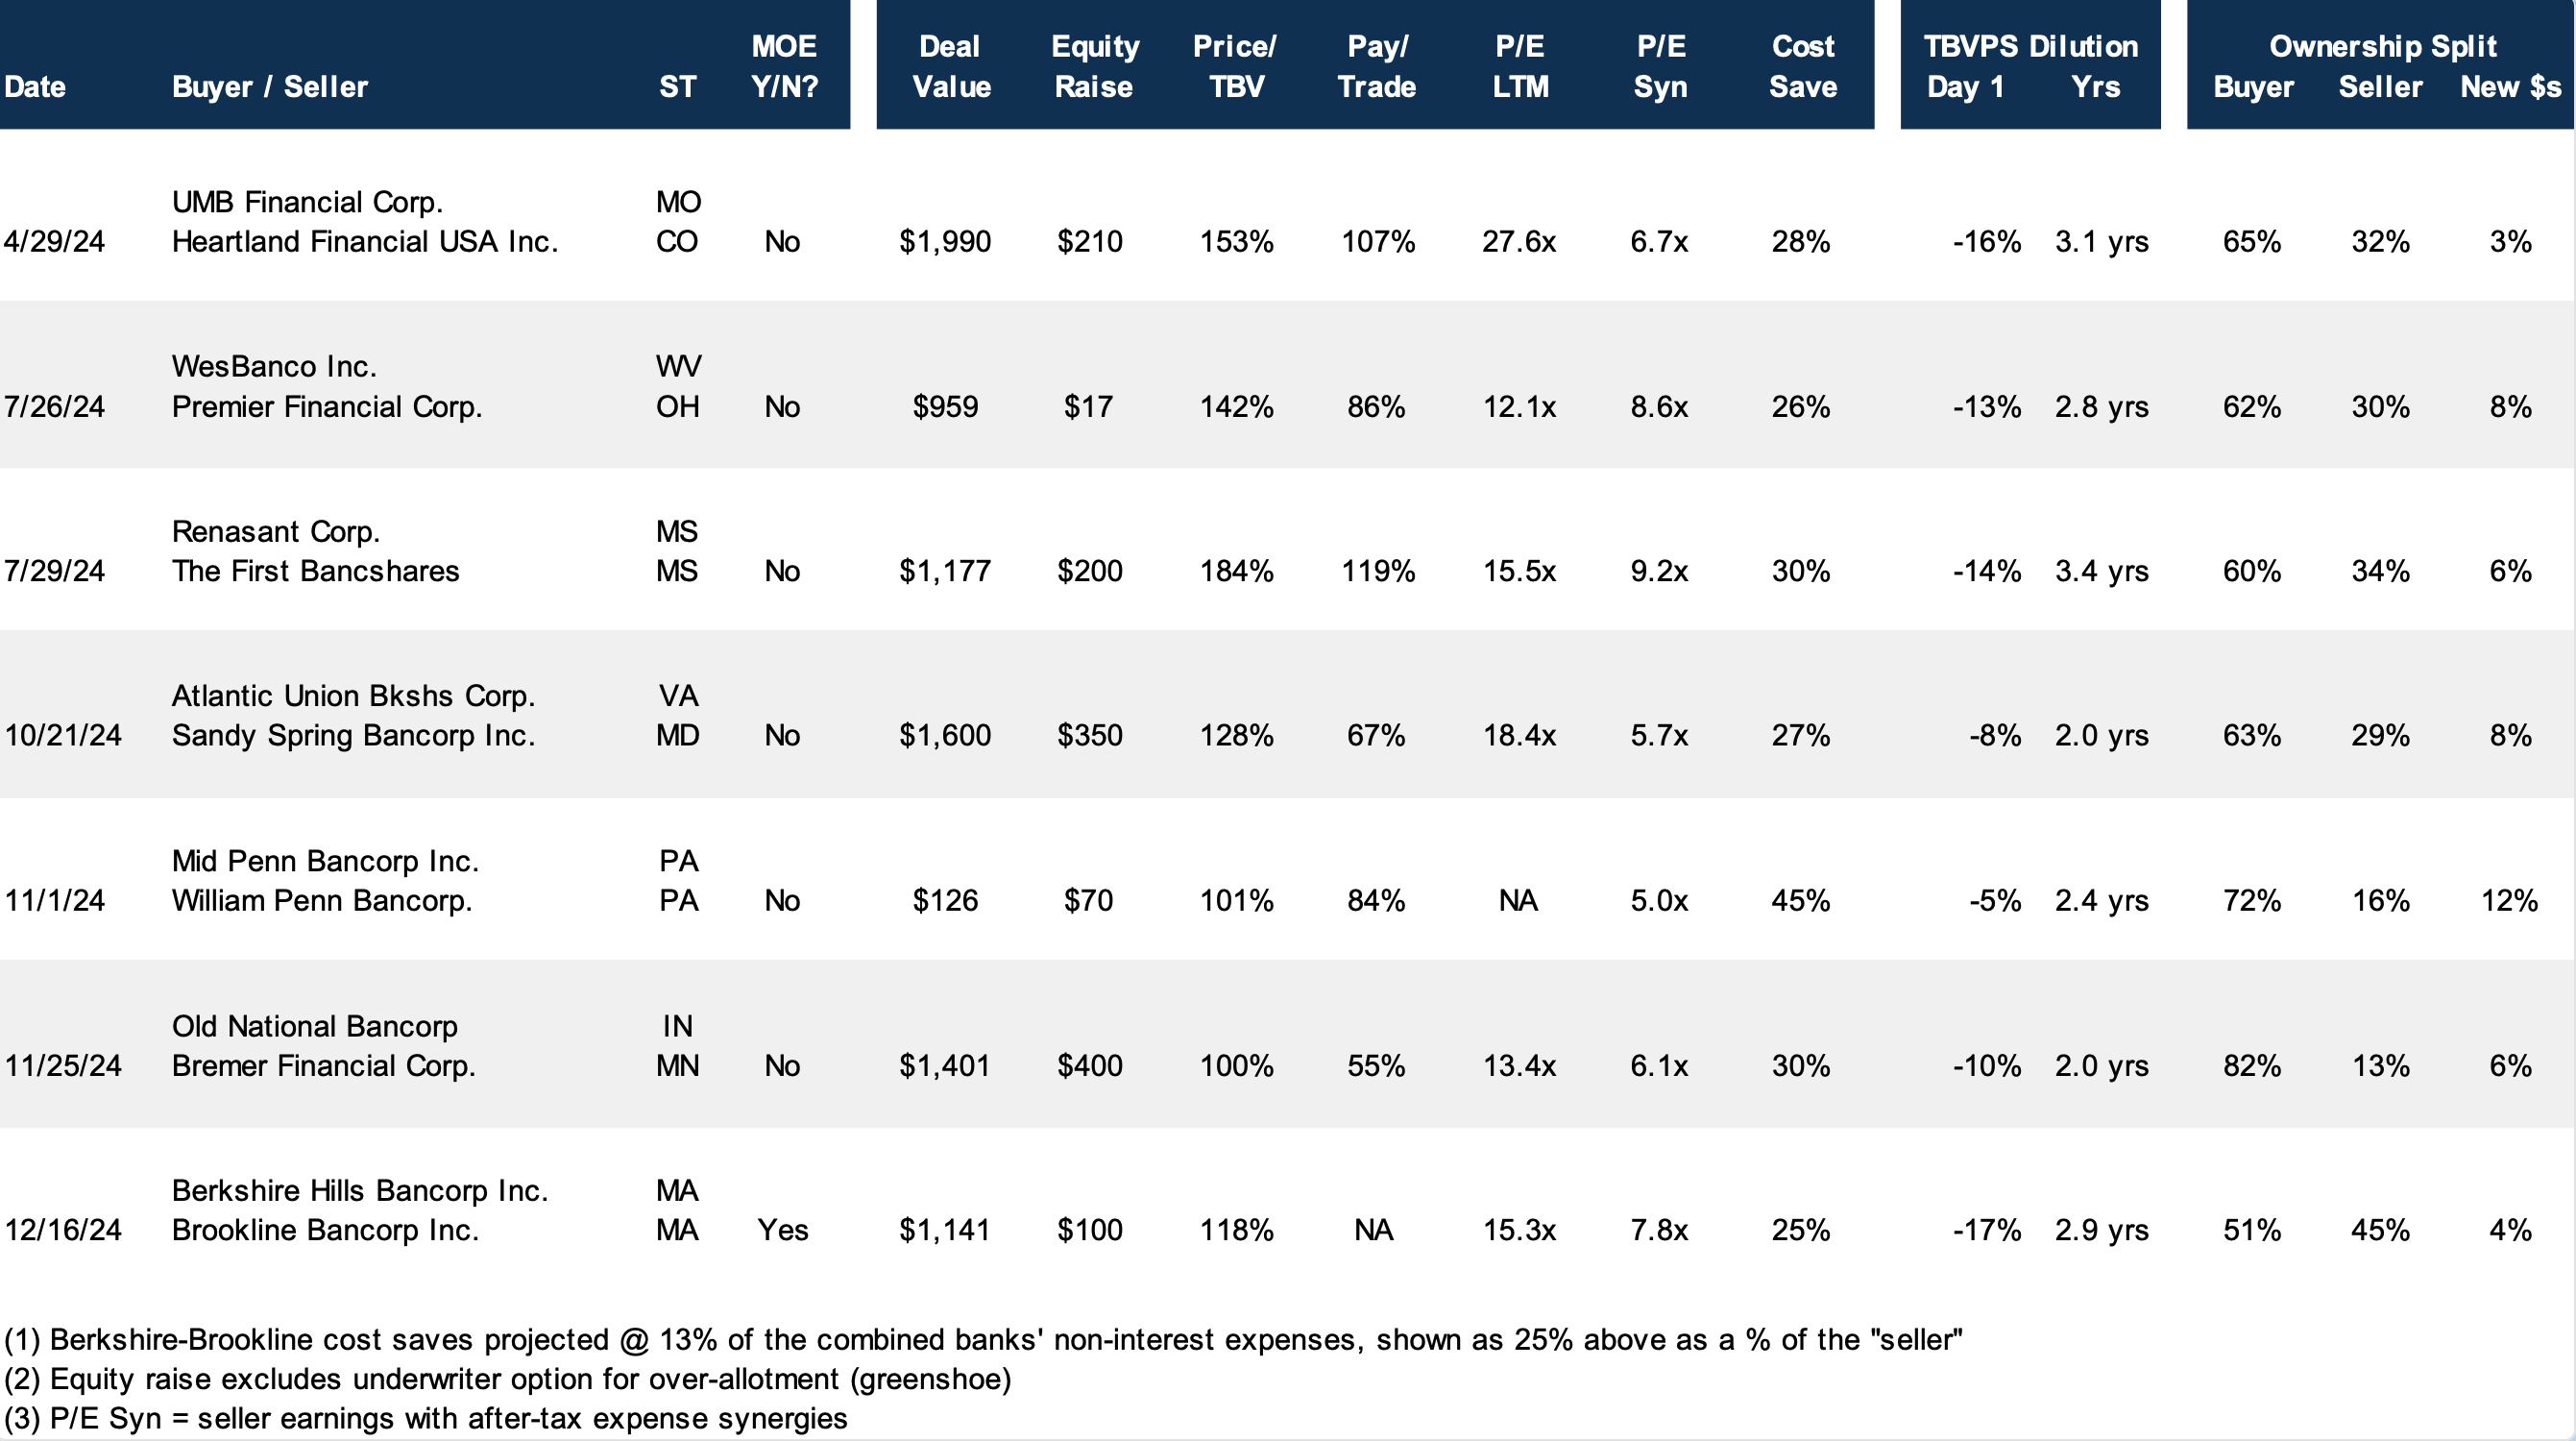
Click here to expand the image above
Institutional Investor Sentiment Improves
The bear market of 2022-3Q23 gave way to a bull market in 4Q23 that improved investor sentiment and provides a foundation for a better M&A market in 2025 if bank stocks hold gains or improve further (see Figure 4). Large banks as measured by the S&P 500 Bank Index rose 34% year-to-date through December 23 as investors reassessed the potential for large bank M&A in the Trump Administration overlaid with business models that are more geared to the booming capital markets. Among smaller bank indices, the NASDAQ Bank and KBW Regional Bank indices rose 17% and 10%, respectively.
Although M&A pricing was subdued in 2024, we view the willingness of institutional investors to provide buyers equity at a 4-5% discount to the market as a notable positive that underpins support for transactions that are appropriately priced and structured. Generally, the capital is needed to offset day one dilution to the tier one common equity capital ratio that otherwise would be recovered via earnings within several years and/or reduce the proforma CRE/capital ratio.
Another encouraging data point from 2024 was the market reaction to perennial acquirer Old National Bancorp (NYSE: ONB) when it announced the acquisition of Minneapolis-based Bremer Financial Corp. for $1.4 billion of stock and cash on November 25. ONB’s shares rose 6% on the announcement that entailed pricing around BFC’s tangible book value (though not marked TBV), the sale of CRE loans, and a $400 million common raise. Positive reactions encourage activity just as negative reactions are a hurdle.
Public Market Multiples vs Acquisition Multiples
Figure 4, compares the annual average P/TBV for banks that were acquired for $50 million to $250 million with the average daily public market multiple each year for the SNL Small Cap Bank Index. The chart illustrates the point that acquisition pricing is highly correlated with public market multiples.
Figure 4 – Average Annual M&A P/TBV vs Public Market P/TBV
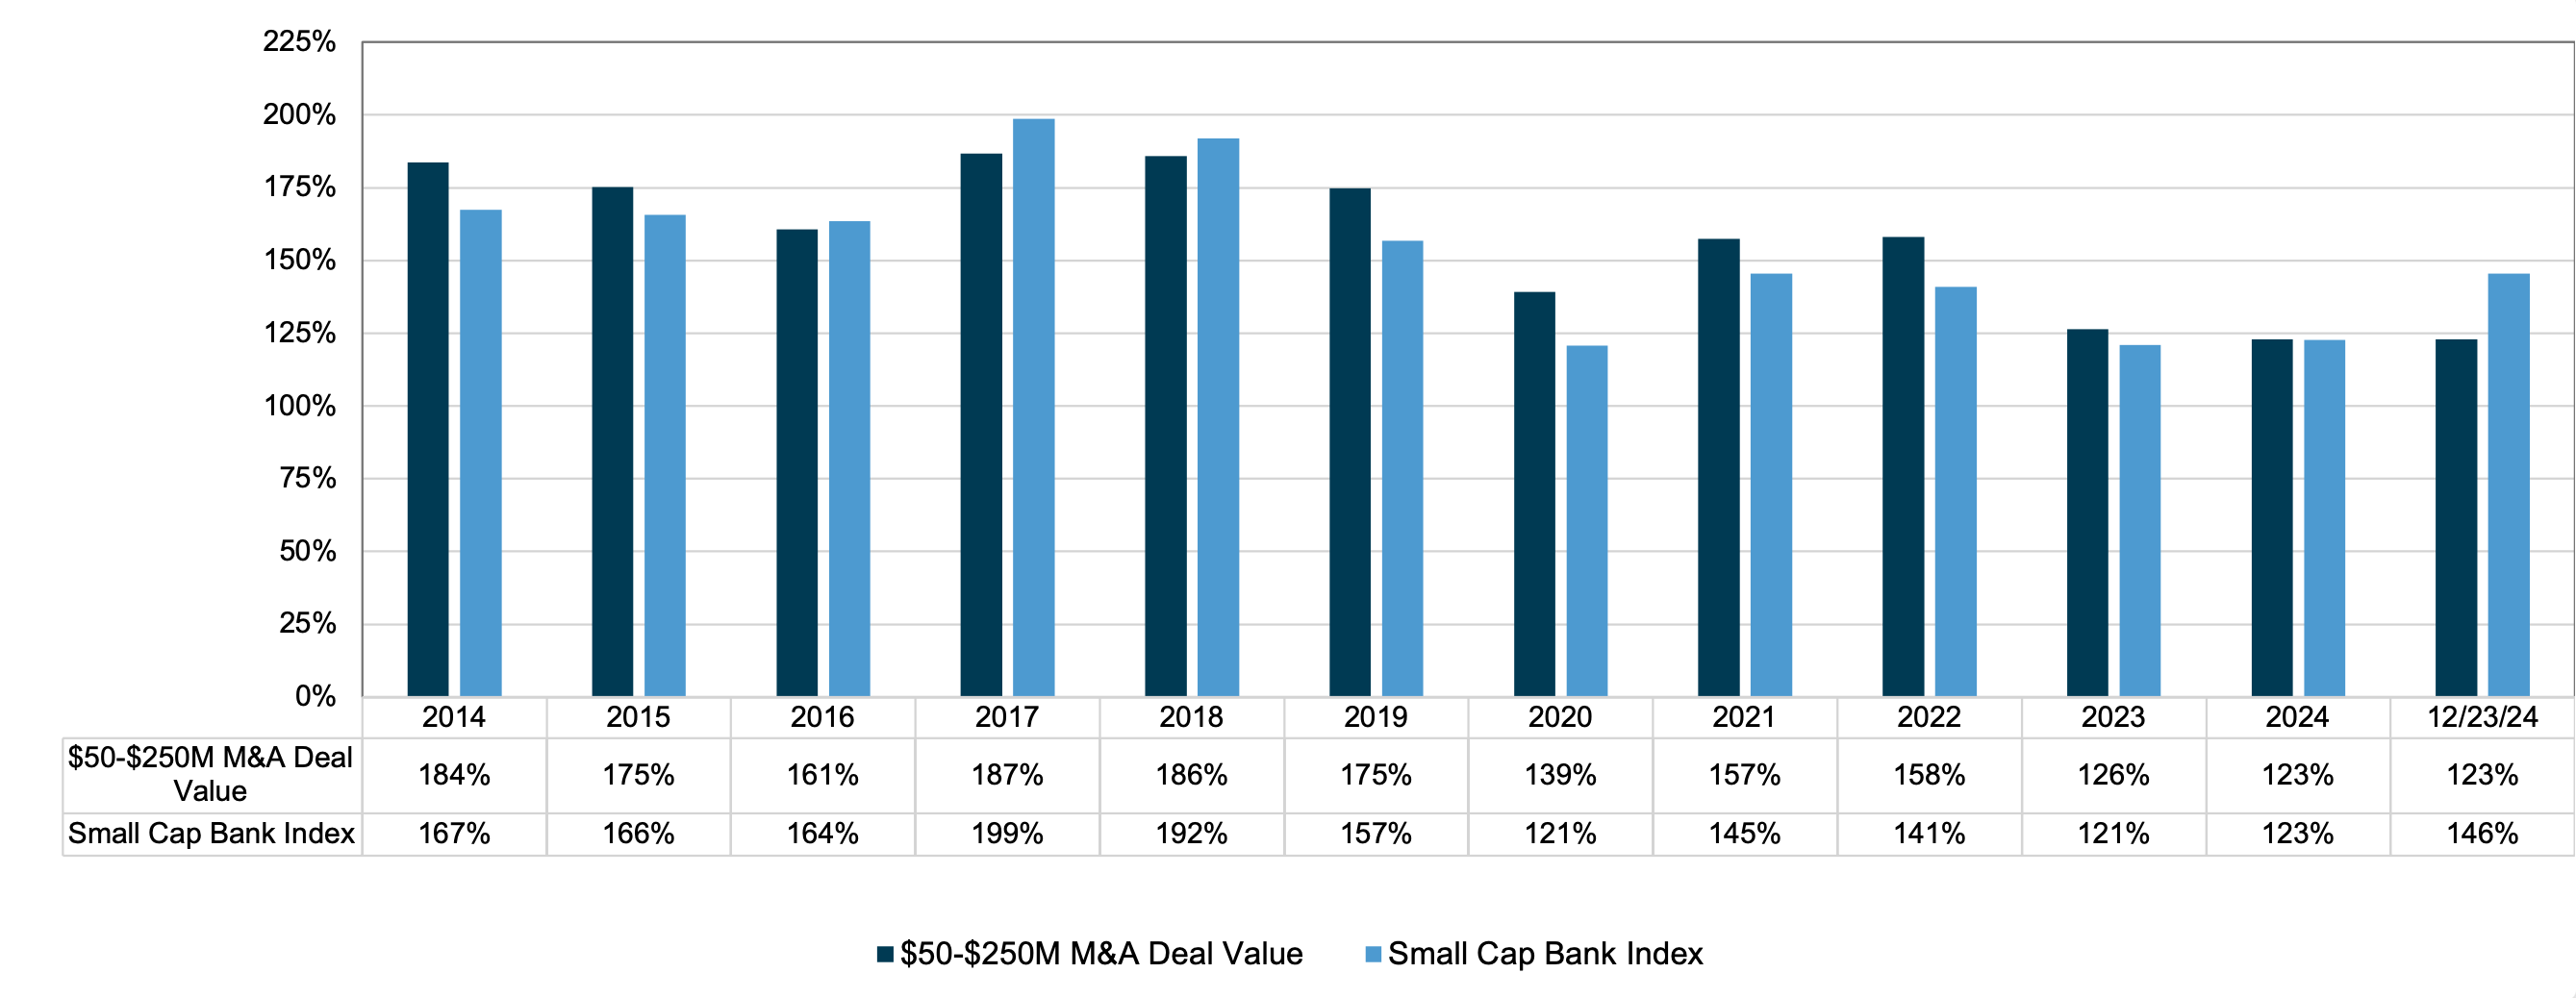
Click here to expand the image above
Buyers measure this differential as the pay-to-trade ratio, which is the market-based measurement of the book-to-book ratio when the seller marked equity for known problem loans not covered in the loan loss reserve, appreciated assets, contingent liabilities and the like. Generally, transactions that involve a publicly traded buyer will entail a pay-to-trade multiple in the vicinity of 80% to 95% though sometimes a multiple above 100% may be observed when the seller’s earning power may be understated, or strategic considerations cause the buyer to step up.
Although not shown, pay-to-trade ratios when based upon the seller’s proforma P/E with expense saves vs the buyer’s P/E should be well below 1.0x, otherwise there would be no EPS accretion and no recovery of day one dilution to the buyer’s TBVPS.
The Exchange Ratio vs “Price”
While investors are focused on price, it is worth noting that the central issue in M&A is the exchange ratio rather than price when the sole or primary consideration is shares of the buyer. Price is a function of the buyer’s share price, which fluctuates daily, and the exchange ratio. Whether the buyer’s shares are reasonably priced is a separate issue to consider. Nonetheless, sellers who transacted in 2023 and 2024 may have been disappointed by pricing vs the pre-COVID years but likely received shares that were attractively priced that performed well during 2H24. Likewise, buyers who transacted in 2018 may have encountered the opposite situation. The outlook for 2025 seems to fall somewhere between the two as of late year 2024.
About Mercer Capital
M&A entails a lot of moving parts of which “price” is only one. It is especially important for would be sellers to have a level-headed assessment of the investment attributes of the acquirer’s shares to the extent merger consideration will include the buyer’s common shares. Mercer Capital has 40 years of experience in assessing mergers, the investment merits of the buyer’s shares and the like. Please call if we can help your board in 2025 assess a potential strategic transaction.
Anatomy of Volatility: Evolent (EVH)
In our Q3 newsletter, we noted that Evolent Health, Inc. (NYSE:EVH) reported a large quarterly drop in stock price during 2Q24. Over 3Q24, EVH made up almost all of the ground lost in 2Q24 as the stock price increased by around 48%. However, the stock has languished since, closing on December 13 down almost 60% from the end of the third quarter.
Evolent Health, Inc. Stock Chart
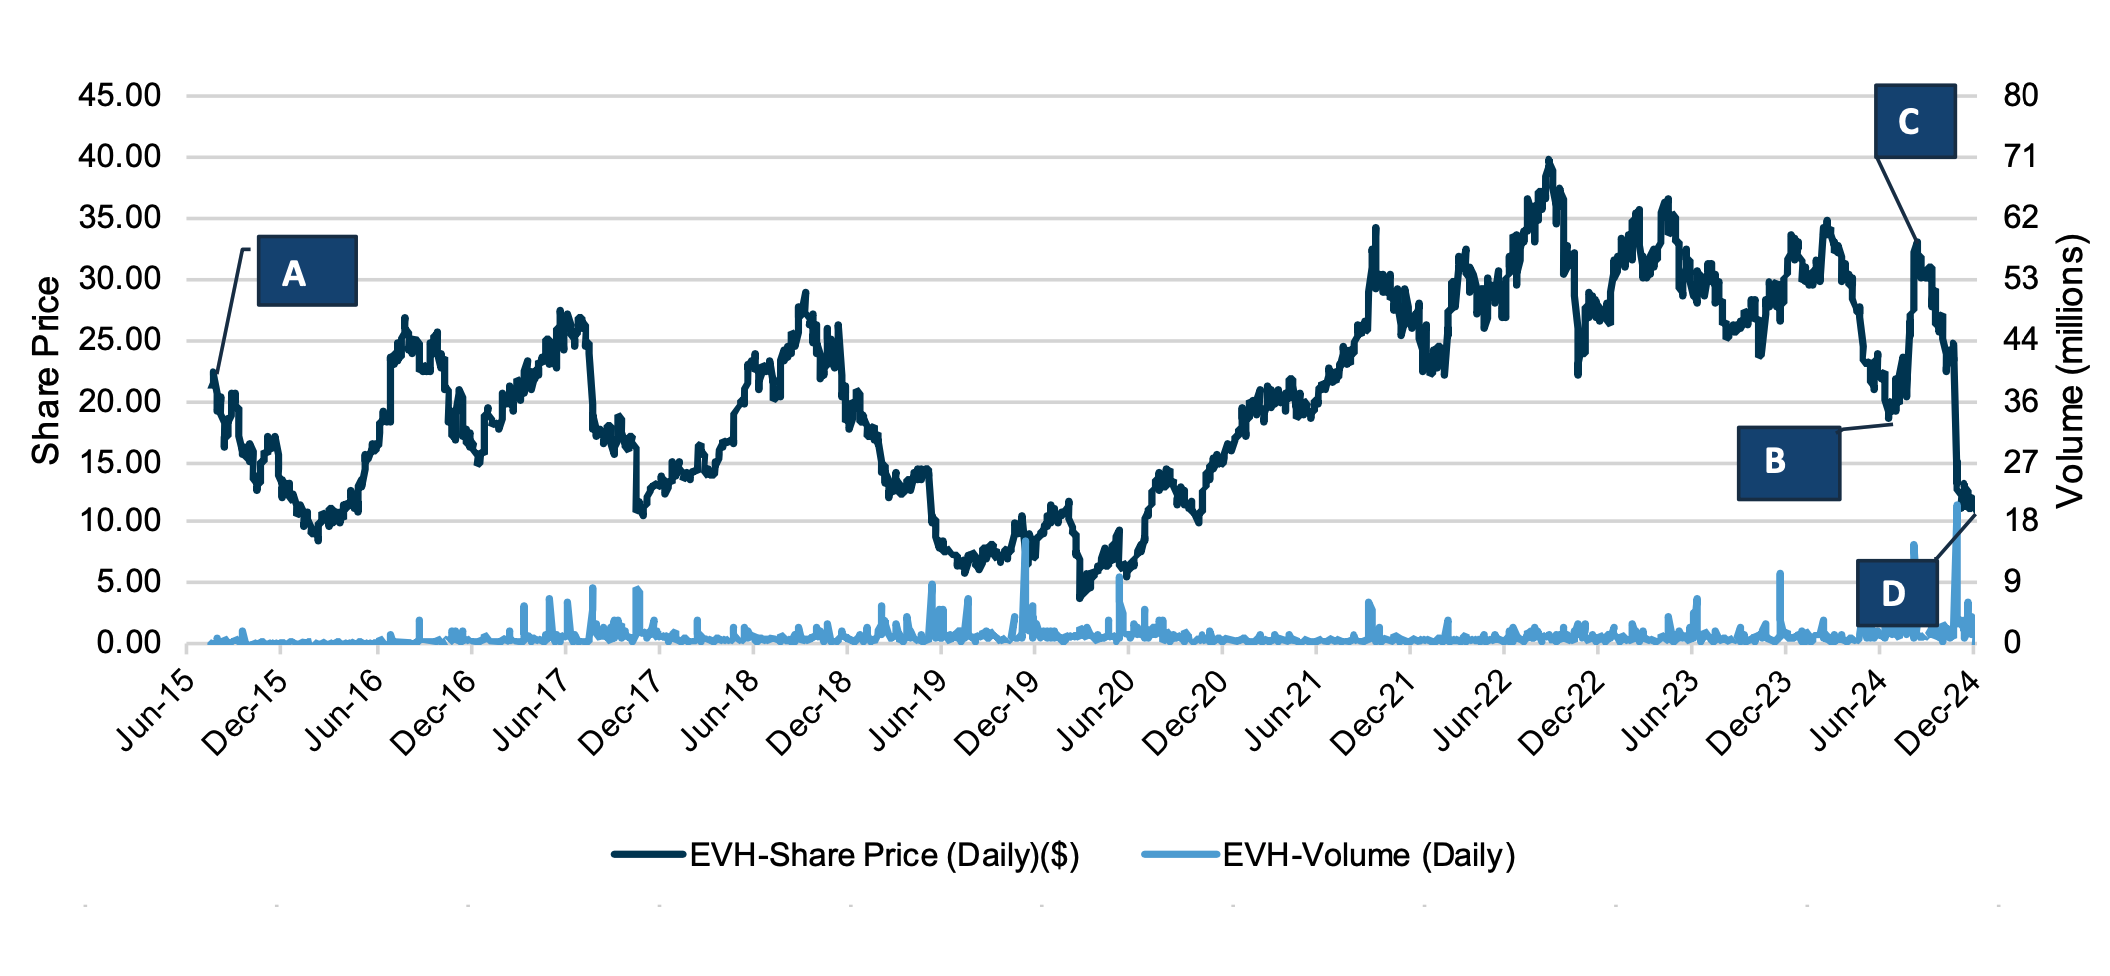
Click here to expand the image above
A few notes on EVH price volatility in recent quarters – we remain observers and may report further notable developments in future editions of this newsletter.
(A): Evolent Health, Inc. debuted on the New York Stock Exchange on June 5, 2015, raising $195 million and registering almost a $1 billion market cap.1 The stock price was $21.33 per share on July 31, 2015. EVH provides clinical and administrative technology services to help providers and payers with care management and the transition from fee-for-service to value-based care. The revenue model is a mix of risk-based (capitated) and subscription-based products, with the latter expected to contribute higher margins and the majority of EBITDA
over time.2
(B): EVH’s stock price fell approximately 42% from $32.79 per share at 1Q24-end to $19.12 per share at 2Q24-end, even as the Company reported first quarter revenue that beat expectations and adjusted EBITDA in line with prior guidance. The decline in price likely reflected risks around higher costs due to increased utilization in certain specialties, as well as general uncertainty due to an industry-wide disruption caused by a ransomware cyberattack on a large revenue cycle management company.3
(C): Evolent’s stock price rebounded in 3Q24, reaching a high of $31.98 on August 30, 2024 before closing at $28.28 at quarter end. Towards the end of August, the Company indicated it had received takeover interest from a number of private equity firms, including TPG, CD&R, and KKR.4
(D): EVH stock fell significantly after releasing 3Q24 earnings – revenue fell slightly short of expectations with more meaningful declines in adjusted EBITDA and guidance for the full year. The Company attributed the weaker performance to an unexpected $42 million increase in medical costs related to (risk-based) specialty services.5
1 “Software maker Evolent Health’s IPO priced at $17/share: underwriter,” available at https://www.reuters.com/article/technology/software-maker-evolent-healths-ipo-priced-at-17share-underwriter-idUSKBN0OK2I9/
2 Evolent Investor Day presentation, May 23, 2023 available at https://filecache.investorroom.com/mr5ir_evolent/117/IR-DAY-May-23-2003-FINAL.pdf
3 “1Q24 Beat and Raise on the Top Line with Three New Contracts Announced Demonstrating Strong End Market Demand,” J.P.Morgan North America Equity Research note May 9, 2024.
4 “Exclusive: Evolent Health in sale talks after receiving takeover interest, sources say”, Reuters Online available at https://www.reuters.com/markets/deals/evolent-health-sale-talks-after-inbound-interest-sources-say-2024-08-22/
5 “Evolent Announces Third Quarter 2024 Results,” available at https://ir.evolent.com/2024-11-07-Evolent-Announces-Third-Quarter-2024-Results
Trends in MedTech Valuation Step-Up Multiples 2024
The last several years have been interesting in the venture capital space. Venture capital financing increased rapidly in 2020 and 2021 and has fallen sharply since the 2021 peak. Less free-flowing capital for start-ups and early-stage companies has led to companies abandoning the “growth-at-all-costs” approach and instead looking for ways to improve profits in order to survive the lower growth post-covid environment. As a result, valuations have contracted, and many early-stage companies have had to raise down-rounds. Not only has start-up financing tightened over the last couple of years, but the step-up in valuation between rounds has also tightened in recent years.
The medtech industry followed the overall venture runup in 2020 and 2021 and was not immune to the drop in funding in 2022 and 2023; medtech venture funding fell 38% in 2022 and decreased a further 35% in 2023. Medtech funding has rebounded slightly in 2024 but is on track to remain well below levels seen in 2021. Against this backdrop, we look at the trends in valuation step-up multiples in this article.
Figure 1 :: Medtech Venture Funding has Decreased Sharply Since 2021 ($Billions)
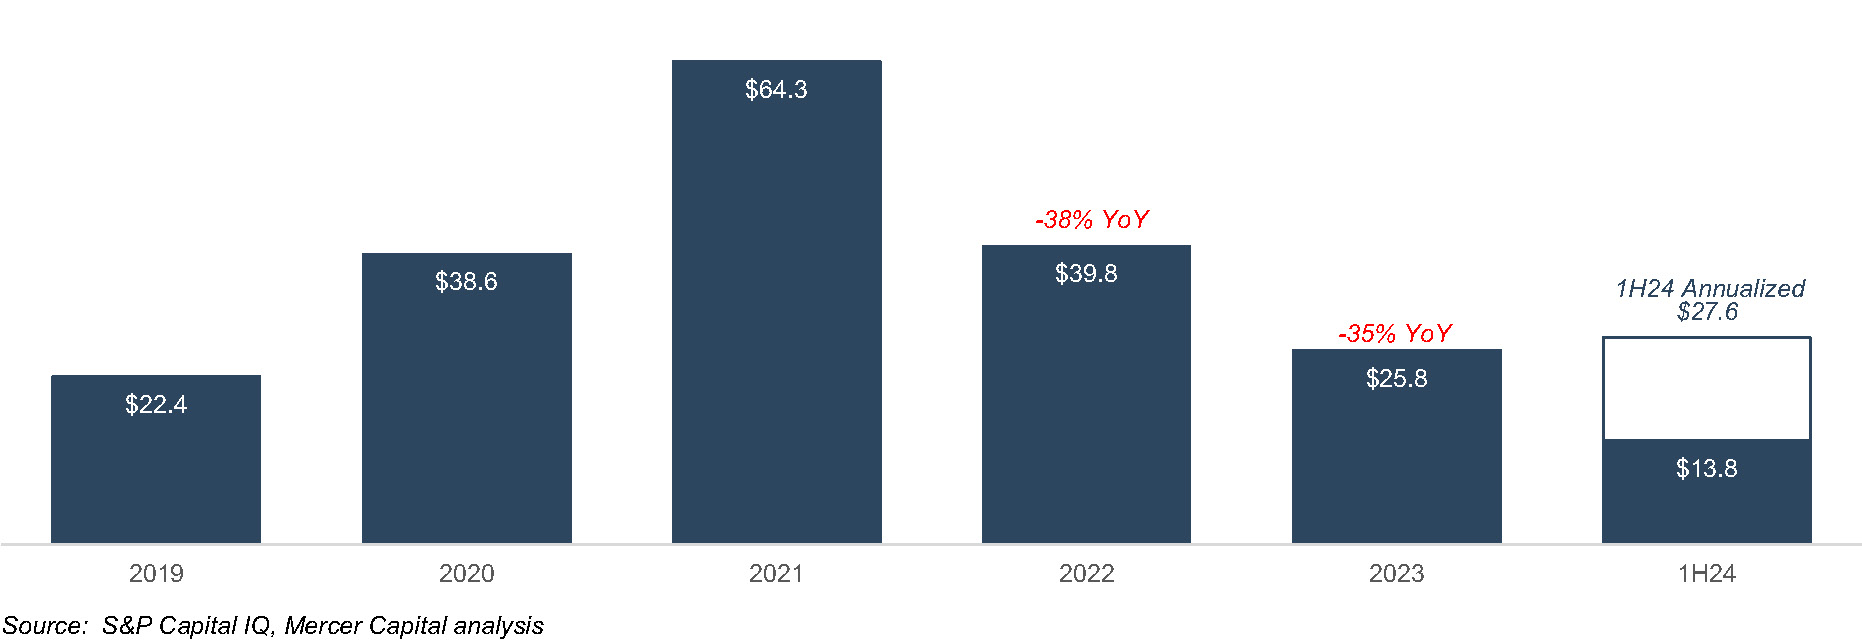
Click here to expand the image above
What Are Valuation Step-Up Multiples?
Valuation step-up multiples are a representation of the increase, or decrease, in a company’s valuation between rounds of funding. The multiple is calculated by dividing the most recent round’s implied valuation by the previous round’s implied valuation.1 For example, consider an early-stage company valued at $25 million (post-money) in its Series A funding round and valued at $50 million (pre-money) in its Series B funding round. The valuation step-up from Series A to Series B for this company would be 2.00x ($50 million/$25 million). In other words, the valuation at Series B was two times the valuation at Series A. As illustration, the following charts provide examples that illustrate the valuation history and implied step-up multiples for Therapymatch, Inc. (d/b/a Headway) and Brightside Health, Inc.2
Figure 2 :: Funding Evolution for Headway and Brightside Health

Click here to expand the image above
The valuation of an early-stage company can be influenced by many factors including technical milestone achievements, revenue growth, profitability profile, management team, industry trends and conditions, and the overall economy. Step-up multiples allow us to analyze how a company’s valuation has changed over time and between funding rounds. Step-up multiples greater than 1.0x imply that the company increased in value between rounds (up-round) while step-up multiples less than 1.0x imply that the company decreased in value between rounds (down-round). An increase in valuation between rounds can be because of exceeding financial performance expectations and/or achieving key milestones. And a decrease in valuation between rounds can signal that a company underperformed expectations and did not achieve specific milestones or benchmarks.
Why Are Valuation Step-Up Multiples Important?
It is important for management teams and operators to understand valuation step-up multiples because having knowledge of these multiples allows operators to diligently plan out the financing path of the company. Incorporating an understanding of valuation and the change in valuation between rounds informs how much capital an early-stage company needs to raise and when. The goal of a management team in raising the next round of financing for a company is to maximize the amount of money raised per percent of dilution. In other words, the goal is to raise the minimum amount of money in order to achieve the next milestone so that current owners do not unnecessarily give away ownership in the business. Step-up multiples provide a benchmark for operators to use to guide them while planning and evaluating the financing path of the company.
Investors also need an understanding of valuation and valuation step-up multiples. These also act as benchmarks for investors when evaluating investment opportunities and determining if a certain valuation is reasonable relative to others in the industry. Step-up multiples that are outside (either higher or lower) the range observed in a certain industry may need additional examination, and being able to spot these outliers can help investors find opportunities or avoid underperforming investments. Step-up multiples can also be a useful portfolio planning tool to help investors plan out potential investments in later rounds of a company, especially if they intend to participate in follow-on rounds.
Medtech Step-Up Multiples
Step-up multiples for an industry can vary over time due to industry conditions and overall economic conditions. Step-up multiples in the medtech space generally increased from 2019 to 2021 and then decreased from 2021 to 2023. The following graphs present the change in step-up multiples for early-stage medtech companies from 2019 to 2023 for Series A, Series B, and Series C rounds.
The median Series A medtech step-up multiple increased from 1.97x in 2019 to 2.42x in 2021 before falling to 1.46x in 2023 which represents a 40% decrease from 2021. The average step-up over the period was 1.96x.3
The median Series B medtech step-up multiple increased from 1.77x in 2019 to 1.96x in 2021 before falling to 1.91x in 2023. The average step-up over the period was 1.75x.4
Interestingly, the median Series C medtech step-up multiple peaked in 2019 at 1.70x and fell every year except for 2021. The median Series C step-up multiple in 2023 was 1.16x, and the average step-up over the period was 1.35x. 5
As medtech industry conditions evolve, we will keep a watchful eye on the development of step-up multiples in the future and publish periodic updates.
Figure 3 :: Medtech Step-Up Multiples
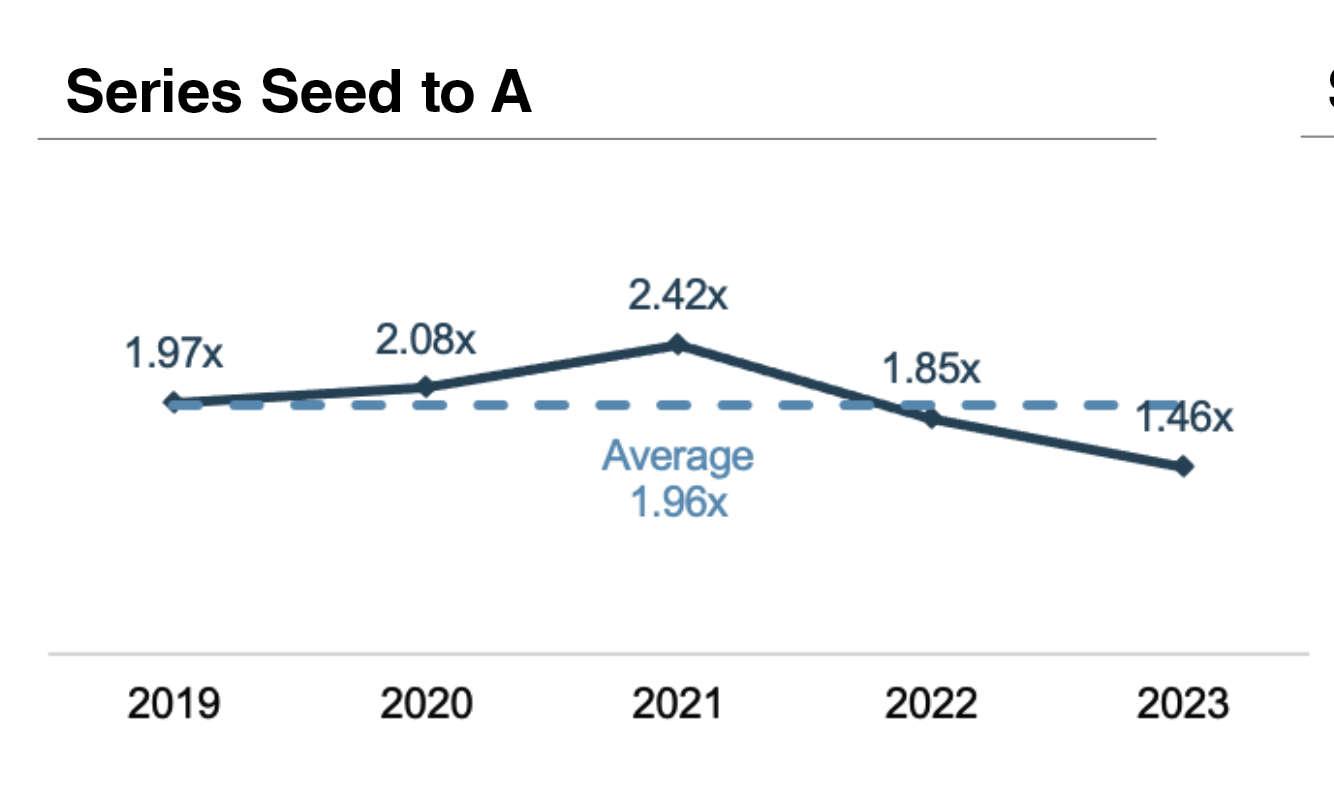
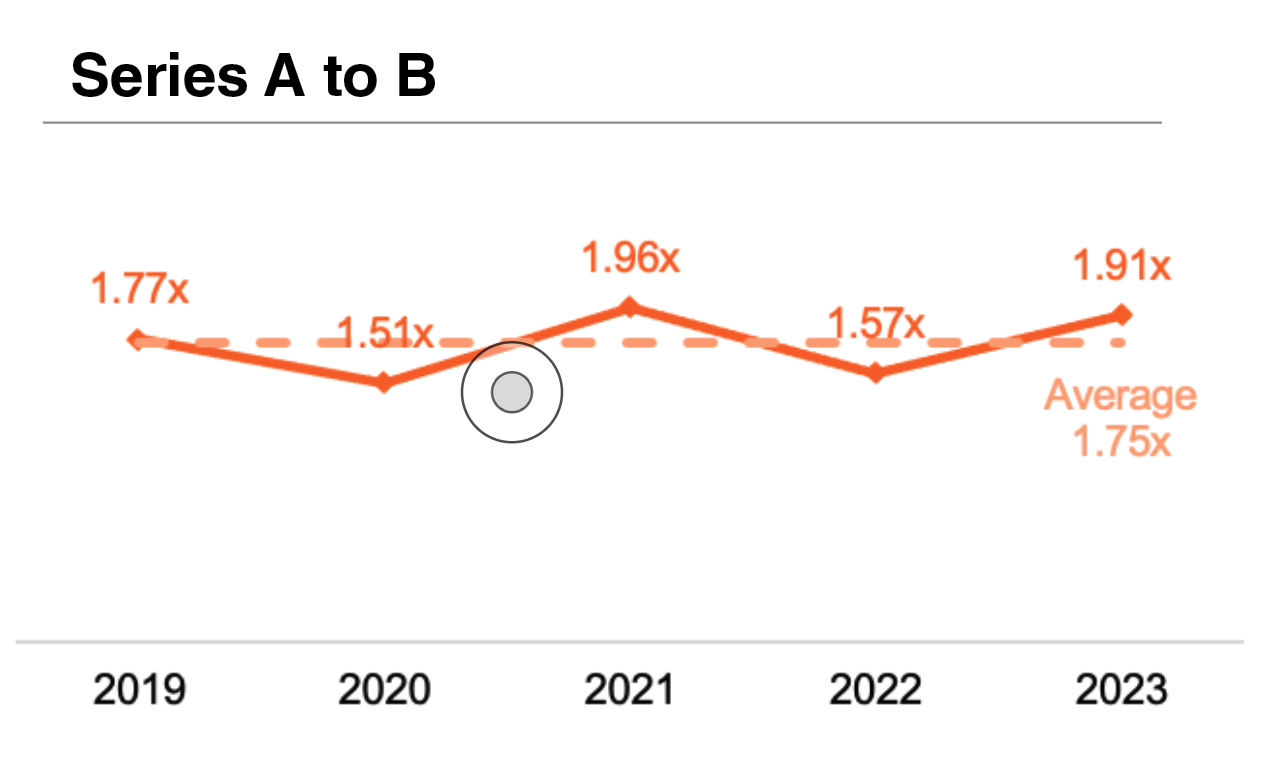

Endnotes:
1 Step-up in valuation is defined as


Usually, valuation refers to total equity value, although on a fully-diluted basis this should be equivalent to using per share prices.
2 Headway operates a platform that connects patients with in-network licensed therapists and mental health professionals. Brightside Health operates a platform that offers online therapy sessions, personalized treatment plans, and medication management.
3,4,5 The following summarizes additional data underlying Figure 3 (source: S&P Capital IQ).


Evolving Need for Estate Planning Amid Legislative Shifts
The 2024 elections delivered a Republican sweep of the Presidency and Congress, setting the stage for potential tax policy changes. The likely extension of tax provisions from the 2017 Tax Cuts and Jobs Act, which are currently set to expire on December 31, 2025, is central to the uncertainty. The potential ten year maximum extension would include maintaining the elevated estate and gift tax lifetime exclusion amount of $10 million, indexed for inflation ($13.99 million in 2025). However, legislative realities may lead to a shorter extension than ten years or even modifications to the exemption altogether.
The federal budget reconciliation process, which allows tax legislation to pass with a simple Senate majority, will play a key role in shaping these policies. Specifically, the potential $4.6 trillion deficit impact over a decade for extending all 2017 tax cuts adds complexity to negotiations. The estate and gift tax provisions are projected to contribute $189 billion to this total cost of the tax plan and remain a politically charged element of the debate.
Other tax changes being proposed include potential reductions to corporate tax rates and exemptions for specific income categories like overtime pay. However, these would require additional revenue offsets, such as limiting state and local tax (“SALT”) deductions, further complicating legislative negotiations.
For estate planning, the stakes are high. The elevated lifetime exclusion amount is one of the most significant opportunities for reducing future estate tax liabilities, allowing individuals to transfer substantial wealth that falls under the threshold tax-free. However, the political and fiscal landscape introduces critical timing considerations:
- Estate and gift tax planning is a long-term endeavor: Tax policy is not static; it is modified periodically due to changes in the executive branch of government, composition of legislative bodies and judicial rulings. Tax policy of today is not necessarily the tax policy of tomorrow. Conversely, current tax policy that is repealed may be again enacted in the future. The cornerstone of effective estate and gift tax planning may well be in executing a consistent long-term strategy of gifts that embraces the inherent strength of moving future asset appreciation to subsequent generations.
- For those hesitant to make large gifts: While some may prefer to wait for legislative clarity, it may make sense to begin preparing the gifting groundwork now. Structuring trusts and preparing for future decisions can ensure readiness if the exclusion extension is less favorable than anticipated.
- For those comfortable making gifts: High-net-worth individuals who are confident in making large transfers now stand to benefit significantly. Transferring wealth under the current exclusion ensures future appreciation is removed from taxable estates, maximizing potential tax savings.
WHY MERCER CAPITAL?
With over 40 years of experience, Mercer Capital is uniquely suited to support estate planning efforts, especially for clients with privately held businesses. Mercer Capital’s opinions are well-reasoned and thoroughly documented. Our internal review and quality control processes are designed to generate expedited results that meet best practices in process and analysis, particularly in situations where service and delivery needs are high. Mercer Capital also offers comprehensive services for complex entities and business models.
Here is what sets us apart:
- Proven Track Record. Mercer Capital professionals have prepared thousands of valuations that have been accepted as reported. The quality work product we prepare facilitates acceptance by the IRS at an initial reporting level. In the rare event of an examination, our quality work product provides legal counsel with the capital market evidence, cogent analysis and substantiation that is essential to successfully resolve such disputes.
- IRS-Compliant Standards. Given heightened IRS scrutiny in recent years, our team adheres to strict valuation methodologies and reporting guidelines, such as Revenue Ruling 59-60 and the Adequate Disclosure Regulations for Gifts. The dedication to adhere to authoritative guidance places clients in a position of strength well before for a potential audit, and importantly, greatly increases accepted as filed outcomes.
- Specialized and Industry-Informed Experience. We perform valuations for family-owned and closely held businesses in many industries. We publish a number of industry-specific blogs and newsletters for industries where we share our expertise and insight.
- Collaborative & Client-Focused Service. We work closely with business owners, attorneys, accountants, and other advisors, tailoring our approach to fit the unique facts and circumstances of each engagement. There is no “one size fits all” approach to valuation, and Mercer Capital takes the time to ensure a personalized, appropriate, and high quality work product.
- Broad Range of Other Valuation Services. In addition to valuation services for estate and gift tax reporting, we provide valuations for financial reporting, buy-sell agreements, shareholder disputes, litigation support and management consulting, ensuring continuity across other client needs.
PREPARING FOR UNCERTAINTY
The 2024 election outcomes highlight that estate planning is no longer a static process but one that requires vigilance, adaptability and a long-term perspective. The next few years will be crucial for those looking to secure their legacies under a tax regime still in flux.
If you would like to discuss how we can assist you and your clients, we’d be happy to engage in a conversation. Thank you for considering Mercer Capital as a resource for your clients’ estate planning needs.
Legislative Update Source: Steve Akers, Bessemer Trust: “Tax Legislative Impacts of Republican Sweep in 2024 Elections; What Will Happen to the Estate and Gift Tax Basic Exclusion Amount?” November 2024.
Moo Deng’s Post-Election Outlook for the Banking Industry

While BankWatch’s focus on the banking industry remains as unrelenting as ever, we remain attuned to the latest social media phenomena. Therefore, BankWatch was swept up in the viral sensation of Moo Deng, a baby pygmy hippo. Moo Deng—whose name translates to “Bouncy Pork”—is a chubby, sassy little creature resident in a Thai zoo that captured the internet with antics like a moonwalking routine. While BankWatch has a soft spot for critters like Moo Deng, what really caught our attention was Moo Deng’s accurate prediction of the U.S. presidential contest.1 Outperforming many human forecasters (including those older than the four month old hippo), Moo Deng did not see the election as a toss-up. Instead, when faced with two bowls of food labeled Harris and Trump, she went straight for the Trump one.
Given Moo Deng’s stunning prognostication, what would the Oracle of the Khao Kheow Open Zoo expect for the next four years?
Animal Spirits
We are not sure if Moo Deng is familiar with John Maynard Keynes, who coined the term “animal spirits” to mean the emotional factors or herd instincts that can influence decision-making. But Moo Deng’s animal spirits apparently have lifted tourism to Thailand, with people waiting for hours to catch a glimpse of the hippo. For bank stocks, is the post-election boom a case of investors’ animal spirits, or is something else at work?
Post Election Performance: 13 Days After 2016 & 2024 Elections
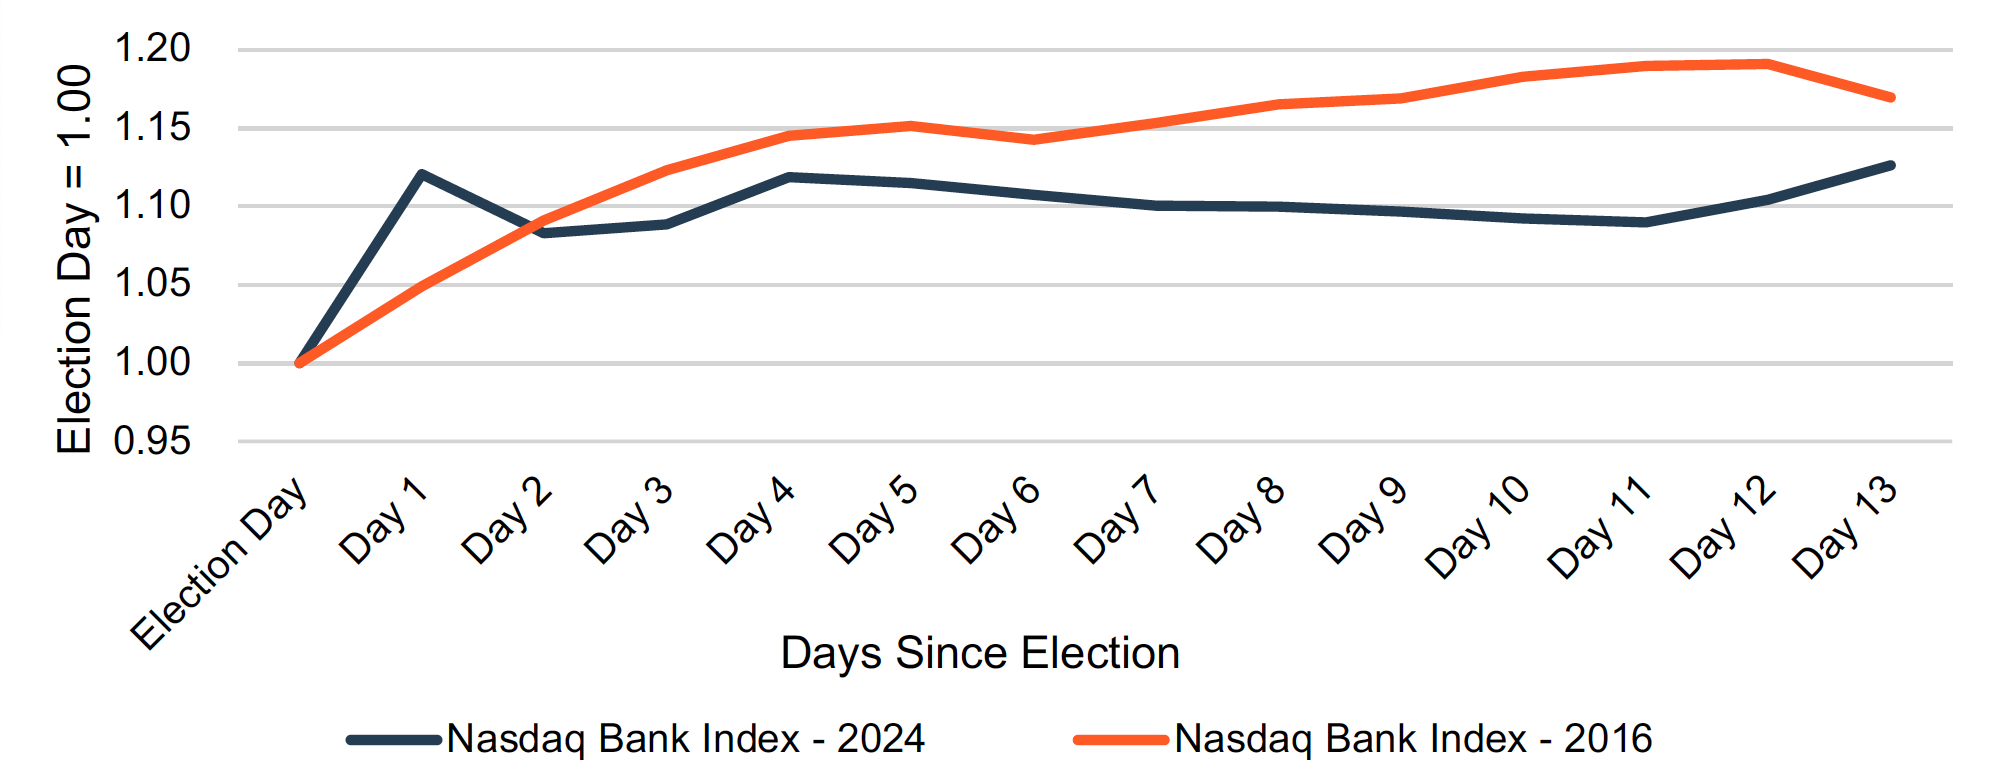
Source: S&P Capital IQ Pro; Mercer Capital Analysis
We reviewed bank stock indices immediately after the 2016 and 2024 elections. Immediately after the 2024 election, bank stocks were almost as popular as Moo Deng, as the Nasdaq Bank Index rose by 12% the first day after the election (see chart above). Then, bank stocks remained relatively stable before increasing again 12 and 13 days after the election. The situation was somewhat different in 2016, with positive changes in the index compounding over many days. Of the first 13 trading days after the election, the Nasdaq Bank index increased for 11 days after the 2016 election versus only five days after the 2024 election. Cumulatively, the index increased by 13% the first 13 days after the 2024 election relative to 17% after the 2016 election. This compares to a 3.2% increase for the S&P 500 in the 13 days after the 2024 election, similar to the 2.9% increase after the 2016 election.
Several factors likely explain the recent market movement and foretell future trends:
- Bouncy Bouncy… After the Nasdaq Bank index declined by 24% between year-end 2021 and 2023, bank stocks were due for a rebound in 2024, as liquidity fears subsided, credit issues remained manageable, and profitability showed signs of improvement.
While the Nasdaq Bank index was flat the first half of 2024, an inflection point in net interest margins led to improving investor sentiment in the second half of 2024. Between year-end 2023 and election day, the Nasdaq Bank index bounced back by 15%. The election may have caused a realization among investors that bank stocks were relatively cheap (compared to the broader market), the worst fears regarding commercial real estate loan losses are not going to be realized, and EPS growth may well be relatively strong in 2025 and 2026 as net interest margins recover (even if returns on assets remain below long-term averages for another one to three years). The result was another 13% bounce in the Nasdaq Bank Index after the election.
- Cleaning up after a hippo. Any discussion of banks’ shifting fortunes after the election includes the regulatory environment. We are reminded of a quote by JP Morgan’s CEO, Jamie Dimon, shortly before the election regarding recent rulemaking activity: “I’ve had it with this s***.” While community banks are not directly affected by regulations like the Basel III endgame, Dimon’s blunt statement nevertheless captured the sentiment of many bankers.
The past four years have been marked by robust, to put it mildly, regulatory activity covering areas ranging from brokered deposits, CRA, credit card and overdraft fees, interchange fees, open banking, fintech, small business borrower data, and M&A. In addition, regulatory exams have appeared to sometimes take an adversarial tone, with exam issues being elevated to public enforcement actions more often. As one of the more heavily regulated industries, banks would stand to benefit more than most businesses from a deregulatory environment.
The pace of financial services rulemaking likely will slow after the election, but uncertainty surrounds which Biden era regulations will be, or can be, rolled back. Certain sectors, like fintech and crypto, are almost certain to benefit from deregulation, but this probably is not the type of deregulation bankers have in mind. In addition, Trump offered his own populist suggestions during the campaign that would not sit well with banks, such as capping credit card interest rates at 10%.
- Zookeepers. Managing Moo Deng’s celebrity status requires talented and dedicated zookeepers. Similarly, the banking regulatory agencies need experienced leaders that can (in a perfect world) design the least intrusive regulations that meet the agencies’ safety and soundness objectives. In the first Trump administration, well-regarded agency heads like Jelena McWilliams at the FDIC had a deregulatory bent but largely maintained the status quo.
Trump’s cabinet nominees have certainly been an, err, eclectic bunch so far, which complicates predicting the banking agencies’ future leadership. A more likely scenario is the agencies are staffed by individuals with banking industry experience, like Ms. McWilliams, who probably will maintain continuity with some loosening of regulations. The less likely scenario, and one more fraught with risk for the industry, is a “blow the place up” nominee. For banks that favor stability, this may introduce too much change, with the regulatory pendulum swinging widely depending on which party’s nominees are in charge of the banking agencies.
- Funding Moo Deng’s lifestyle. We do not know if Moo Deng is taxpayer supported, but we do know that in Trump’s first term the top corporate tax rate fell from 35% to 21%. Banks often benefit less than other industries from the tax preferences in the tax code, such as regarding accelerated depreciation and R&D. As a result, banks’ effective tax rates are closer to the marginal rate. Therefore, the change in the marginal rate under the Tax Cuts & Jobs Act—which was led by Speaker Paul Ryan to a greater extent than the Trump Administration—had a more significant impact on banks’ after-tax profitability than for many other businesses.
Trump has proposed lowering the marginal corporate tax rate from 21% to 15%, although numerous tax cut promises to other constituencies exist. Tax cuts fueled the performance of bank stocks during the first Trump administration and could again during the second Trump Administration. However, the benefit to banks’ after-tax net income of changing the corporate tax rate to 15% is an order of magnitude smaller than reducing the rate to 21% under the TCJA.
Animal Spirits, Again. Loan growth has been sluggish in 2024, although many community banks will be able to rely on widening NIMs to produce revenue growth for awhile longer. At some point, though, banks will need organic growth to maintain earnings momentum. If a combination of tax policy, deregulation, and greater confidence among consumers and businesses scrapes some barnacles off the economy’s boat, all the better from banks’ standpoint.
Feeding Frenzy
In the presidential picking contest that faced Moo Deng, she picked between “watermelon cakes” labeled Harris and Trump. If there is anything that makes bank investors more excited than Moo Deng when offered a juicy watermelon cake, it’s M&A.
Bank M&A has been in the doldrums since 2021, although activity has risen in 2024. There are a number of factors contributing to this dearth of deals:
- Lower stock prices, which meant that buyers were unable to meet sellers’ (nominal) pricing objectives
- Interest rate marks on loans and securities that affect buyers’ post-transaction regulatory capital and tangible book value earn-back
- Lower profitability, which convinced sellers to postpone M&A discussions
- Regulatory uncertainty
These factors led to the number of announced bank M&A transactions falling to 171 in 2022, 101 in 2023, and 113 through November 22. 2024 (see chart on the next page), or 2% to 4% of the prior year number of institutions. These factors should be alleviated, at least in part, in coming years:
- The Nasdaq Bank Index increased by 31% between June 30, 2024 and November 22, 2024. Buyers have stronger currencies for deals; even if the seller receives the same number of the buyer’s shares as they would have received in 2022 or 2023, the nominal deal value will be higher after the election.
- Interest rate marks will diminish. Lower interest rates, particularly in the intermediate part of the yield curve, reduced interest rate marks on debt securities and loans in banks’ third quarter financial reports.
Significant deficit spending may lead to higher interest rates, which complicates the outlook. Putting that issue aside, though, the passage of time will cure the rate mark issue. Loans originated in the 2020 and 2021 vintages with rates that were fixed at origination for five years will mature or reprice in the next one to two years. Regardless of what happens with rates, a significant share of loans originated in 2020 and 2021 will mature or reprice during the second Trump administration, eliminating the rate mark issue altogether for those loans. Long-term, low-rate bonds purchased in 2020 and 2021 will linger, though.
- Net interest margins have begun to improve for many banks, which should continue as rates on funding sources adjust downward while pandemic era assets mature or reprice. As NIM compression created negative operating leverage when interest rates increased—with revenue declining to a greater extent than operating expenses—banks will benefit from positive operating leverage as the rate cycle turns.
Further, an environment marked by a steeper yield curve may be a boon to bank earnings. Some investors may feel burned by asset/liability models that predicted banks would benefit from a large upward shock in interest rates, such as occurred in 2022. Therefore, investors may take a wait and see attitude towards yield curve steepening.
- In September 2024, the FDIC, the OCC, and the Department of Justice issued new policies on bank merger transactions. New regulations, coupled with a generally stricter regulatory environment, have led to longer merger approval timelines. Large bank M&A has been particularly hampered by regulatory uncertainty.
We are not aware of post-election efforts to roll-back the September 2024 FDIC, OCC, and DoJ policies; however, application of these policies to announced transactions will fall to the Trump administration’s regulators. In a deregulatory zeitgeist, it is difficult to believe that the Trump era bank regulators will be more restrictive towards bank M&A activity than during the Biden administration.
While the market may believe the Trump administration will grease the skids of bank M&A, there is another view, however. Vice President-elect Vance has spoken favorably of Federal Trade Commission head Lina Khan, the bete noire of CEOs of large businesses. In February 2024, Mr. Vance stated: “And I guess I look at Lina Khan as one of the few people in the Biden administration that I think is doing a pretty good job.”
Announced Bank M&A Transactions (2016 – November 22, 2023)
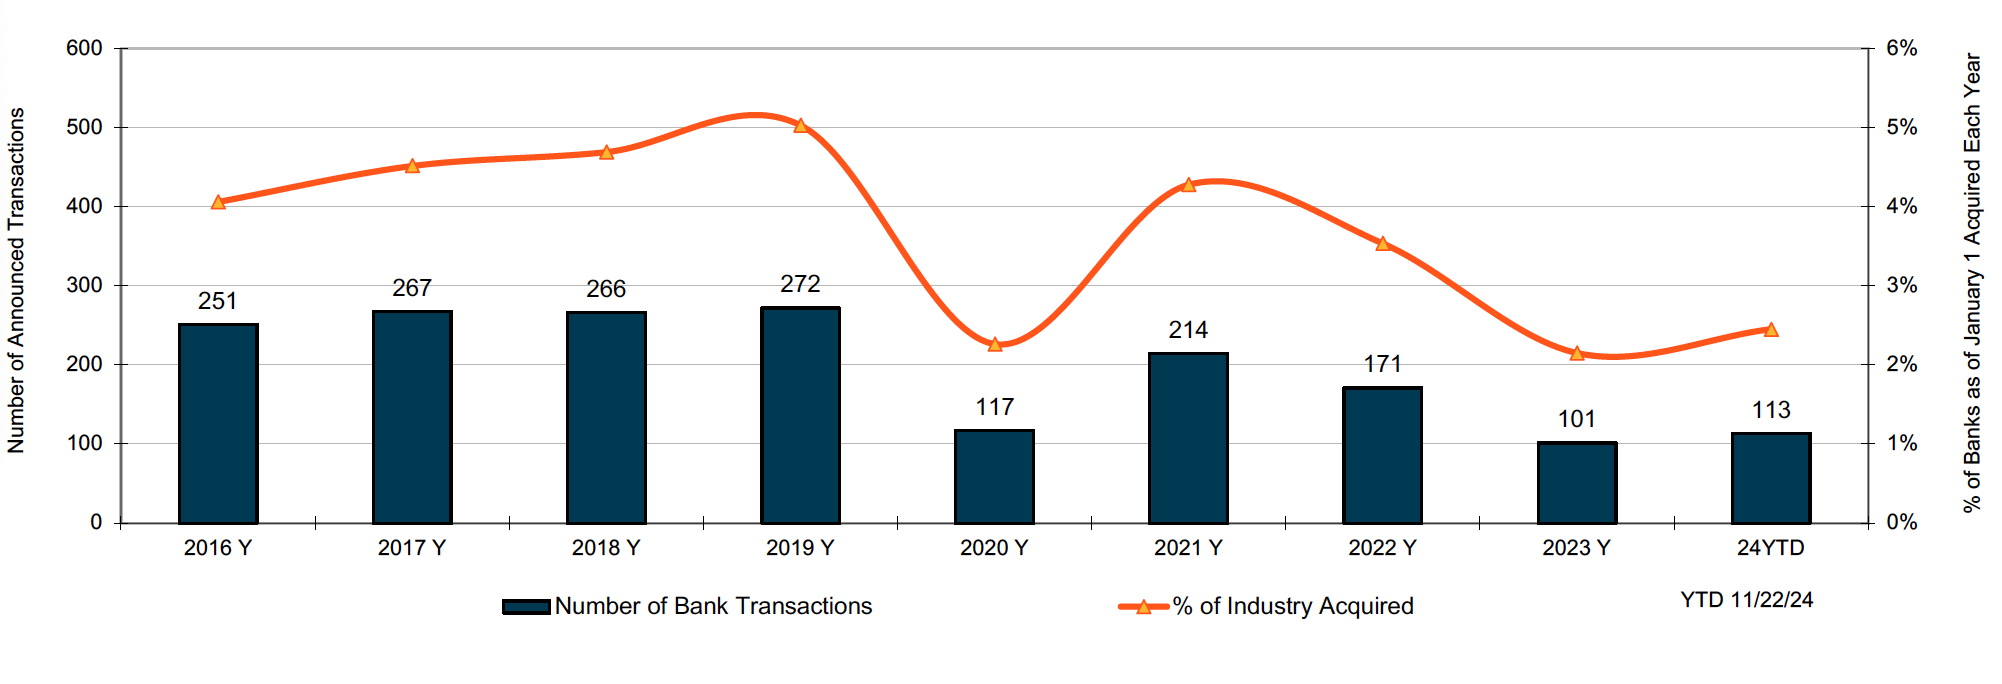
Click here to expand the image above
The preceding factors, a stable economy, and a deficit of deals since 2022 suggest to us (or should that be Moo Deng doing the suggesting?) that bank M&A should trends towards historical activity levels, with 4% to 5% of the industry absorbed annually through merger.
More Watermelon Cakes
The table below shows bank stock index returns from November 8, 2016 (election day in 2016) to December 31, 2019 (pre-Covid). Index performance varied, but the Nasdaq Bank Index increased by a cumulative 30%, which equates to an 8.8% compound annual growth rate.
Trump Stock Index Returns (Pre-Covid)

What might happen if Moo Deng were to face another challenge: picking between watermelon cakes with signs indicating that the CAGR in the Nasdaq Bank Index would be above or below 8.8% during the Trump II administration? It would not surprise us if Moo Deng goes for the “over 8.8%” cake:
Banks are due for a rebound after poor performance in 2022 and significant underperformance in 2023 relative to the S&P 500.
While some larger banks may face earnings pressure from falling short-term rates, many banks will have an earnings tailwind from improving NIMs.
More M&A.
Tangible book value should at least grow by 8.8% in coming years, given that the recapture of unrealized losses on securities will augment retained earnings growth.
Incoming administrations, like baby hippos, can be unpredictable. Budget deficits, higher intermediate to long-term interest rates, trade wars, and shooting wars are among the factors that could cause us to consult Moo Deng’s expertise again.
Richard Fuld, Spirit Airlines, and Fairness
Spirit Airlines, Inc. (OTCEM:SAVE.Q) filed for bankruptcy protection on November 18, 2024. Spirit’s journey to bankruptcy illustrates two saws about M&A: time is the enemy of all deals; and most surprises are negative when the subject matter is M&A.
The prepackaged filing in which creditors will equitize $795 million of debt and inject an additional $350 million of equity brings closure to a long running corporate saga that began in February 2022 when Spirit agreed to be acquired by Frontier Group Holdings, Inc. (NASDAQ:ULCC) for a combination of stock (1.93 exchange ratio) and cash ($2.13 per share) that at announcement equated to $25.83 per share ($2.9 billion).
JetBlue Airways Corp. (NASDAQ:JBLU) subsequently made an unsolicited $33 per share all cash offer in April 2022 that was initially rejected. However, the Spirit board terminated the Frontier deal during July 2022 after JetBlue sweetened its offer to provide a) $33.50 per share of cash ($3.8 billion) with $2.50 per share payable upon approval of the deal by Spirit shareholders; b) a monthly ticking fee of $0.10 per share up to $0.65 per share commencing in January 2023; and c) $70 million termination fee if the agreement was terminated for failure to obtain regulatory approval.
In our first prior posts on the matter (here and here), we speculated that the Spirit board may have calculated that JetBlue was a risk worth taking because
- The offer was 30% greater than Frontier’s offer;
- JetBlue provided $425 million ($4.30 per share) of downside protection; and
- A jilted Frontier presumably would be willing to reengage Spirit if the JetBlue deal failed.
Spirit shareholders ultimately received $3.65 per share of cash from JetBlue upon shareholder approval of the deal and payment of the ticking fees, while the termination fee was paid to Frontier in March. Nonethless, Spirit’s shares never traded remotely close to the announced deal value because investors correctly concluded that the Department of Justice would successfully challenge a merger that would eliminate a low-cost carrier while positioning JetBlue as the fifth largest carrier.
While the Frontier deal was not a sure bet either, investors at the time viewed the Frontier-Spirit combination as more likely to avoid or prevail in a Department of Justice challenge because the deal represented a combination of two small low-cost carriers that would result in a stronger company focused on budget conscious consumers.
From the perspective of Spirit’s common shareholders, the decision to terminate the Frontier deal in favor of JetBlue was a colossal mistake by the board of directors. Aside from the DOJ challenge that was initiated in March 2023, industry profitability weakened materially during 2H23 due to excess capacity, rising costs and issues with Pratt & Whitney engines that grounded some Airbus planes, including some of Spirit’s.
Assuming the Frontier transaction closed during the first quarter of 2023, the deal value would have been worth $21 to $27 per share based upon Frontier’s trading range. Shareholders could have sold their Frontier shares for cash, or continued to hold Frontier shares that today would be worth about $11 per share plus have $2.13 per share of cash before considering taxes.
Hindsight is easy of course. Richard Fuld, CEO of Lehman Brothers from 1994 until the company filed for bankruptcy in September 2008, had opportunities to sell the company in 2007 and early 2008 before the financial crisis intensified. Even in the months prior to the filing, one or more transactions appeared possible until it was too late. Fuld and the board (or Fuld leaning on the board) held out for a better deal or a rescue organized by the Fed. Neither happened.
Likewise, the Spirit board took a risk that it could get a better deal than Frontier’s and thereby wiped out its common shareholders in the bankruptcy filing. While JetBlue’s offer was clearly superior because it was all cash and higher than the Frontier offer, Frontier’s shares never traded meaningfully higher once JetBlue made its initial unsolicited $33 per share offer in April 2022. The market signaled that the board would be taking a sizable risk in terminating the Frontier merger agreement.
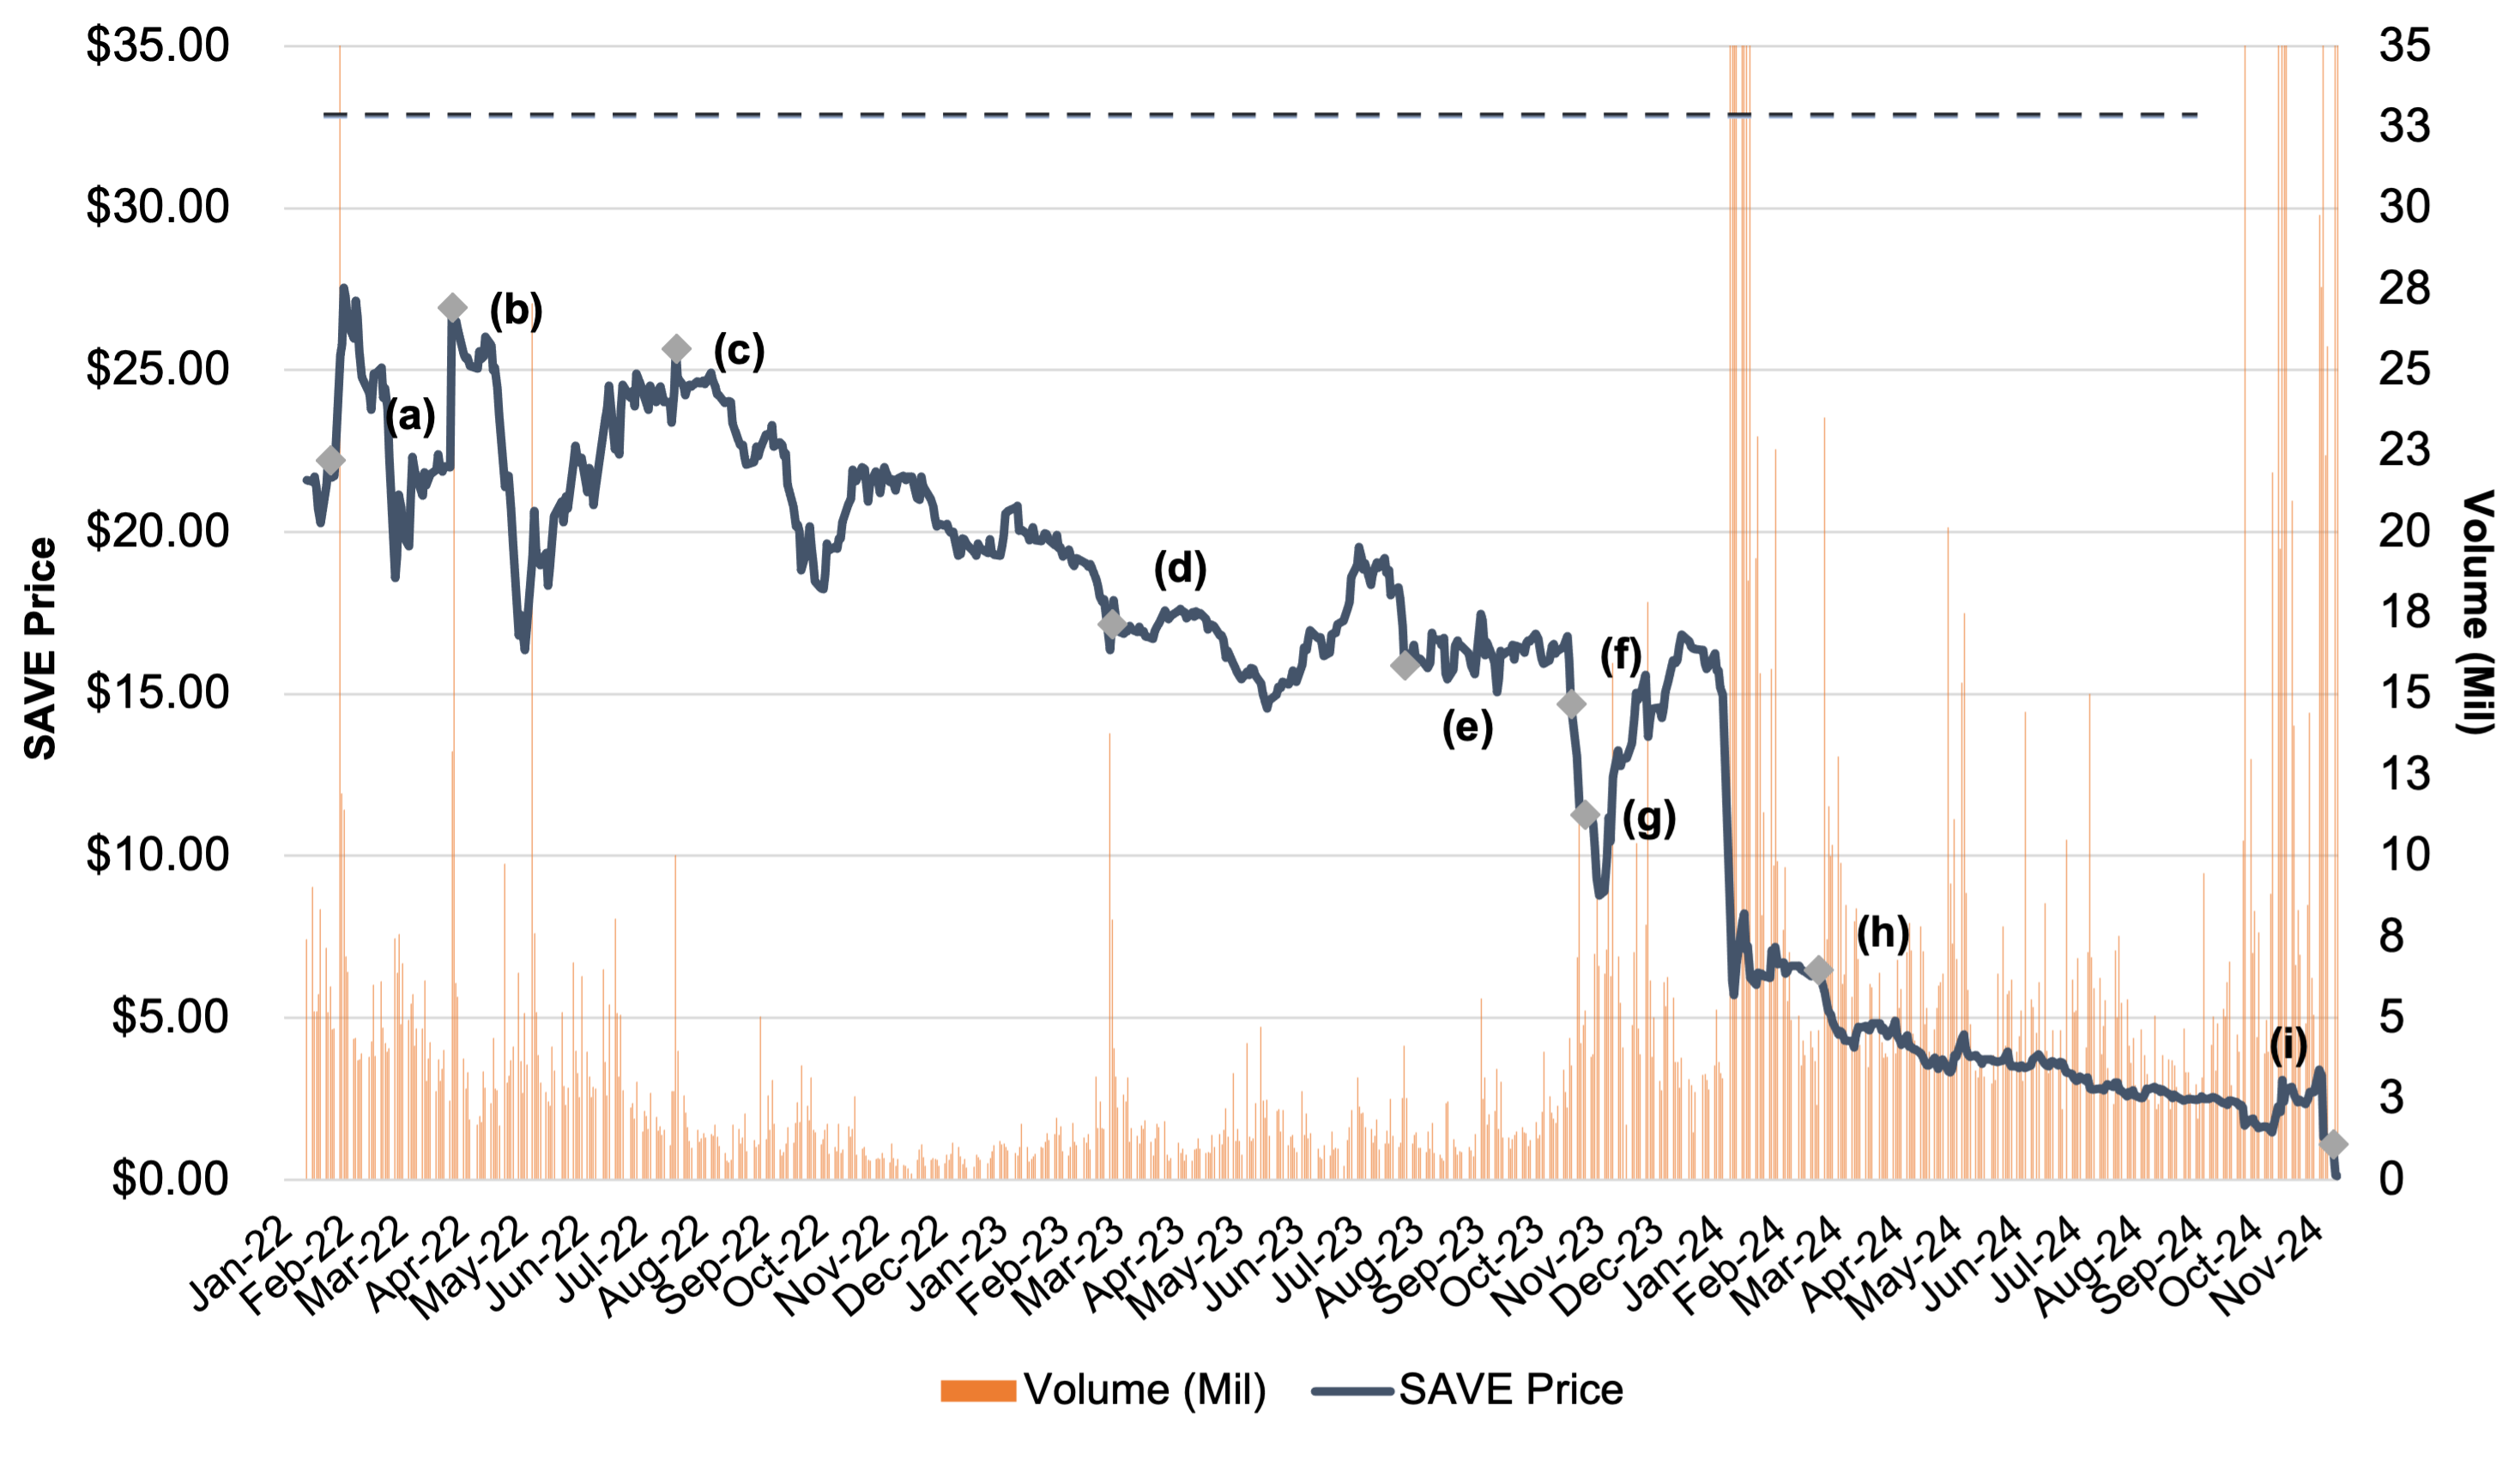

Given the price and terms of the JetBlue deal, rendering fairness opinions by Spirit’s financial advisors (Morgan Stanley and Barclays) in July 2022 should have been a straightforward exercise; however, one deal point a board must always consider is the ability of a buyer to close. Morgan Stanley’s and Barclay’s fairness opinions addressed the fairness of the proposed consideration to be paid to Spirit’s shareholders. The opinions did not assign any probability to JetBlue’s ability to close other than assume the merger would be consummated under the terms specified in the Merger Agreement.
Among the factors the board considered that weighed against approving the deal was the risk that regulators would block the deal. These concerns were voiced by Frontier and some investors when JetBlue made its unsolicited offer in April 2022; however, the board approved the merger anyway, perhaps figuring JetBlue offered downside payments and that Frontier would still be an option if Washington nixed the JetBlue transaction.
Expanding Reach and Elevating Expertise
Mercer Capital’s Fall 2024 Highlights
As the holiday season is upon us, and with Thanksgiving around the corner, I would be remiss not to reflect and share highlights from a bustling fall season at Mercer Capital. We are very grateful and thankful for the experiences, opportunities, and interactions with many of you! To highlight a few of our speeches and/or sponsorships since August, spanning coast to coast:
- Attorney/Trust Officer Liaison Conference – Palm Beach, FL
- Society of Louisiana CPA’s Forensic, Litigation & Valuation Conference -New Orleans, LA
- Ole Miss Family Business Symposium – Oxford, MS
- Bank Director Training Forum – Nashville, TN
- Virginia Society of CPAs’ Forensic & Valuation Conference
- ASA International Conference – Portland, OR
- Association of Trust Organizations 2024 Annual Meeting – Frisco, TX
- Logistics Summit – Memphis, TN
- Hart Energy Capital Conference – Dallas, TX
- ABA Webcast on SCOTUS vs. Connelly
- NADC (National Dealerships Conference) Fall 2024 – Nashville, TN
- National Association of Royalty Owners National Convention – Dallas, TX
- 2024 Florida AAML Chapter Retreat – Memphis, TN
- BVIUK Virtual Expert Summit
- Florida Bar 2024 Tax Section Fall Meeting – Hollywood Beach, FL
- 2024 AICPA & CIMA Forensic & Valuation Conference – Dallas, TX
- The ESOP Association’s 2024 Employee Owned Conference – Las Vegas, NV
- Tennessee Federal Tax Conference – Franklin, TN
We are honored to have been a part of these various events and are grateful for the partnerships and relationships, both new and old, formed and strengthened during the fall ‘conference season.’
Additional highlights from our fall season include a successful annual firm retreat, where professionals from all our offices gathered at the historic Peabody Hotel in Memphis, Tennessee. Two Mercer Capital professionals co-authored and released a booklet, Essential Financial Documents to Gather During Divorce. Four Mercer Capital professionals contributed to the newest edition of Shannon Pratt’s The Lawyer’s Business Valuation Handbook, published in October by the ABA Family Law Section and ASA. A Mercer Capital professional was honored at the AICPA Forensic & Valuation Conference with a Standing Ovation Award, recognizing rising professionals in the forensic and valuation professional industry. And most recently, Mercer Capital acquired Business Valuation Analysts, LLC, headquartered in Winter Park, Florida, strengthening our valuation tax services and deepening our commitment to serve the general Florida market. And we still have 6 more weeks to go in 2024!
From all of us at Mercer Capital, we send best wishes to you and yours in the upcoming 2024 holiday season!

